. 2012 Dec 1;520(17):4032-49.
doi: 10.1002/cne.23159.

Dopamine and full-field illumination activate D1 and D2-D5-type receptors in adult rat retinal ganglion cells

Affiliations

Dopamine and full-field illumination activate D1 and D2-D5-type receptors in adult rat retinal ganglion cells

Genki Ogata et al. J Comp Neurol. .

Abstract

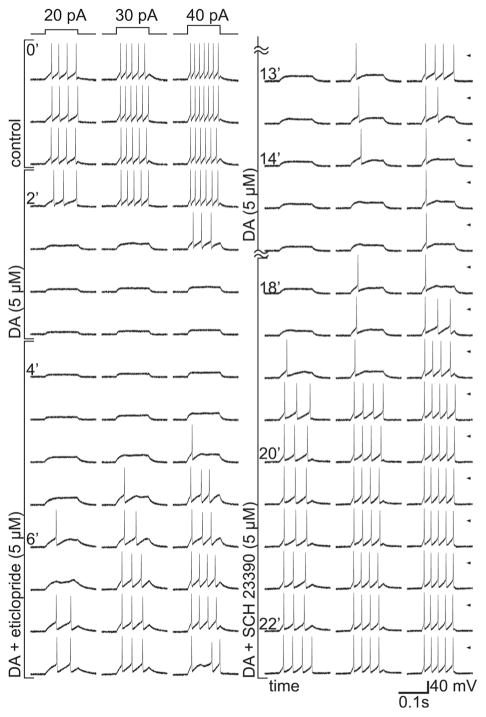
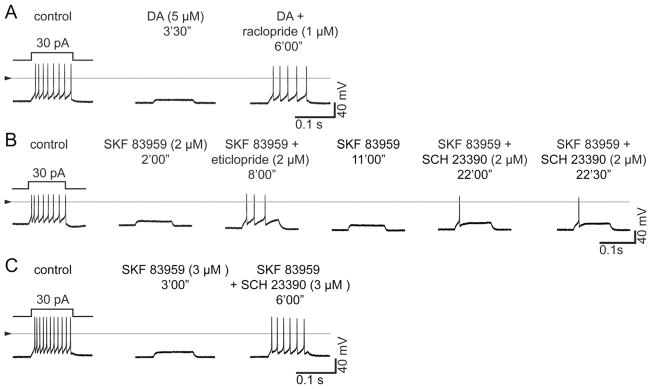
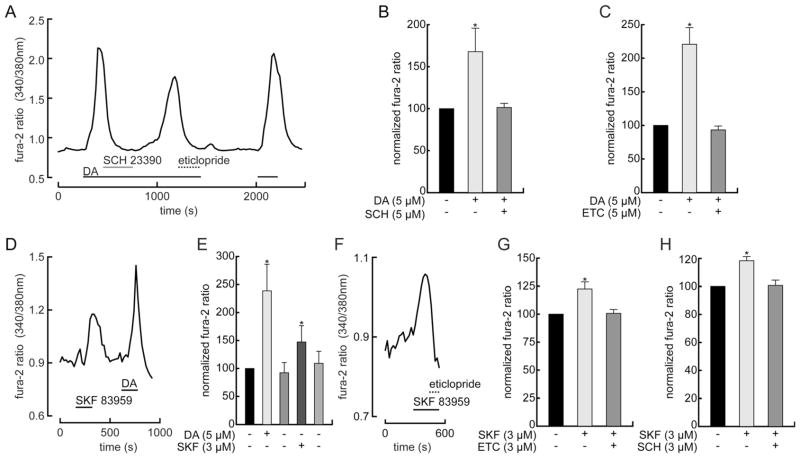
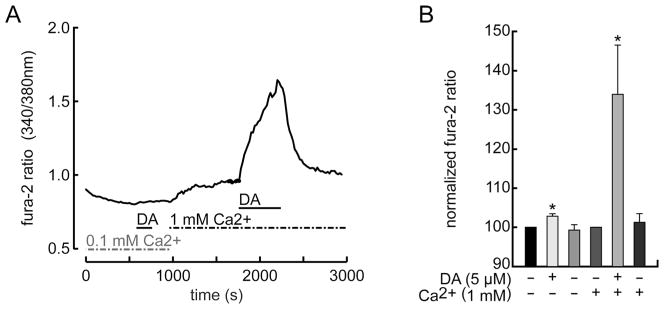
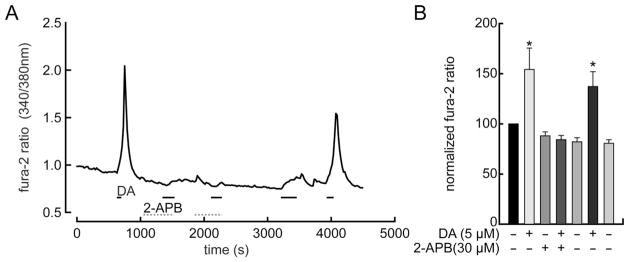
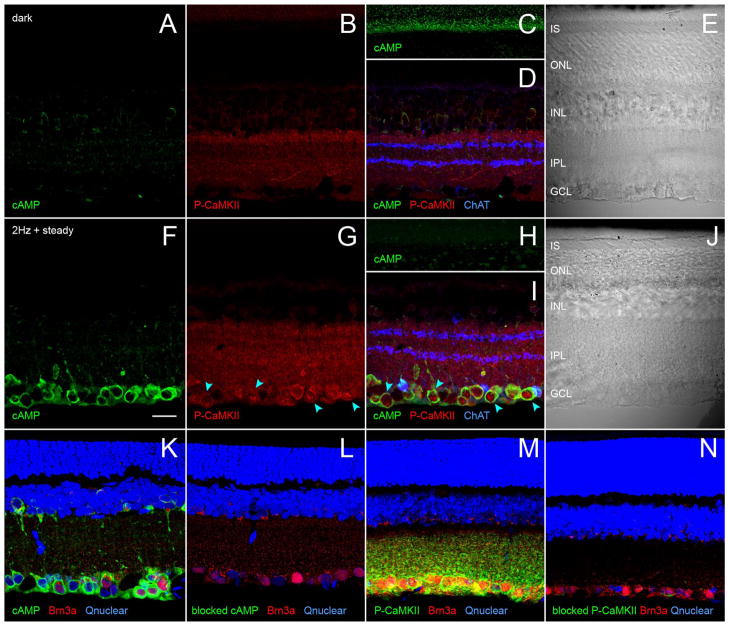
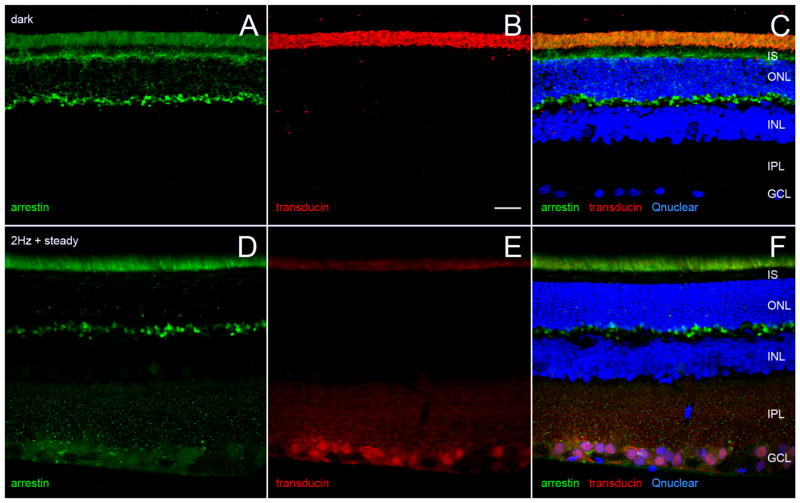
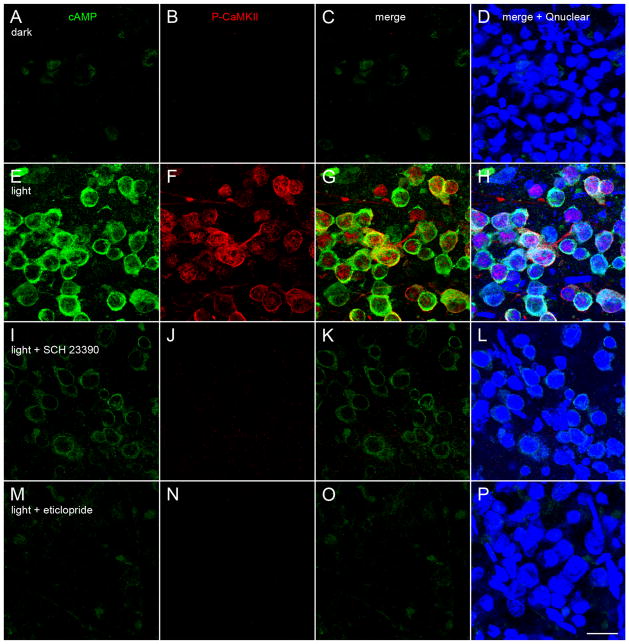
Dopamine can regulate signal generation and transmission by activating multiple receptors and signaling cascades, especially in striatum, hippocampus, and cerebral cortex. Dopamine modulates an even larger variety of cellular properties in retina, yet has been reported to do so by only D1 receptor-driven cyclic adenosine monophosphate (cAMP) increases or D2 receptor-driven cAMP decreases. Here, we test the possibility that dopamine operates differently on retinal ganglion cells, because the ganglion cell layer binds D1 and D2 receptor ligands, and displays changes in signaling components other than cAMP under illumination that should release dopamine. In adult rat retinal ganglion cells, based on patch-clamp recordings, Ca(2+) imaging, and immunohistochemistry, we find that 1) spike firing is inhibited by dopamine and SKF 83959 (an agonist that does not activate homomeric D1 receptors or alter cAMP levels in other systems); 2) D1 and D2 receptor antagonists (SCH 23390, eticlopride, raclopride) counteract these effects; 3) these antagonists also block light-induced rises in cAMP, light-induced activation of Ca(2+) /calmodulin-dependent protein kinase II, and dopamine-induced Ca(2+) influx; and 4) the Ca(2+) rise is markedly reduced by removing extracellular Ca(2+) and by an IP3 receptor antagonist (2-APB). These results provide the first evidence that dopamine activates a receptor in adult mammalian retinal neurons that is distinct from classical D1 and D2 receptors, and that dopamine can activate mechanisms in addition to cAMP and cAMP-dependent protein kinase to modulate retinal ganglion cell excitability.


Conflict of interest statement

CONFLICT OF INTEREST

No identified conflicts.

Figures

Figure 1
Figure 1
Eticlopride and SCH 23390 block inhibition of spike firing by dopamine. Voltage responses to 100-ms constant-current injections in a single, dissociated retinal ganglion cell. Ruptured-patch, whole-cell mode at 35°C. Injection timing and intensity (20–40 pA) are indicated above the first row of traces and were identical in all other rows. Recordings displayed in the order they were collected, from upper left to lower right. Elapsed time indicated along the left side of each column of traces. Dopamine (5 μM), eticlopride (5 μM), and SCH 23390 (5 μM) included in superfusate as labeled next to each row of traces. First three rows show consistency and frequencies of spiking elicited in control solution. Dopamine inhibits this spiking, and both eticlopride and SCH 23390 block this inhibition. Note that dopamine was applied continuously from the fourth row of spikes (t = 2 min) until the end of the recording (lower right corner), and the antagonists were added to the dopamine-containing superfusate.
Figure 2
Figure 2
Block of spike firing inhibition by dopamine and by SKF 83959. Recording conditions as in Figure 1. Each row (A–C) shows voltage responses of a single dissociated retinal ganglion cell to 100-ms constant-current injections in solutions as labeled. Triangles and horizontal lines mark ground level for each row of recordings. (A) Spikes in control solution (left), inhibition of spike firing by dopamine (5 μM, middle), and reversal of this inhibition by raclopride (1 μM) (right). (B) Inhibition of spike firing by SKF 83959 (2 μM) is counteracted by eticlopride (2 μM) and by SCH 23390 (2 μM). After the control spikes were recorded in A–C, the indicated agonists (dopamine, SKF 83959) were continuously superfused over the cells recorded from for the remainder of each recording. Antagonists were applied together with the agonist and were washed away with agonist-containing superfusate. The inhibition of spiking is partially reversed by each antagonist at the concentrations shown. Repeated current injections confirm that SCH 23390 counteracts the inhibition by SKF 83959 (B). A fuller reversal of the SKF 83959 response was achieved with 3 μM SCH 23390 (C).
Figure 3
Figure 3
SCH 23390 and eticlopride block increases in intracellular free Ca2+ by dopamine and by SKF 83959. A: Continuous plot of fluorescence intensity ratio (340/380 nm) of fura-2 (Ca2+-bound/Ca2+-free) in single retinal ganglion cell. Cell is continuously superfused with saline at 33°C. Dopamine (DA, 5 μM), SCH 23390 (5 μM), and eticlopride (5 μM) were included in superfusate during times indicated by horizontal bars under fluorescence ratio plot. Dopamine elevates free Ca2+, and both SCH 23390 and eticlopride suppress this increase. Note that dopamine was applied continuously from t = 250 seconds until t = 1,400 seconds, and that each dopamine receptor antagonist reduces Ca2+ back to the control level. After washing away the dopamine and eticlopride, dopamine elicits a third increase in Ca2+ with a peak and rate of rise similar to that of the first response. Summary of measurements obtained in all imaging sessions with dopamine and SCH 23390 (B, n = 6 cells) and dopamine and eticlopride (C, n = 3 cells). Fluorescence intensity ratios in test solutions are normalized for each cell to value measured in control solution. Height of bars plot means. Error bars plot 1 SEM. D: Continuous plot of fura-2 fluorescence intensity ratio, measured and formatted as in (A). SKF 83959 (3 μM) and dopamine (DA, 5 μM) included in superfusate during times indicated by horizontal bars. Both agonists increase free Ca2+, and these rises are reversed by washing with agonist-free solution. In this and other figures the response to SKF 83959 rose as quickly as the response to dopamine, but typically reached a smaller peak amplitude. E: Summary of dopamine and SKF 83959 response amplitudes (n = 4 cells, normalized and formatted as in B) shows that both agonists produced statistically significant increase in fluorescence intensity ratio. F: Continuous plot of fura-2 fluorescence intensity ratio, measured and formatted as in (A). SKF 83959 (3 μM) and eticlopride (3 μM) included in superfusate during times indicated by horizontal bars. G,H: Summary of peak intensity ratios (normalized and formatted as in A) show that SKF 83959 produced statistically significant increase in fluorescence intensity ratio and that these ratios were reduced to control levels by eticlopride (G, n = 5 cells) and by SCH 23390 (H, n = 4 cells).
Figure 4
Figure 4
Elevation of intracellular Ca2+ depends on extracellular Ca2+. A: Continuous plot of fura-2 fluorescence intensity ratio, measured and formatted as in Figure 3. Dopamine (DA, 5 μM, at t = 600–750 sec) barely increases free Ca2+ after extracellular Ca2+ is lowered from 1.0 mM to 0.1 mM, but elicits robust increase in Ca2+ after extracellular Ca2+ is raised back to 1 mM. B: Summary of peak intensity ratios (normalized and formatted as in Fig. 3) shows that dopamine response was markedly reduced by reducing extracellular Ca2+ from 1.0 to 0.1 mM (n = 4 cells).
Figure 5
Figure 5
2-APB blocks elevation of intracellular Ca2+ by dopamine. A: Continuous plot of fura-2 fluorescence intensity ratio, measured and formatted as in Figure 3. Dopamine and 2-APB are added to superfusate during times indicated by horizontal bars. Due to multiple applications, time-base is slower than in other figures. First application of dopamine (DA, 5 μM) reversibly elevates intracellular free Ca2+ in control solution. Twenty μM 2-APB reduces Ca2+ rise by second dopamine application. Thirty μM 2-APB completely precludes Ca2+ increase by third dopamine application. After washing with control saline for ~1,000 seconds, dopamine elicited a small increase in Ca2+ (at t = 3,300 sec). Ca2+ returned to the baseline level after washing with control saline. The final dopamine application (around t = 4,000 sec) elicited a robust and fully reversible Ca2+ increase. B: Summary of peak intensity ratios (normalized and formatted as in Fig. 3) shows that the dopamine response was suppressed by 2-APB, that this suppression was reversed by washing with control solution, and that 2-APB by itself did not reduce intracellular Ca2+ level below control levels (n = 7 cells).
Figure 6
Figure 6
Light elevates cAMP and activates CaMKII in retinal ganglion cell somata. Vertical vibratome sections of dark- and light-adapted retinae collected and processed side-by-side; immunostained for cAMP, phosphorylated CaMKII, cell markers, and a nuclear stain. Fields are confocally imaged under epifluorescence illumination (A–D,F–I,K–N) or differential interference contrast (DIC) illumination (E,J). One optical section of a dark-adapted retina with the cAMP-, P-CaMKII-, and choline acetyltransferase (ChAT)-like immunoreactivities assigned to the green (A,C,D), red (B,D), and blue (D) channels, respectively. The green, red, and blue channels are merged in D. E: The DIC image of the same field as in A–D. The retinal sublayers in A–D match those in E, namely IS (inner segments), ONL (outer nuclear layer), INL (inner nuclear layer), IPL (inner plexiform layer), and GCL (ganglion cell layer). C: Imaged at a higher photomultiplier gain than A to show the cAMP signal in the photoreceptor inner segment layer. F–J show a light-adapted retina, formatted identically as in A–E. F–I are imaged at identical confocal microscope settings as corresponding panels in A–D. Light adaptation increases number and intensity of cells binding cAMP and P-CaMKII antibodies in the ganglion cell layer, without noticeably changing the intensity or characteristic pattern of ChAT antibody binding in IPL (D,I). Illumination elevates cAMP in the cytoplasm of ganglion cell layer somata, elevates P-CaMKII in cytoplasm and nuclei of the same somata (e.g., those at blue arrowheads), and lowers cAMP staining in the IS. K–N are paired sections of light-adapted retinae, bound to Brn3a and either cAMP or P-CaMKII antibodies, stained with a nuclear stain (Qnuclear), imaged at identical settings, and oriented as in A-J. Pairs compare binding of cAMP antibody (K) and cAMP antibody preincubated in cAMP (L), and P-CaMKII antibody (M) and P-CaMKII antibody preincubated in immunogen (N). All three color channels are merged in each panel, showing cAMP elevation (K) and CaMKII activation (M) by illumination in Brn3a-immunopositive ganglion cells, and the absence of detectable binding of cAMP antibody preincubated in cAMP (L) and of P-CaMKII antibody preincubated in immunogen (N) despite light-adaptation. A magenta-green copy of this figure is available online as Supporting Information. Scale bar = 20 μm in F (applies to all).
Figure 7
Figure 7
Light adaptation of distal retina by illumination that alters cAMP and P-CaMKII in ganglion cells. A–C: Single vertical vibratome section of the same dark-adapted retina as in Figure 6A–E. D–F: Single vertical vibratome section of the same light-adapted retina as in Figure 6F–J. Sections are immunostained for arrestin (green) and transducin (red), and counterstained with Qnuclear (blue). C,F: Merge arrestin, transducin, and Qnuclear panels of dark- and light-adapted retinae, respectively. Each pair of images (A/D, B/E) was confocally imaged at identical settings. A,C,F: Arrestin immunoreactivity in inner segment layer of dark-adapted retina but not in light-adapted retina. Comparison of A vs. D, B vs. E, C vs. F shows that light adaptation increases intensity of arrestin staining and concomitantly decreases intensity of transducin staining in outer segment layer. Retinal layers labeled in C and F as in Figure 6. A magenta-green copy of this figure is available online as Supporting Information. Scale bar = 20 μm in B (applies to all).
Figure 8
Figure 8
D1 and D2 antagonists block light-induced cAMP increase and CaMKII activation in situ. Flat-mounted retinae maintained overnight in absolute darkness by organotypic culture and immunostained for cAMP and P-CaMKII. These retinae were dissected, cultured, processed, and imaged together. Each row shows a different retina, confocally imaged at the ganglion cell layer. Each field is 10,627 μm2 and merges four serial optical sections (0.44-μm steps). As labeled at the left of each row, A–D was aldehyde-fixed in darkness; E–H was illuminated (as in Figs. 6, 7) for 45 minutes prior to fixation; I–L was exposed to 4 μM SCH 23390 in darkness for 5 minutes, illuminated for 45 minutes (with an additional 2 μM SCH 23390 added), then aldehyde-fixed; and M–P was exposed to 4 μM eticlopride in darkness for 5 minutes, illuminated for 45 minutes (with an additional 2 μM eticlopride added), then aldehyde-fixed. As labeled at the top of the figure, A,E,I,M show the cAMP-like immunoreactivity in these retinae; B,F,J,N show the P-CaMKII-like immunoreactivity in the same fields; C,G,K,O merge the cAMP and P-CaMKII fields; and, on top of these, D,H,L,P show the cells stained by Qnuclear. A magenta-green copy of this figure is available online as Supporting Information. Scale bar = 20 μm in P (applies to all).

Similar articles

Cited by

References

    1. Abdel-Majid RM, Tremblay F, Baldridge WH. Localization of adenylyl cyclase proteins in the rodent retina. Mol Brain Res. 2002;101:62–70. - PubMed
    1. Berrera M, Dodoni G, Monterisi S, Pertegato V, Zamparo I, Zaccolo M. A toolkit for real-time detection of cAMP: insights into compartmentalized signaling. Handb Exp Pharmacol. 2008;186:285–298. - PubMed
    1. Bjelke B, Goldstein M, Tinner B, Andersson C, Sesack SR, Steinbusch HW, Lew JY, He X, Watson S, Tengroth B, Fuxe K. Dopaminergic transmission in the rat retina: evidence for volume transmission. J Chem Neuroanat. 1996;12:37–50. - PubMed
    1. Brainard GC, Morgan WW. Light-induced stimulation of retinal dopamine: a dose-response relationship. Brain Res. 1987;424:199–203. - PubMed
    1. Brann MR, Young WS., III Dopamine receptors are located on rods in bovine retina. Neurosci Lett. 1986;69:221–226. - PubMed

Publication types