. 2012 Jul 27;287(31):25905-16.
doi: 10.1074/jbc.M112.364869. Epub 2012 Jun 7.

Intracellular proton-mediated activation of TRPV3 channels accounts for the exfoliation effect of α-hydroxyl acids on keratinocytes

Affiliations

Intracellular proton-mediated activation of TRPV3 channels accounts for the exfoliation effect of α-hydroxyl acids on keratinocytes

Xu Cao et al. J Biol Chem. .

Abstract

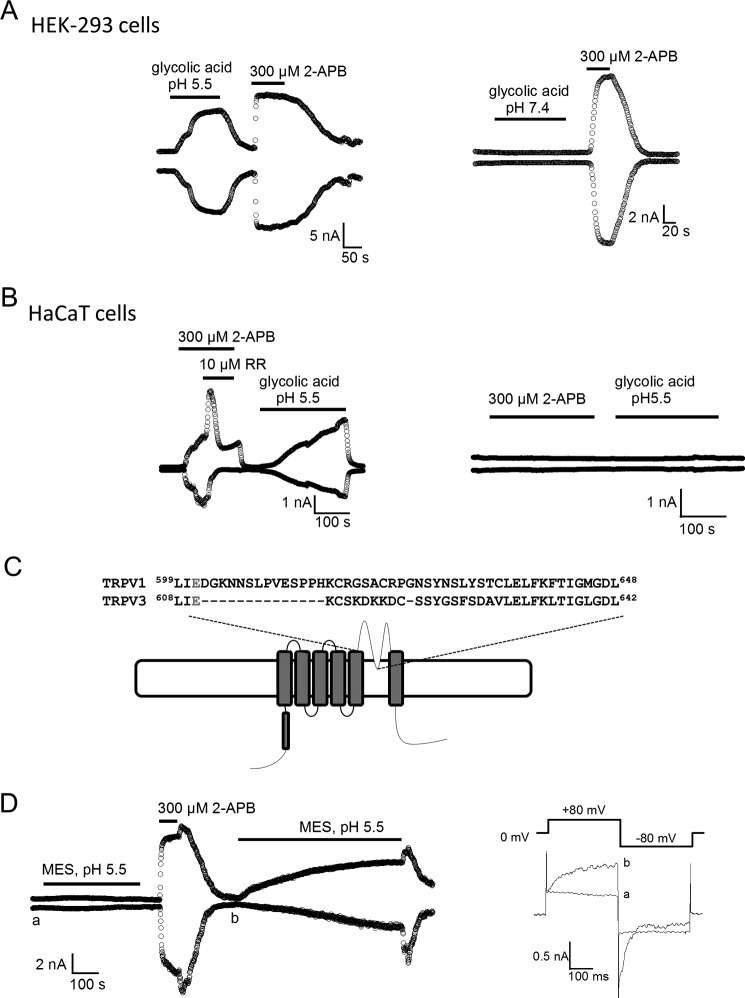
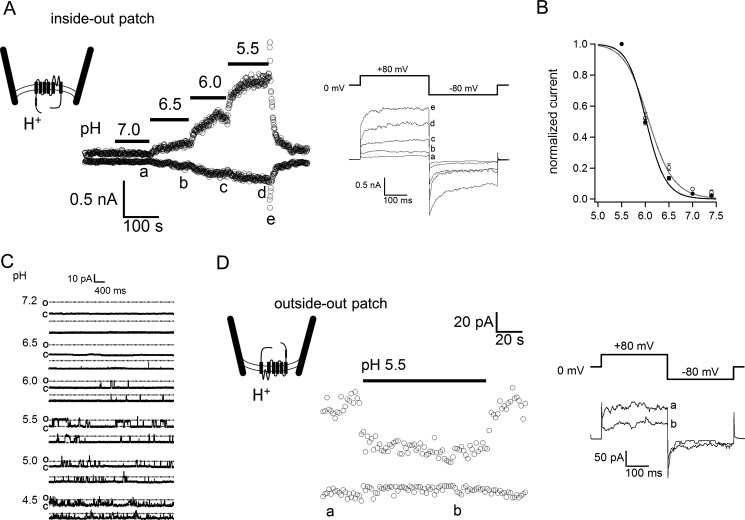
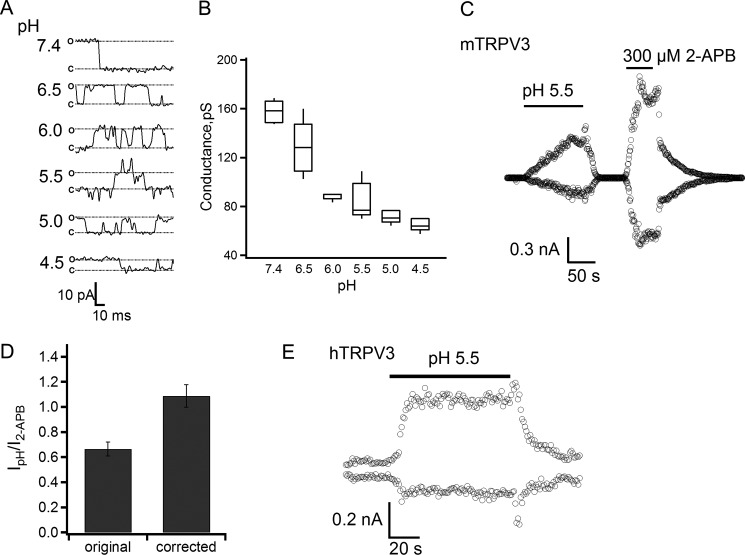
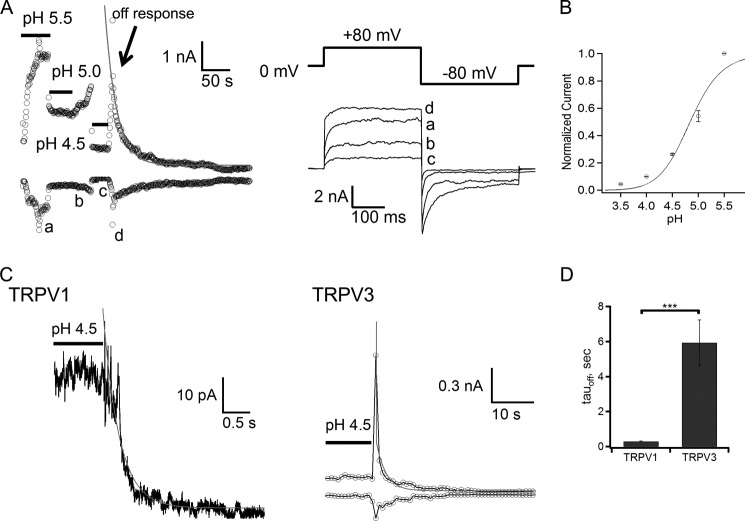
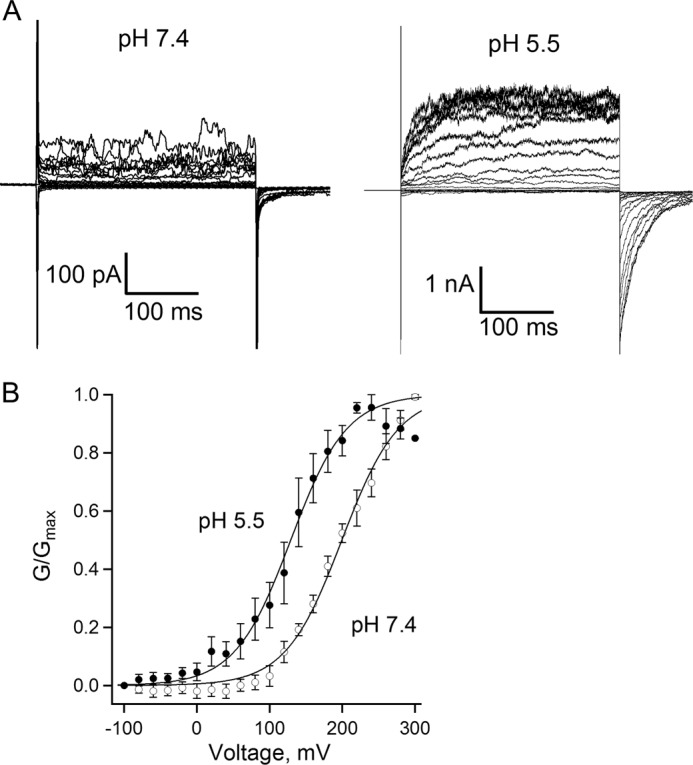
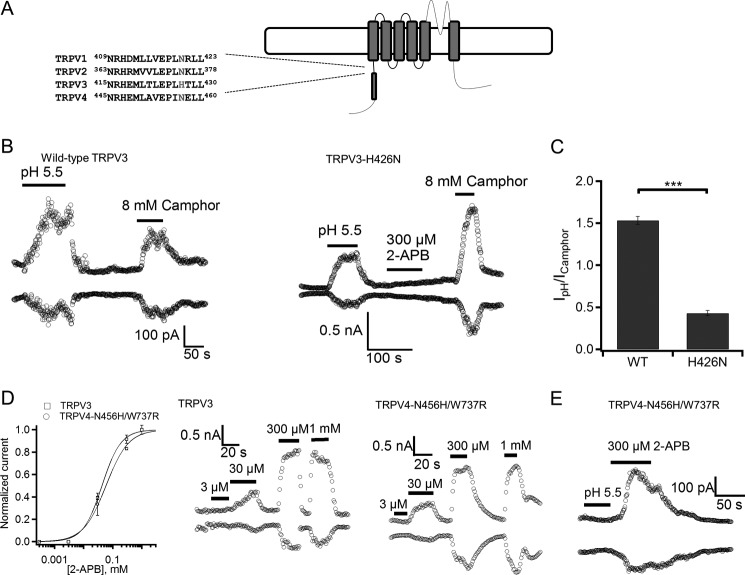
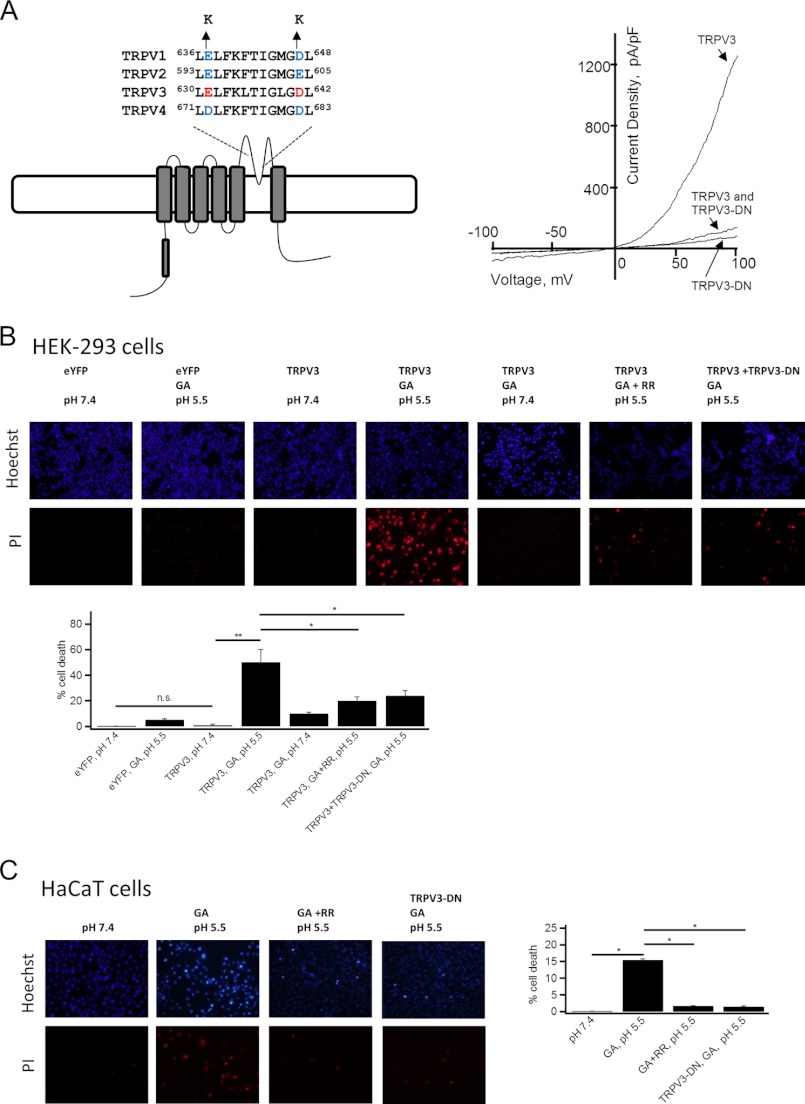
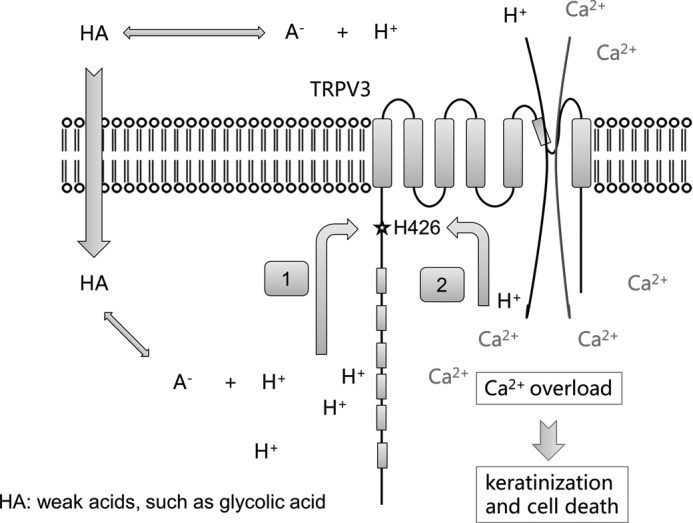
α-Hydroxyl acids (AHAs) from natural sources act as proton donors and topical compounds that penetrate skin and are well known in the cosmetic industry for their use in chemical peels and improvement of the skin. However, little is known about how AHAs cause exfoliation to expose fresh skin cells. Here we report that the transient receptor potential vanilloid 3 (TRPV3) channel in keratinocytes is potently activated by intracellular acidification induced by glycolic acid. Patch clamp recordings and cell death assay of both human keratinocyte HaCaT cells and TRPV3-expressing HEK-293 cells confirmed that intracellular acidification led to direct activation of TRPV3 and promoted cell death. Site-directed mutagenesis revealed that an N-terminal histidine residue, His-426, known to be involved in 2-aminoethyl diphenylborinate-mediated TRPV3 activation, is critical for sensing intracellular proton levels. Taken together, our findings suggest that intracellular protons can strongly activate TRPV3, and TRPV3-mediated proton sensing and cell death in keratinocytes may serve as a molecular basis for the cosmetic use of AHAs and their therapeutic potential in acidic pH-related skin disorders.


Figures

FIGURE 1.
FIGURE 1.
Glycolic acid-induced activation of TRPV3 in HaCaT and HEK-293 cells. A, representative whole cell recordings of HEK-293 cells expressing TRPV3 in the presence of 100 mm glycolic acid at pH 5.5 (left panel) or pH 7.4 and 300 μm 2-APB (right panel). B, left panel, representative whole cell TRPV3-like currents were evoked by 300 μm 2-APB and 100 mm glycolic acid at pH 5.5 in HaCaT cells; as a control, cells that had no response to 2-APB also had no response to glycolic acid (right panel). C, sequence alignment between the pore regions of TRPV1 and TRPV3. The Glu-601 pH site in TRPV1 and its corresponding Glu-610 in TRPV3 are highlighted in red. D, time course of whole cell TRPV3 currents evoked by a MES-buffered solution at pH 5.5 and subsequent application of 300 μm 2-APB. After washout of 2-APB, a slow developing current was evoked by the pH 5.5 solution (left panel). Comparison of current traces labeled a and b obtained at the time indicated showed the remaining channel activity of TRPV3 by 2-APB (right panel).
FIGURE 2.
FIGURE 2.
Intracellular proton activation of TRPV3 in a pH-dependent manner. A, representative current traces were recorded from an inside-out patch facing solutions of various pH levels (left panel). The current traces labeled as a to e were obtained at the time indicated (right panel). B, dose-response curve for proton activation of TRPV3. Baseline-subtracted currents were normalized to steady-state currents at pH 5.5. The smooth curve represents a fit of the Hill equation with pH½ = 6.1 ± 0.01, and Hill slope at 1.7 ± 0.5 (n = 5). C, inside-out patch recordings of single TRPV3 channel expressed in HEK293 cells in response to different pH values. D, a representative current trace recorded from an outside-out patch in response to a bath solution of pH 5.5 (left). The current traces labeled as a and b were obtained at the time indicated (right panel).
FIGURE 3.
FIGURE 3.
Protons are an efficient opener of the TRPV3 channel. A, representative single-channel currents recorded at the indicated intracellular pH levels from inside-out patches at +80 mV. B, box-and-whisker plot of the single-channel conductance versus the corresponding intracellular pH values, n = 5–6. The whisker top, box top, line inside the box, box bottom, and whisker bottom represent the maximum, 75th percentile, median, 25th percentile, and minimum value of each pool of conductance measurements, respectively. C, a representative current trace recorded from an inside-out patch evoked by pH 5.5 solution and 300 μm 2-APB in mTRPV3-expressing HEK-293 cells. D, average current (left bar) evoked by the pH 5.5 solution was normalized to the response evoked by 300 μm 2-APB. The right bar represents the same data after correction for proton-induced reduction in single-channel conductance, so that the height of the bar directly reflects the relative open probability, n = 4. E, a representative current trace recorded from an inside-out patch evoked by a pH 5.5 solution from a hTRPV3-expressing cell.
FIGURE 4.
FIGURE 4.
The off-response property of TRPV3. A, a representative current trace recorded from an inside-out patch facing solutions of various pH values (left panel). The current traces labeled as a–d were obtained at the time indicated (right panel). The off-response was obtained at pH 4.5. B, proton dose-response curve for proton inhibition of TRPV3. Baseline-subtracted currents were normalized to steady-state currents at pH 5.5. The Hill equation was used for curve fitting with pH½ = 4.84 ± 0.09, and Hill slope at 1.4 ± 0.3 (n = 8). C, single exponential fits for the off-response of TRPV1 (left panel) and TRPV3 (right panel). TRPV1 current was recorded from an outside-out patch evoked by pH 4.5 solution, and TRPV3 current was recorded from an inside-out patch evoked by pH 4.5 solution. D, comparison of off-response time constants of TRPV1 and TRPV3, p < 0.001, n = 6–8.
FIGURE 5.
FIGURE 5.
A leftward shift of voltage-dependent activation of TRPV3 by intracellular protons. A, representative currents recorded from inside-out patches at pH 7.4 or 5.5. Patches were held at 0 mV, steps from −100 to 300 mV in an increment of 20 mV for 300 ms, and then back to −100 for 100 ms. B, normalized steady-state conductance curves at pH 7.4 and 5.5, constructed from the tail currents. The V½ value, determined from fitting the data to a Boltzmann function, shifted about 70 mV, from +199.4 ± 1.8 mV at pH 7.4 (open circles) to +129.1 ± 2.1 mV at pH 5.5 (filled circles), n = 5 each.
FIGURE 6.
FIGURE 6.
TRPV3-H426N mutation affects proton activation. A, sequence alignment of the N-terminal MPR of mTRPV1, mTRPV2, mTRPV3, and mTRPV4. The amino acid histidine involved in 2-APB sensing is indicated in red. B, representative currents obtained from inside-out patches with HEK-293 cells expressing wild-type (WT) TRPV3 (left panel) or mutant TRPV3 H426N (right panel) evoked by pH 5.5 solution, 8 mm camphor, or 300 μm 2-APB. C, a comparison of the ratio between the current evoked by pH 5.5 solution and current evoked by 8 mm camphor from WT TRPV3 and the TRPV3-H426N mutant, p < 0.001, n = 3–4. D, concentration-response curve of the 2-APB activated response in WT TRPV3 and TRPV4-N456H/W737R mutant (left panel), n = 5. Representative whole cell currents obtained from HEK-293 cells expressing WT TRPV3 (middle panel) and the TRPV4-N456H/W737R mutant (right panel) evoked by various concentrations of 2-APB. E, a representative current trace recorded from an inside-out patch evoked by pH 5.5 solution and currents evoked by 300 μm 2-APB in HEK-293 cells expressing the TRPV4-N456H/W737R mutant.
FIGURE 7.
FIGURE 7.
Contribution of TRPV3 activation to glycolic acid-mediated cell death in HEK293 and HaCaT cells. A, sequence alignment of pore helix and selectivity filter for mTRPV1, mTRPV2, mTRPV3, and mTRPV4. The conserved negatively charged residues causing dominant-negative effects when substituted with lysine are indicated in red or blue (left panel). Typical normalized currents to cell membrane capacitance evoked by 300 μm 2-APB and measured by a voltage ramp from −100 to +100 mV in 100 ms from cells expressing wild-type TRPV3 and TRPV3-E631K/D641K (TRPV3-DN) mutant alone or co-expressing wild-type TRPV3 and TRPV3-DN mutant at 1:1 ratio (right panel). B, top panels show representative images of Hoechst staining (upper images) and PI labeling (lower images) of HEK-293 cells expressing eYFP, TRPV3 alone, or co-expressing TRPV3 and TRPV3-DN mutant at 1:1 ratio following he indicated interventions. The bottom panel shows a bar graph of statistical analysis, n = 3. C, representative images of Hoechst staining and PI labeling of HaCaT cells following the indicated interventions (left panels), and statistical analysis of cell death quantified by PI labeling over Hoechst staining cells in each corresponding group (left images), n = 4. Statistical significance is indicated as: *, p < 0.05; **, p < 0.01; n.s., no significant difference.
FIGURE 8.
FIGURE 8.
A model for functional activation of TRPV3 by AHAs. Weak acids such as glycolic acid can diffuse across the cell membrane in the protonated form, and then re-equilibrate to generate a free proton, causing intracellular acidification and activation of TRPV3 (pathway 1). Protons can also pass through activated TRPV3 or other proton-permeable channels to induce intracellular acidification and TRPV3 activation (pathway 2). TRPV3 activation mediates Ca2+ influx, leading to cytosolic Ca2+ overload, keratinization, and cell death.

References

    1. Vidt D. G., Bergfeld W. F. (1997) Cosmetic use of α-hydroxy acids. Cleveland Clin. J. Med. 64, 327–329 - PubMed
    1. Tung R. C., Bergfeld W. F., Vidimos A. T., Remzi B. K. (2000) α-Hydroxy acid-based cosmetic procedures. Guidelines for patient management. Am. J. Clin. Dermatol. 1, 81–88 - PubMed
    1. Clark C. P., 3rd (1996) α-Hydroxy acids in skin care. Clin. Plast. Surg. 23, 49–56 - PubMed
    1. Kurtzweil P. (1998) α-Hydroxy acids for skin care. FDA Consum. 32, 30–35 - PubMed
    1. Roenigk H. H., Jr. (1995) Treatment of the aging face. Dermatol. Clin. 13, 245–261 - PubMed

Publication types

MeSH terms