. 2012 Aug;10(8):1065-76.
doi: 10.1158/1541-7786.MCR-11-0387. Epub 2012 Jun 7.

GSK-3 promotes cell survival, growth, and PAX3 levels in human melanoma cells

Affiliations

GSK-3 promotes cell survival, growth, and PAX3 levels in human melanoma cells

Jennifer D Kubic et al. Mol Cancer Res. 2012 Aug.

Abstract

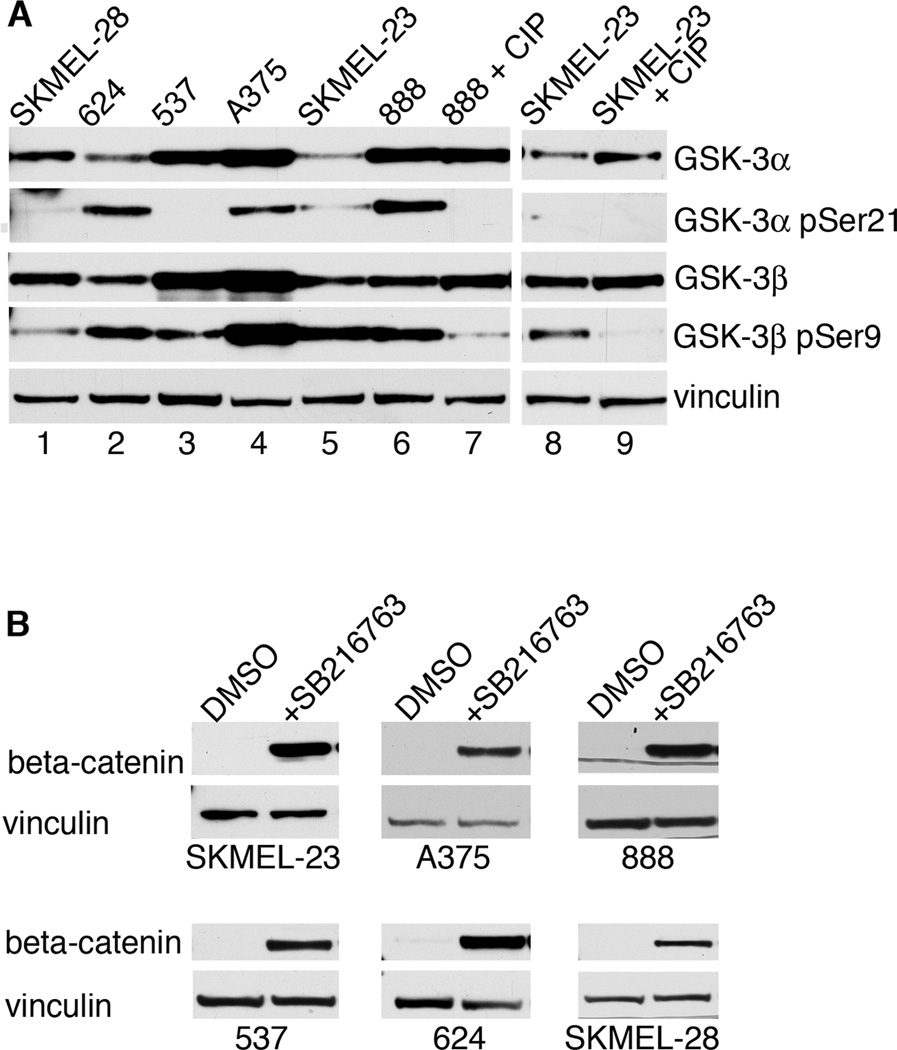
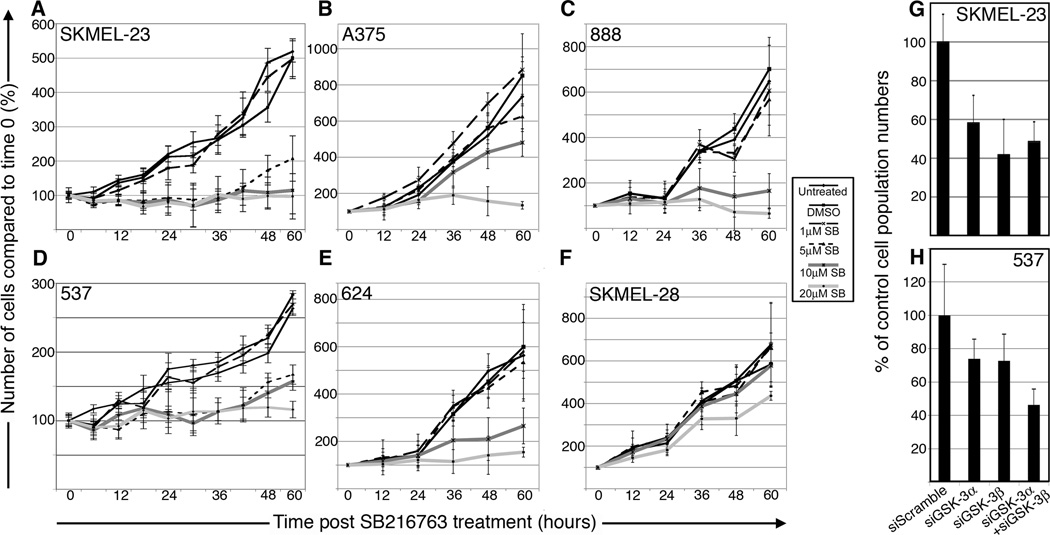
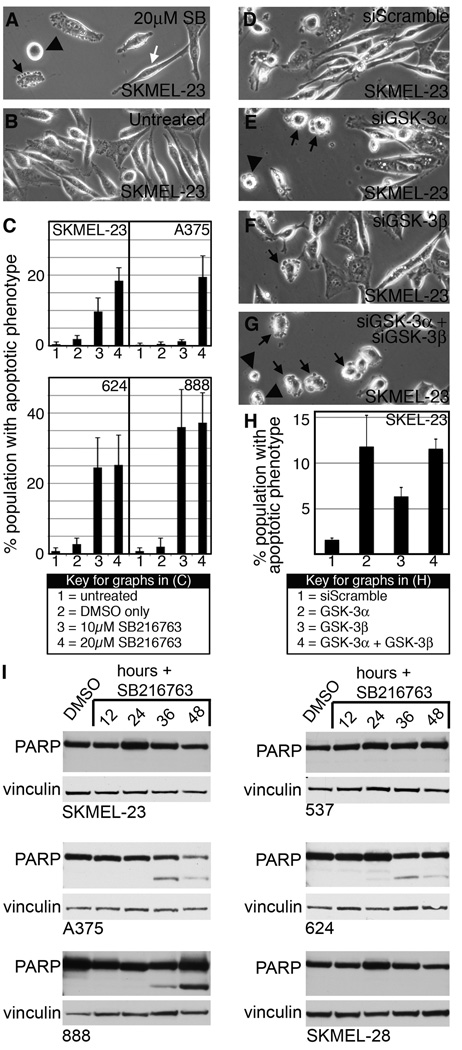
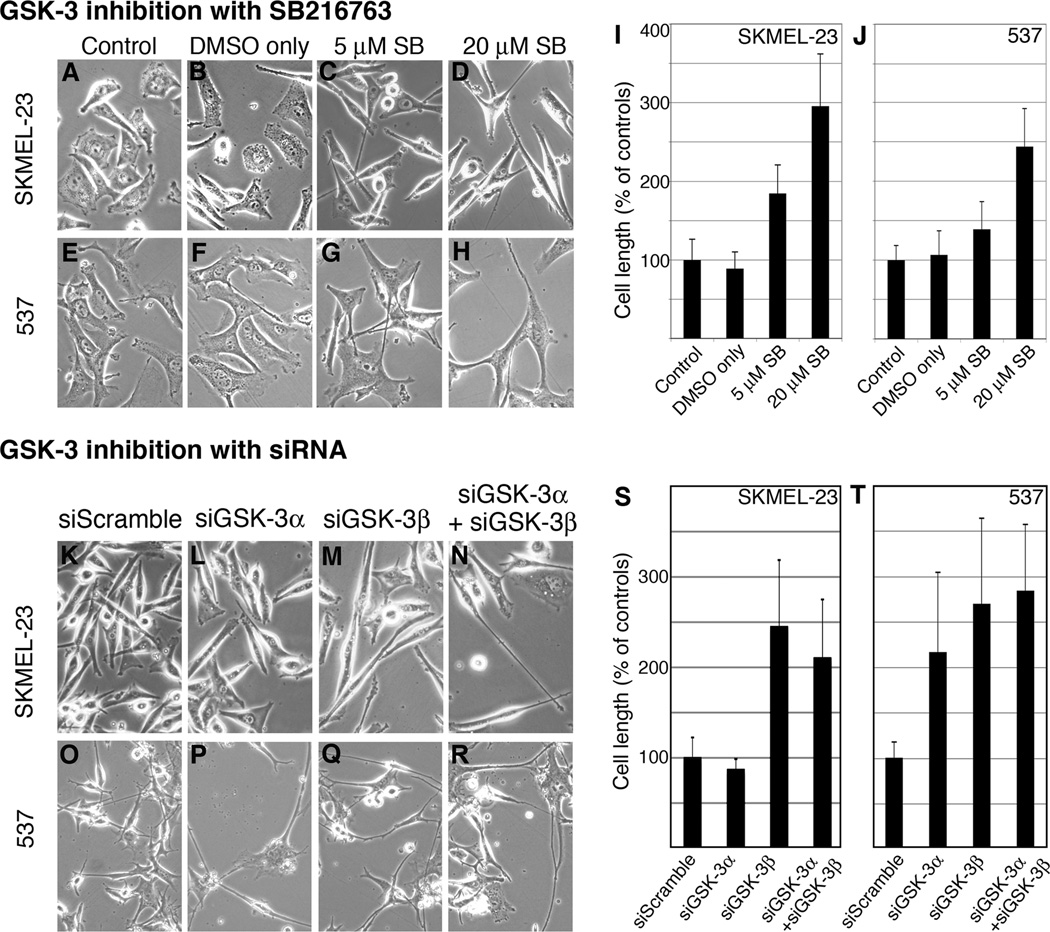
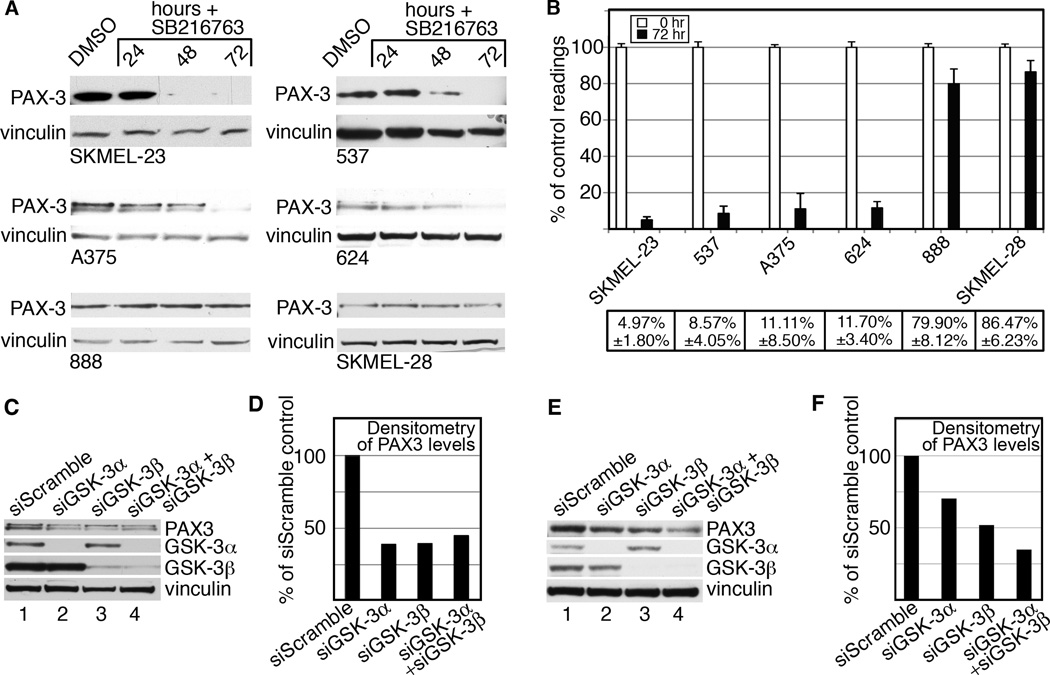
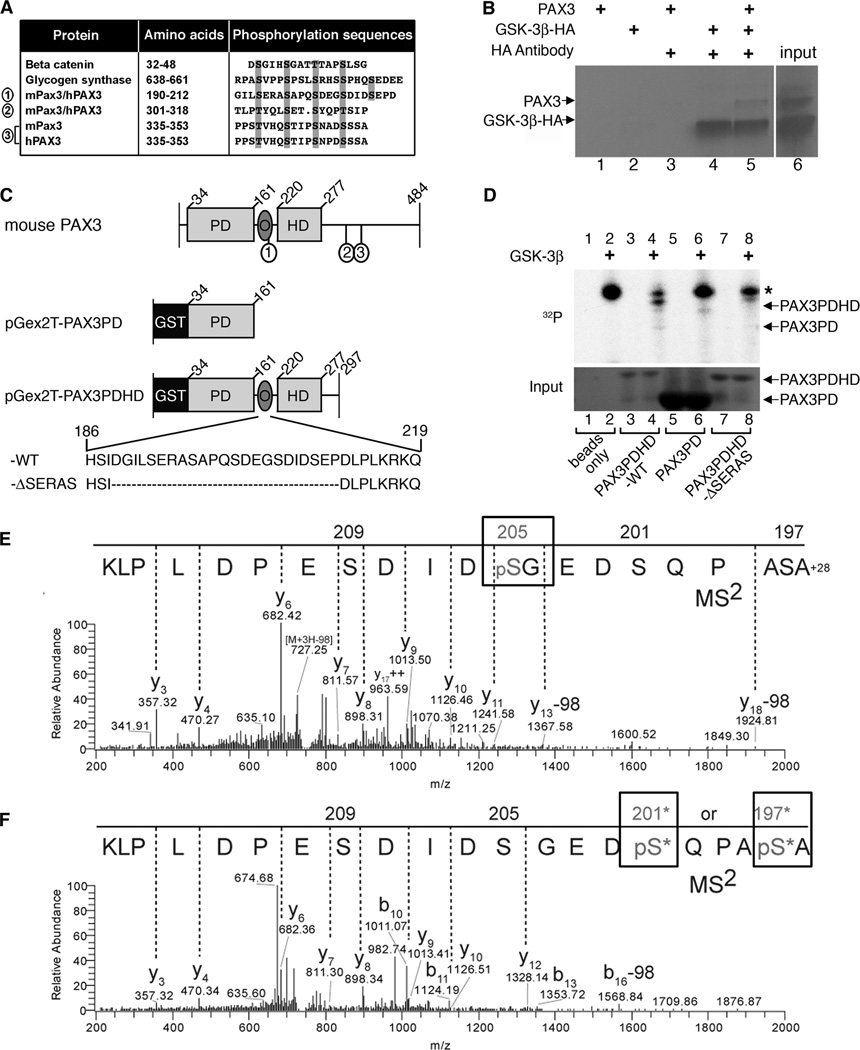
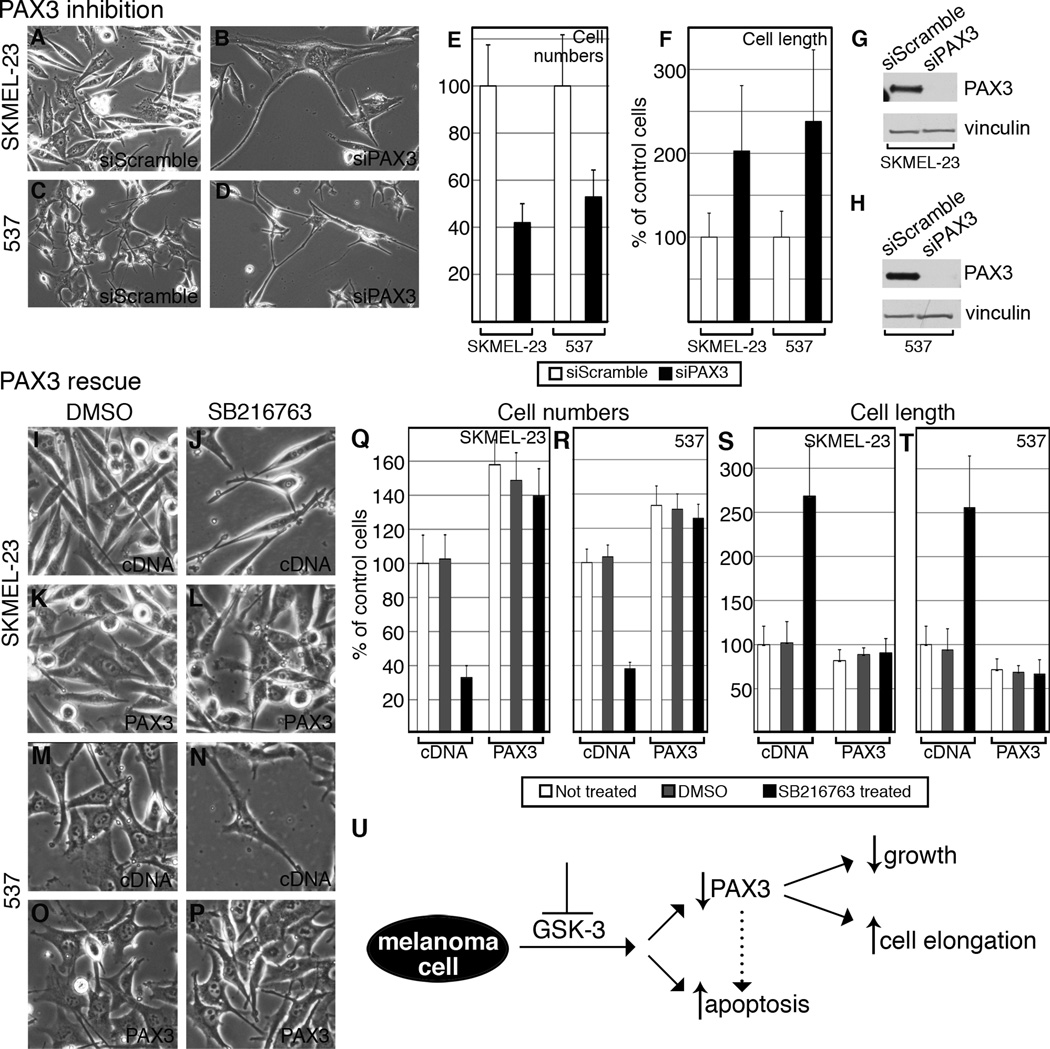
GSK-3 is a serine/threonine kinase involved in a diverse range of cellular processes. GSK-3 exists in two isoforms, GSK-3α and GSK-3β, which possess some functional redundancy but also play distinct roles depending on developmental and cellular context. In this article, we found that GSK-3 actively promoted cell growth and survival in melanoma cells, and blocking this activity with small-molecule inhibitor SB216763 or gene-specific siRNA decreased proliferation, increased apoptosis, and altered cellular morphology. These alterations coincided with loss of PAX3, a transcription factor implicated in proliferation, survival, and migration of developing melanoblasts. We further found that PAX3 directly interacted with and was phosphorylated in vitro on a number of residues by GSK-3β. In melanoma cells, direct inhibition of PAX3 lead to cellular changes that paralleled the response to GSK-3 inhibition. Maintenance of PAX3 expression protected melanoma cells from the anti-tumor effects of SB216763. These data support a model wherein GSK-3 regulates proliferation and morphology of melanoma through phosphorylation and increased levels of PAX3.


Conflict of interest statement

The authors declare no conflict of interest.

Figures

Figure 1
Figure 1
GSK-3 status in melanoma cell lines. A, melanoma cell lines express both GSK-3α and GSK-3β at varying levels of phosphorylation. Western blots of melanoma lysates were probed with antibodies recognizing total and phosphorylated GSK-3α and GSK-3β. Lysates from 888 and SKMEL-23 cells were treated with calf intestinal phosphatase (CIP) as controls for phospho-Ser9 and phospho-Ser21. B, GSK-3 inhibition raises β-catenin levels. Melanoma cell lines treated with DMSO or SB216763, for 24 hours were probed with β-catenin antibody or vinculin antibody as a loading control.
Figure 2
Figure 2
GSK-3 inhibition results in a dose-dependent cell number reduction. A–F, melanoma cell numbers over 60 hours of treatment. Cells were left untreated, carrier-treated (DMSO) or with increasing concentrations of SB216763. Cells were counted at commencement of treatment and at 12-hour intervals up to 60 hours. The number of cells at time 0 for each group was set as 100% and the cell counts for all treatment groups are expressed as a percentage of that start value. Values are means +/− s.d. G–H, GSK-3α and GSK-3β knockdown reduces cell numbers in SKMEL-23 (G) and 537 (H). Cells transfected with siGSK-3α, siGSK-3β, and both were counted 72 hours post-transfection and compared to siScramble (set at 100%). Values are means +/− s.d. (n=600).
Figure 3
Figure 3
GSK-3 inhibition induces apoptosis in melanoma cells. A–B, overall morphology of SKMEL-23 cells with (A) or without (B) SB216763 treatment at 9 hours. Cells displayed apoptotic phenotypes including blebbing (black arrow), rounding and adhesion loss (black arrowhead), as well as cells that maintain the parental phenotype (white arrow). C, quantification of apoptotic characteristics in melanoma cell lines upon GSK-3 inhibition. In six random fields, total cells and apoptotic cells were counted and graphed as a percentage of total population. Values are mean +/− s.d. (n=600 cells). D–G, SKMEL-23 cells transfected with siScramble (D), siGSK-3α (E), siGSK-3β (F), and both isoforms (G) were examined for apoptotic phenotypes 18 hours post-transfection. H, quantification of apoptotic phenotypes in D–G. Values are means +/− s.d. (n=900 cells) I, Western blots of melanoma cell lines treated with SB216763 for 12–48 hours compared to DMSO controls. Blots were probed with PARP antibody or vinculin antibody as a loading control.
Figure 4
Figure 4
GSK-3 inhibition with SB216763 or siRNA elongates dendritic processes. A–H, morphology of controls and SB216763-treated SKMEL-23 (A–D) and 537 (E–H) cells. Cells were either untreated (A, E), treated with DMSO (B, F) or with 5µM (C, G) or 20µM (D, H) SB216763 for 60 hours. I–J, quantification of SKMEL-23 and 537 cell length. For each group, 50 cells were measured length-wise and the averaged length of the control cells (A, E) was set at 100%. The presented graph is a compilation of two experiments. Values are means +/− s.d. (n=50). K-R, overall morphology of SKMEL-23 (K–N) and 537 (O–R) cells transfected with siScramble (K, O), siGSK-3α (L, P), siGSK-3β (M, Q), or both (N, R). Transfected cells exhibited dendritic process extension for both GSK-3 isoforms compared to the control at 72 hours. S–T, quantification of cell length of SKMEL-23 (S) and 537 (T). For each treatment, 10 cells were measured from 6 groups. The experimental groups were expressed as a percentage of the control group (average set at 100%). Values are means +/− s.d. (n=60 cells).
Figure 5
Figure 5
GSK-3 inhibition is correlated with a decrease in PAX3 levels. A, western blots of melanoma cell lines treated with SB216763. Cells were treated with DMSO or 20µM SB216763 for 24, 48 and 72 hours. Blots were probed with PAX3 antibody or vinculin antibody as a loading control. B, densitometry readings of western blots. The percentage shown represents the levels of PAX3 at 72 hours of treatment (black bars) compared to control (white bars). Values are means +/− s.d. (n=3 independent Western analyses). C–F, specific knockdown of GSK-3α and GSK-3β reduces PAX3 levels. PAX3 and GSK-3 protein levels were measured in whole-cell lysates from SKMEL-23 (C) and 537 (E) cells transfected with siGSK-3α, siGSK-3β, both, or siScramble. Blots were probed with PAX3, GSK-3α, GSK-3β, or vinculin antibodies. Densitometry of the PAX3 protein band intensity form SKMEL-23 (D) and 537 (F) are graphed with the siScramble control levels set at 100%.
Figure 6
Figure 6
GSK-3β interacts with and phosphorylates PAX3. A, PAX3 possesses three conserved putative GSK-3β triplicate recognition motifs (sites 1, 2, 3) which are aligned with known GSK-3β targets β-catenin and glycogen synthase. B, immunoprecipitation of GSK-3β and PAX3. Sepharose-A/G beads were mixed with radiolabeled PAX3 (lane-1), HA-GSK-3β (lane-2), PAX3 with HA antibody (lane-3), HA-GSK-3β with HA antibody (lane-4) and both PAX3 and HA-GSK-3β with HA antibody (lane-5). Input of radiolabeled PAX3 and HA-GSK-3β is shown in lane-6. C, schematic of recombinant GST-tagged murine PAX3 proteins. Full-length wild type mouse PAX3 depicts placement of the three putative GSK-3β recognition motifs (1, 2, 3) corresponding to sites in A. The pGex2T-PAX3PD construct fuses glutathione S-transferase (GST) to the N-terminal end of the paired domain (PD) and contains amino acids 34–161. pGex2T-PAX3PDHD-WT possesses amino acids 34–297 including the PD, octapeptide (O) and the homeodomain (HD). The amino acid sequence of O and the first GSK-3β recognition motif (S/T-X3-S/T) is represented (wild-type (WT) sequence shown, amino acids 186–219). The construct pGex2T-PAX3PDHD-ΔSERAS has the entire series of GSK-3β recognition motifs removed (deleted sequence, (−ΔSERAS) sequence shown, with the removal of amino acids 189–211). D, GSK-3β and PAX3 kinase assay. The kinase assay was performed on empty glutathione sepharose-4B beads without (lane-1) or with GSK-3β (lane-2), pGex2T-PAX3PDHD-WT without (lane-3) or with GSK-3β (lane-4), pGex2T-PAX3PD without (lane-5) or with GSK-3β (lane-6) and pGex2T-PAX3PDHD-ΔSERAS minus (lane-7) or plus GSK-3β (lane-8). The top panel displays the kinase assay with an asterisk indicating an auto-phosphorylation band. The bottom panel is a coomassie-stained gel visualizing the input bound to the beads. E–F, tandem mass spectrometry determines Ser205 and Ser197/Ser201 of PAX3 are phosphorylated by GSK-3β in-vitro. Precursor ion masses were measured in the Orbitrap analyzer and MS2 spectra were acquired in the LTQ mass spectrometer. E, MS2 spectra of pSer205 (n-formyl) ASAPQSDEGpSDIDSEPDLPLK (MS mass deviation, 12 ppm). F, MS2 spectra of peptide AS*APQS*DEGSDIDSEPDLPLK phosphorylated at either Ser197 or Ser201 (MS mass deviation, 23 ppm). The presence of ion Y12 at mass 1328.14m/z in the Y-ion series fragmentation of the MS2 spectra exclude Ser209 and Ser205 at the phosphorylation site, however, there is insufficient MS2 ion evidence (b1–9) to pinpoint the phosphorylation site specifically to Ser197 or Ser201, thus both sites with an * are potential sites of phosphorylation. Note: peptide is displayed C- to N-terminus due to the predominant Y-ion fragmentation.
Figure 7
Figure 7
PAX3 knockdown replicates cell phenotypes of GSK-3 inhibition (A–H) and PAX3 over-expression rescues these phenotypes (I–T). A–D, overall morphology of SKMEL-23 (A–B) and 537 (C–D) transfected with siScramble or siPAX3. Cells transfected with siPAX3 exhibited cell number reduction compared to siScramble at 72 hours. E, quantification of cell number reduction with siPAX3. Cells transfected with siPAX3 were counted 72 hours post-transfection and compared to siScramble (set at 100%). Values are means +/− s.d. (n=600 cells). F, quantification of cell length upon transfection with siScramble or siPAX3. 10 cells were measured from 6 groups. The siScramble was expressed as a percentage of the control group (average set at 100%). Values are means +/− s.d. (n=60 cells). G–H, siPAX3 reduces PAX3 levels in total cell lysate of SKMEL-23 (G) and 537 (H) compared to siScramble. Blots were probed with PAX3 antibody and vinculin as a loading control. I–P, SKMEL-23 (I–L) and 537 (M–P) cells were transfected with pcDNA3 (I–J, M–N) or pcDNA3-PAX3-HA (K–L, O–P) and treated with DMSO (I,K,M,O) or SB216763 (J,L,N,P) for 72 hours and observed for cell population and overall morphology. Q–R, quantification of cell numbers in I–P. SKMEL-23 and 537 cells transfected with either pcDNA3 or pcDNA3-PAX3-HA were left untreated, treated with DMSO, or with SB216763 for 72 hours and counted and compared to the non-treated control (set at 100%). Values are means +/− s.d. (n=600). S–T, quantification of cell length from I–P. For each treatment, 10 cells were measured from 6 groups. The DMSO- and SB216763-treated groups were expressed as a percentage of the untreated cells (average set at 100%). Values are means +/− s.d. (n=60). U, summary schematic of the response of melanoma cells to GSK-3 inhibition. A loss of GSK-3 activity resulted in an overall reduction of PAX3 levels, a decrease in cell growth and survival, and cellular morphology changes in some but not all of the cell lines tested. While the effects on cell growth and elongation are linked to a loss of PAX3 in this study, this correlation could not be established between PAX3 loss and apoptotic induction. PAX3-dependent apoptosis has been reported in melanoma cells, however, and is indicated with a dotted arrow (20, 24).

Similar articles

Cited by

References

    1. Doble BW, Woodgett JR. GSK-3: tricks of the trade for a multi-tasking kinase. J Cell Sci. 2003;116:1175–1186. - PMC - PubMed
    1. Woodgett JR. Molecular cloning and expression of glycogen synthase kinase-3/factor A. EMBO J. 1990;9:2431–2438. - PMC - PubMed
    1. Yao HB, Shaw PC, Wong CC, Wan DC. Expression of glycogen synthase kinase-3 isoforms in mouse tissues and their transcription in the brain. J Chem Neuroanat. 2002;23:291–297. - PubMed
    1. Lau KF, Miller CC, Anderton BH, Shaw PC. Expression analysis of glycogen synthase kinase-3 in human tissues. J Pept Res. 1999;54:85–91. - PubMed
    1. Sutherland C, Leighton IA, Cohen P. Inactivation of glycogen synthase kinase-3 beta by phosphorylation: new kinase connections in insulin and growth-factor signalling. Biochem J. 1993;296(Pt 1):15–19. - PMC - PubMed

Publication types

MeSH terms