. 2012 Jun 19;109(25):9869-74.
doi: 10.1073/pnas.1120218109. Epub 2012 Jun 7.

Chemotactic adaptation kinetics of individual Escherichia coli cells

Affiliations

Chemotactic adaptation kinetics of individual Escherichia coli cells

Taejin L Min et al. Proc Natl Acad Sci U S A. .

Abstract

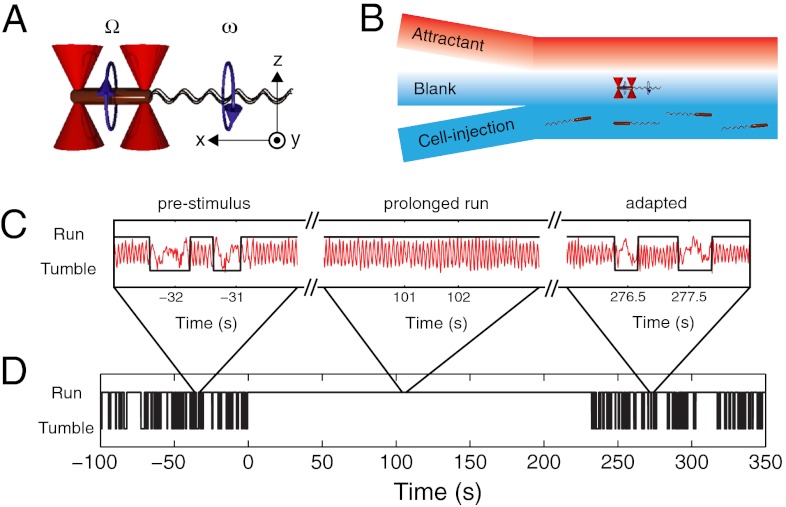
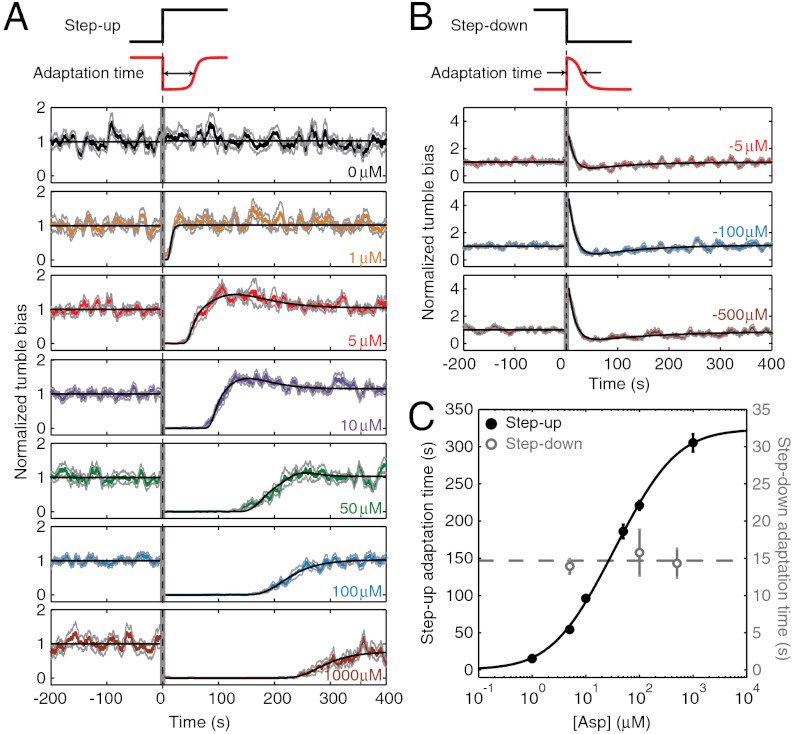
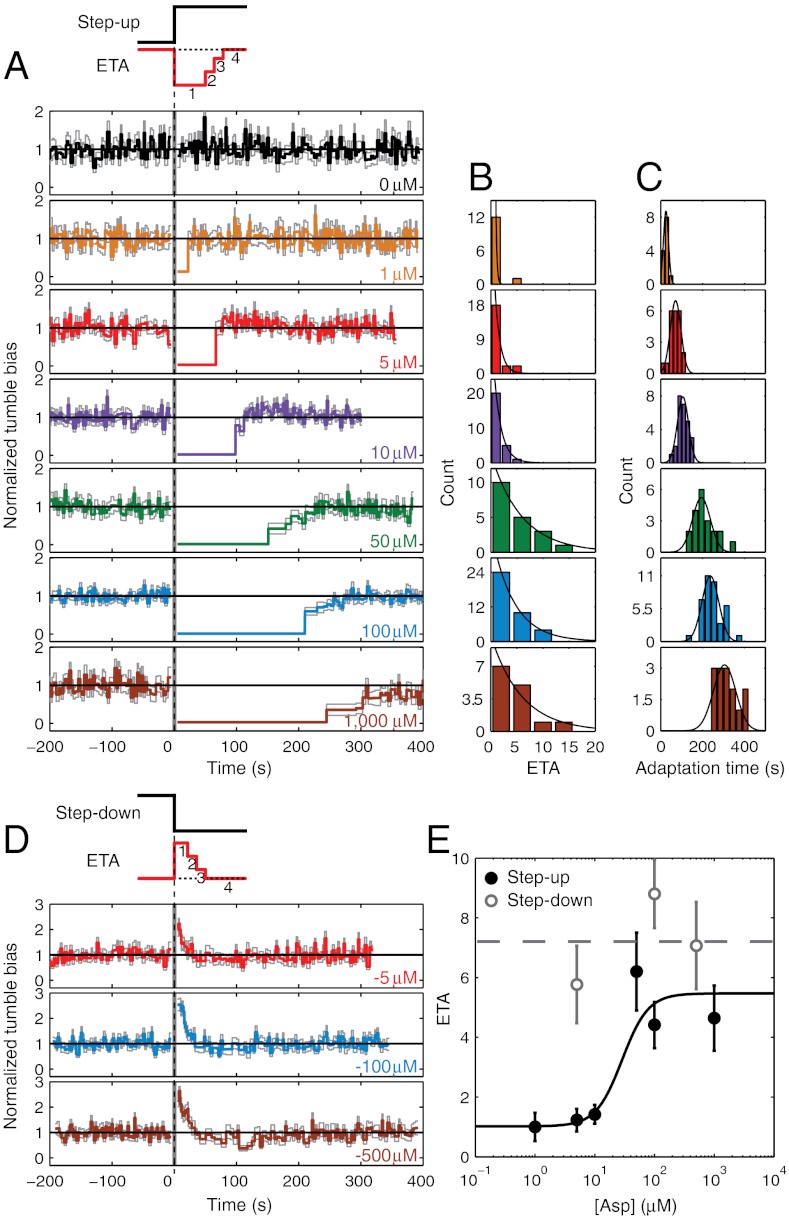
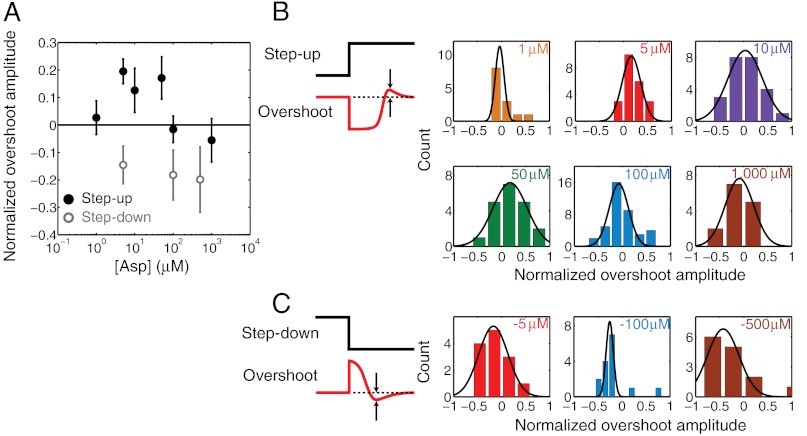
Escherichia coli chemotaxis serves as a paradigm for the way living cells respond and adapt to changes in their environment. The chemotactic response has been characterized at the level of individual flagellar motors and in populations of swimming cells. However, it has not been previously possible to quantify accurately the adaptive response of a single, multiflagellated cell. Here, we use our recently developed optical trapping technique to characterize the swimming behavior of individual bacteria as they respond to sudden changes in the chemical environment. We follow the adaptation kinetics of E. coli to varying magnitudes of step-up and step-down changes in concentration of chemoattractant. We quantify two features of adaptation and how they vary with stimulus strength: abruptness (the degree to which return to prestimulus behavior occurs within a small number of run/tumble events) and overshoot (the degree of excessive response before the return to prestimulus behavior). We also characterize the asymmetry between step-up and step-down responses, observed at the single-cell level. Our findings provide clues to an improved understanding of chemotactic adaptation.


Conflict of interest statement

The authors declare no conflict of interest.

Figures

Fig. 1.
Fig. 1.
Measuring the chemotactic response of individual bacteria. (A) Schematic representation of an E. coli bacterium (brown cylinder) held by two optical traps (red cones). The cell body counter-rotates (Ω) in a direction opposite to the flagellar bundle’s rotation (ω). Experimental coordinates are also shown. (B) Schematic of the laminar-flow chamber used to establish chemical gradients. To apply a chemical stimulus, the trapped bacterium is moved perpendicularly to the flow direction, in or out of the channel containing chemoattractant. (C) Representative cell-body rotation signals from a trapped cell before stimulus (Left), during adaptation (Middle), and after adaptation is complete (Right). Runs and tumbles (black line) are distinguished by using an automated routine. (D) A long-term run/tumble binary time trace obtained from the same cell. Stimulus was applied at t = 0. For experimental details see SI Materials and Methods.
Fig. 2.
Fig. 2.
Population-averaged response to step-up and step-down stimuli. (A) The population-averaged response to a step up in attractant concentration, delivered at t = 0. Individual tumble bias traces were normalized by the mean prestimulus tumble bias before averaging across the population. Solid colored lines designate the averaged response at different stimulus levels [changing from 0 μM to 0 (control), 1, 5, 10, 50, 100, and 1,000 μM of l-aspartate, color coded in black, orange, red, purple, green, blue, and brown, respectively). Light gray lines denote one standard error above and below the mean. Black lines describe fit to a theoretical model of the chemotaxis network, with an added overshoot feature. The vertical gray band near t = 0 corresponds to the time when cells were moved along the chemical gradient and data was not recorded. The number of different cells (each cell was stimulated only once) included at each stimulus level: n = 10, 13, 22, 26, 20, 39, and 14, from top to bottom. (B) Same as A, for step-down stimuli (changing from 5, 100, and 500 μM to 0 μM of l-aspartate, color coded in red, blue, and brown, respectively). In this case, the theoretical fit (black lines) after stimulus is the sum of two exponentials. The number of different cells (each cell was stimulated only once) included at each stimulus level: n = 13, 15, and 14, from top to bottom. (C) The average adaptation time as a function of stimulus strength. Adaptation time in step-up experiments (solid black circles) was the time at which the model fit recovered to half the pre-stimulus tumble bias. Error bars are standard errors obtained from bootstrapping. The solid black line is a fit to a receptor free-energy model (27). The dashed gray line is the mean of the three step-down data points (open gray circles). See SI Materials and Methods for more details of data analysis and modeling.
Fig. 3.
Fig. 3.
Abruptness of adaptation to step-up and step-down stimuli. (A) The event-based average response to a step up in attractant concentration, delivered at t = 0. Individual tumble-bias traces were normalized by the mean prestimulus tumble bias. Color notations as in Fig. 2. The vertical gray band near t = 0 corresponds to the time when cells were moved along the chemical gradient and data was not recorded. The same raw data as in Fig. 2A were used in this analysis. (B) Histograms of the number of run/tumble pair ETA from individual cells. Black line is a fit to an exponential. (C) Histograms of adaptation time from individual cells. Black line is a fit to a Gaussian. (D) Same as A, for a step-down stimulus. The same raw data as in Fig. 2B were used in this analysis. (E) The average number of ETA as a function of stimulus strength for step up (black solid circles, values obtained from C) and step down (open gray circles). Error bars designate standard error of the mean. The solid black line is a fit to a sigmoidal function. The dashed gray line is the mean of the three step-down data points. See SI Materials and Methods for details of the event-based analysis.
Fig. 4.
Fig. 4.
Overshoot response to step-up and step-down stimuli. (A) The overshoot amplitude, normalized by the steady-state tumble bias and averaged over individual cells, is plotted as a function of the step up (solid black circles) and step down (gray open circles) stimulus. Error bars designate standard error of the mean. (B) Histograms of single-cell overshoot amplitudes in response to varying magnitudes of step-up stimuli. (C) Same as B, for step-down stimuli. Black lines are fits to a Gaussian. Color notations and sample sizes at each stimulus level are the same as in Fig. 3. See SI Materials and Methods for details of the overshoot calculation.

References

    1. Berg HC. The rotary motor of bacterial flagella. Annu Rev Biochem. 2003;72:19–54. - PubMed
    1. Silverman M, Simon M. Flagellar rotation and the mechanism of bacterial motility. Nature. 1974;249:73–74. - PubMed
    1. Turner L, Ryu WS, Berg HC. Real-time imaging of fluorescent flagellar filaments. J Bacteriol. 2000;182:2793–2801. - PMC - PubMed
    1. Darnton NC, Turner L, Rojevsky S, Berg HC. On torque and tumbling in swimming Escherichia coli. J Bacteriol. 2007;189:1756–1764. - PMC - PubMed
    1. Berg HC, Brown DA. Chemotaxis in Escherichia coli analyzed by 3-dimensional tracking. Nature. 1972;239:500–504. - PubMed

Publication types

LinkOut - more resources