Visualization of genomic changes by segmented smoothing using an L0 penalty
- PMID: 22679492
- PMCID: PMC3367998
- DOI: 10.1371/journal.pone.0038230
Visualization of genomic changes by segmented smoothing using an L0 penalty
Abstract
Copy number variations (CNV) and allelic imbalance in tumor tissue can show strong segmentation. Their graphical presentation can be enhanced by appropriate smoothing. Existing signal and scatterplot smoothers do not respect segmentation well. We present novel algorithms that use a penalty on the L(0) norm of differences of neighboring values. Visualization is our main goal, but we compare classification performance to that of VEGA.
Conflict of interest statement
Figures

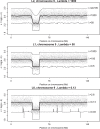
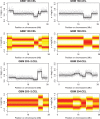
 norm, the Whittaker smoother. Middle panel:
  norm. Bottom panel:
  norm. Thinner lines drawn with positive and negative offsets illustrate the effect non-optimal
  . Top line:
  too large. Bottom line:
  too small.
 is indicated in the top panel by the vertical broken line. The bottom panel shows data using (double) the selected
  against the raw data. The doubling is needed to compensate for leaving out half of the data.
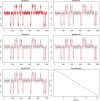
 .
.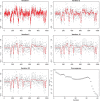
 .
.

 (double the value indicated by cross-validation, to correct for leaving out half of the data).
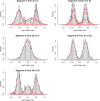
 ) are 0.01 for position and 0.5 for log allelic ratio.
Similar articles
-
Family-Based Benchmarking of Copy Number Variation Detection Software.PLoS One. 2015 Jul 21;10(7):e0133465. doi: 10.1371/journal.pone.0133465. eCollection 2015. PLoS One. 2015. PMID: 26197066 Free PMC article.
-
iCopyDAV: Integrated platform for copy number variations-Detection, annotation and visualization.PLoS One. 2018 Apr 5;13(4):e0195334. doi: 10.1371/journal.pone.0195334. eCollection 2018. PLoS One. 2018. PMID: 29621297 Free PMC article.
-
VEGA: variational segmentation for copy number detection.Bioinformatics. 2010 Dec 15;26(24):3020-7. doi: 10.1093/bioinformatics/btq586. Epub 2010 Oct 19. Bioinformatics. 2010. PMID: 20959380
-
Current analysis platforms and methods for detecting copy number variation.Physiol Genomics. 2013 Jan 7;45(1):1-16. doi: 10.1152/physiolgenomics.00082.2012. Epub 2012 Nov 6. Physiol Genomics. 2013. PMID: 23132758 Free PMC article. Review.
-
Clinical interpretation of copy number variants in the human genome.J Appl Genet. 2017 Nov;58(4):449-457. doi: 10.1007/s13353-017-0407-4. Epub 2017 Sep 30. J Appl Genet. 2017. PMID: 28963714 Free PMC article. Review.
Cited by
-
Regression modelling of interval censored data based on the adaptive ridge procedure.J Appl Stat. 2021 Jun 23;49(13):3319-3343. doi: 10.1080/02664763.2021.1944996. eCollection 2022. J Appl Stat. 2021. PMID: 36213774 Free PMC article.
-
An Adaptive Ridge Procedure for L0 Regularization.PLoS One. 2016 Feb 5;11(2):e0148620. doi: 10.1371/journal.pone.0148620. eCollection 2016. PLoS One. 2016. PMID: 26849123 Free PMC article.
-
Application of quantile regression to recent genetic and -omic studies.Hum Genet. 2014 Aug;133(8):951-66. doi: 10.1007/s00439-014-1440-6. Epub 2014 Apr 26. Hum Genet. 2014. PMID: 24770874 Review.
-
Sparse relative risk regression models.Biostatistics. 2020 Apr 1;21(2):e131-e147. doi: 10.1093/biostatistics/kxy060. Biostatistics. 2020. PMID: 30380025 Free PMC article.
-
Right-Censored Time Series Modeling by Modified Semi-Parametric A-Spline Estimator.Entropy (Basel). 2021 Nov 27;23(12):1586. doi: 10.3390/e23121586. Entropy (Basel). 2021. PMID: 34945891 Free PMC article.
References
MeSH terms
LinkOut - more resources
Full Text Sources

