

Modelling noninvasively measured cerebral signals during a hypoxemia challenge: steps towards individualised modelling
- PMID: 22679497
- PMCID: PMC3367969
- DOI: 10.1371/journal.pone.0038297
Modelling noninvasively measured cerebral signals during a hypoxemia challenge: steps towards individualised modelling
Abstract
Noninvasive approaches to measuring cerebral circulation and metabolism are crucial to furthering our understanding of brain function. These approaches also have considerable potential for clinical use "at the bedside". However, a highly nontrivial task and precondition if such methods are to be used routinely is the robust physiological interpretation of the data. In this paper, we explore the ability of a previously developed model of brain circulation and metabolism to explain and predict quantitatively the responses of physiological signals. The five signals all noninvasively-measured during hypoxemia in healthy volunteers include four signals measured using near-infrared spectroscopy along with middle cerebral artery blood flow measured using transcranial Doppler flowmetry. We show that optimising the model using partial data from an individual can increase its predictive power thus aiding the interpretation of NIRS signals in individuals. At the same time such optimisation can also help refine model parametrisation and provide confidence intervals on model parameters. Discrepancies between model and data which persist despite model optimisation are used to flag up important questions concerning the underlying physiology, and the reliability and physiological meaning of the signals.
Conflict of interest statement
Figures
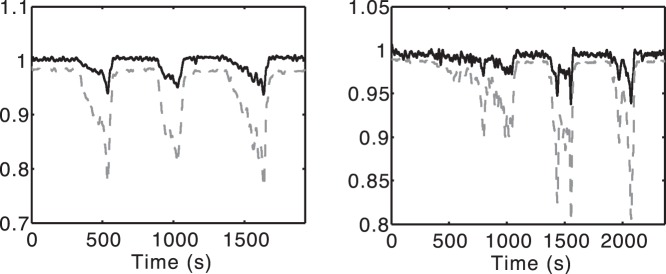
 (%, top panel), mean ABP (mmHg, middle panel) and
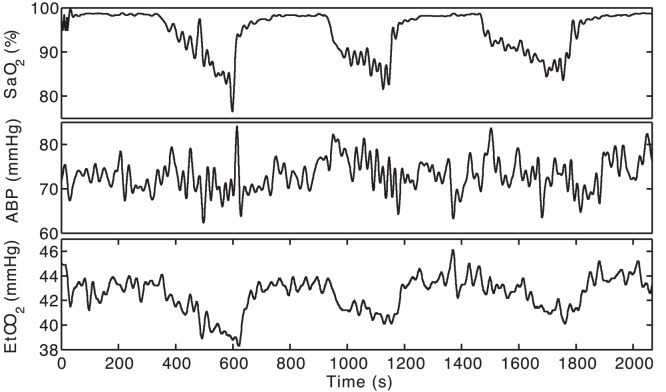
  (mmHg, bottom panel) for a typical subject (Subject 6) following the resampling and filtering described in the text. Each experiment lasted 30–40 minutes in total.
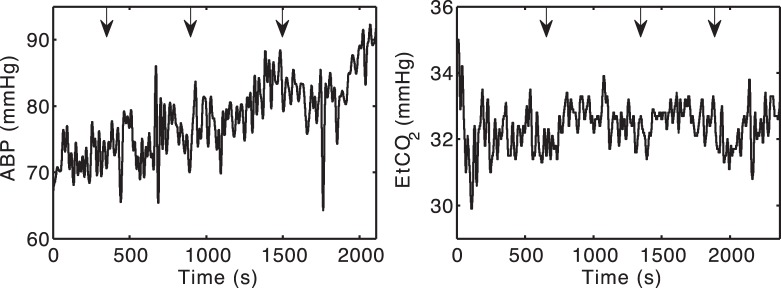
 tension for Subject 5 was maintained relatively constant across the hypoxemic challenges.
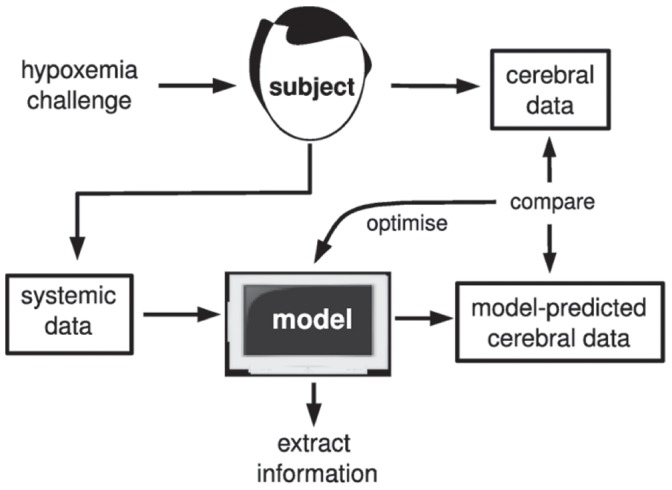
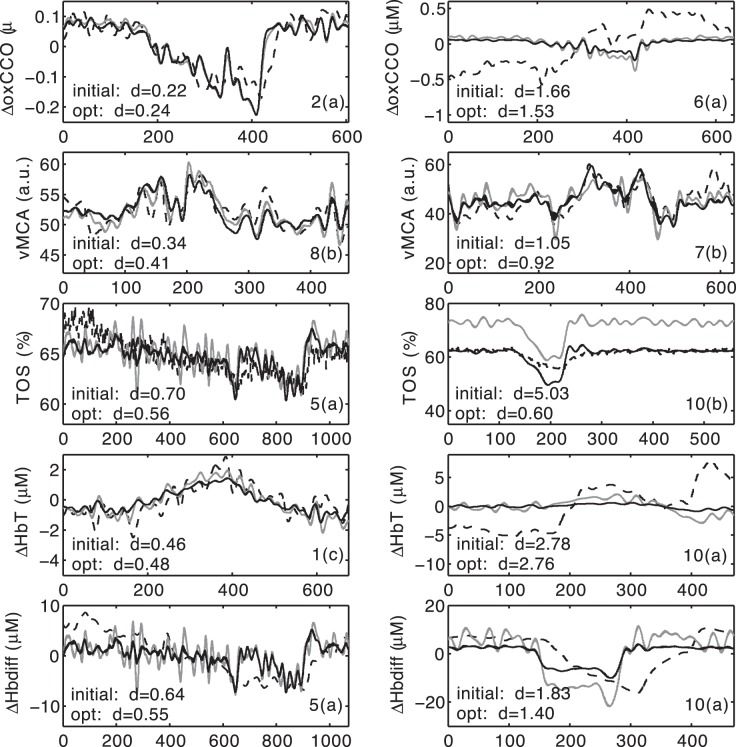
 are on the bottom left of each plot, while the subject and challenge are on the bottom right (e.g., “2(a)” means “Subject 2, first challenge”).
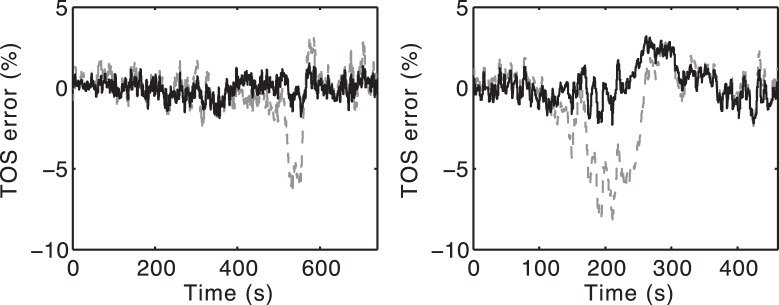
 as a ratio, while the bold line is
  normalised to its initial value. Left. Subject 1. This is a fairly typical trace. Right. Subject 5. Both
  and
and  are more variable, but again the model predicts that
  changes follow the trends in
  .
.Similar articles
-
Comparison of Transcranial Doppler and Ultrasound-Tagged Near Infrared Spectroscopy for Measuring Relative Changes in Cerebral Blood Flow in Human Subjects.Anesth Analg. 2018 Feb;126(2):579-587. doi: 10.1213/ANE.0000000000002590. Anesth Analg. 2018. PMID: 29189269
-
Validation of Near-Infrared Spectroscopy for Monitoring Cerebral Autoregulation in Comatose Patients.Neurocrit Care. 2017 Dec;27(3):362-369. doi: 10.1007/s12028-017-0421-8. Neurocrit Care. 2017. PMID: 28664392 Free PMC article.
-
Influence of skin blood flow on near-infrared spectroscopy signals measured on the forehead during a verbal fluency task.Neuroimage. 2011 Aug 1;57(3):991-1002. doi: 10.1016/j.neuroimage.2011.05.012. Epub 2011 May 10. Neuroimage. 2011. PMID: 21600294
-
Laser-Doppler flowmetry. A review of its application for measuring cerebral and spinal cord blood flow.Mol Chem Neuropathol. 1990 Jan;12(1):55-70. doi: 10.1007/BF03160057. Mol Chem Neuropathol. 1990. PMID: 2278606 Review.
-
Measuring cerebrovascular autoregulation in preterm infants using near-infrared spectroscopy: an overview of the literature.Expert Rev Neurother. 2017 Aug;17(8):801-818. doi: 10.1080/14737175.2017.1346472. Epub 2017 Jun 29. Expert Rev Neurother. 2017. PMID: 28639837 Review.
Cited by
-
Modelling Blood Flow and Metabolism in the Preclinical Neonatal Brain during and Following Hypoxic-Ischaemia.PLoS One. 2015 Oct 7;10(10):e0140171. doi: 10.1371/journal.pone.0140171. eCollection 2015. PLoS One. 2015. PMID: 26445281 Free PMC article.
-
BrainSignals Revisited: Simplifying a Computational Model of Cerebral Physiology.PLoS One. 2015 May 11;10(5):e0126695. doi: 10.1371/journal.pone.0126695. eCollection 2015. PLoS One. 2015. PMID: 25961297 Free PMC article.
-
The influence of carbon dioxide on cerebral metabolism and oxygen consumption: combining multimodal monitoring with dynamic systems modelling.Biol Open. 2024 Jan 15;13(1):bio060087. doi: 10.1242/bio.060087. Epub 2024 Jan 5. Biol Open. 2024. PMID: 38180242 Free PMC article.
References
-
- Obrig H, Villringer A. Beyond the visible - imaging the human brain with light. J Cereb Blood Flow Metab. 2003;23:1–18. - PubMed
-
- Smith M. Shedding light on the adult brain: a review of clinical applications of near-infrared spectroscopy. Phil Trans R Soc A. 2011;369:4452–4469. - PubMed
-
- Kakihana Y, Matsunaga A, Yasuda T, Imabayashi T, Kanmura Y, et al. Brain oxymetry in the operating room: current status and future directions with particular regard to cytochrome oxidase. J Biomed Opt. 2008;13:033001. - PubMed
-
- Tachtsidis I, Tisdall MM, Leung TS, Pritchard C, Cooper CE, et al. Relationship between brain tissue haemodynamics, oxygenation and metabolism in the healthy human adult brain during hyperoxia and hypercapnea. Adv Exp Med Biol. 2009;645:315–320. - PubMed
-
- Tisdall MM, Tachtsidis I, Leung TS, Elwell CE, Smith M. Increase in cerebral aerobic metabolism by normobaric hyperoxia after traumatic brain injury. J Neurosurg. 2008;109:424–432. - PubMed
Publication types
MeSH terms
Grants and funding
LinkOut - more resources
Full Text Sources
