. 2012;7(6):e38408.
doi: 10.1371/journal.pone.0038408. Epub 2012 Jun 5.

Heterogeneity of multifunctional IL-17A producing S. Typhi-specific CD8+ T cells in volunteers following Ty21a typhoid immunization

Affiliations

Heterogeneity of multifunctional IL-17A producing S. Typhi-specific CD8+ T cells in volunteers following Ty21a typhoid immunization

Monica A McArthur et al. PLoS One. 2012.

Abstract

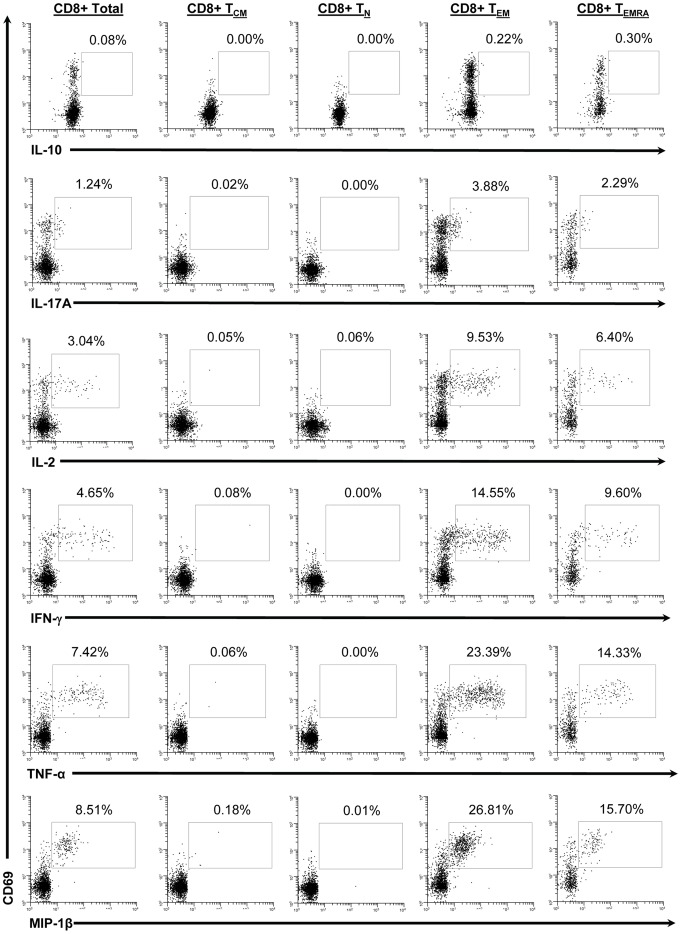
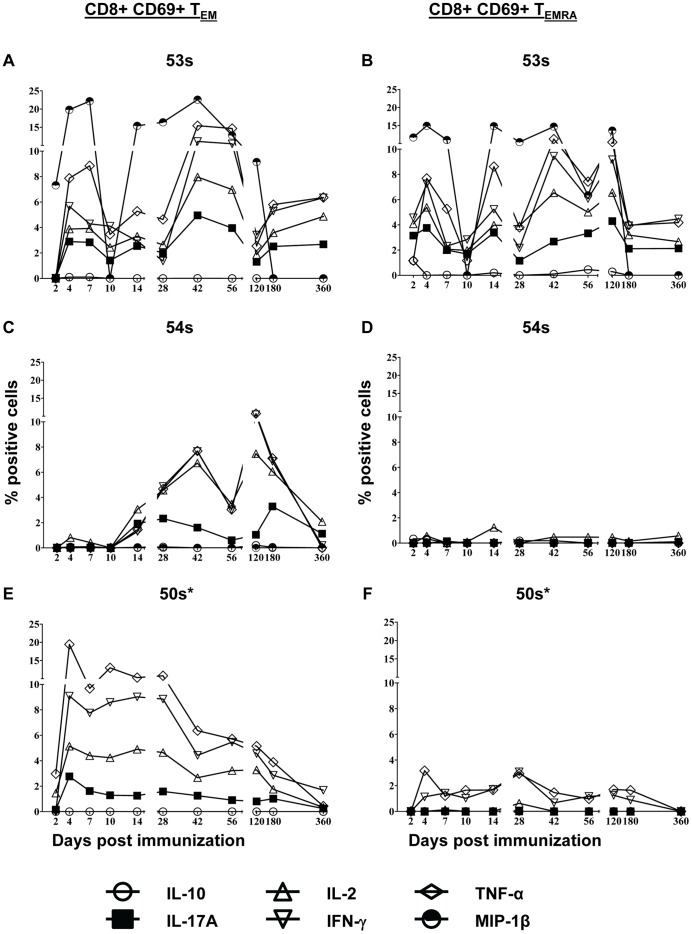
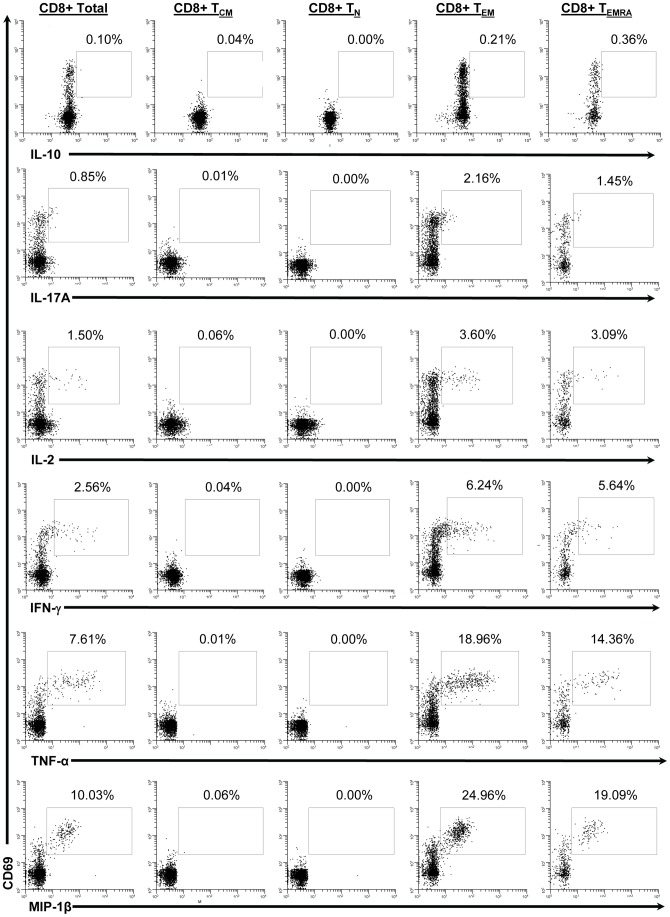
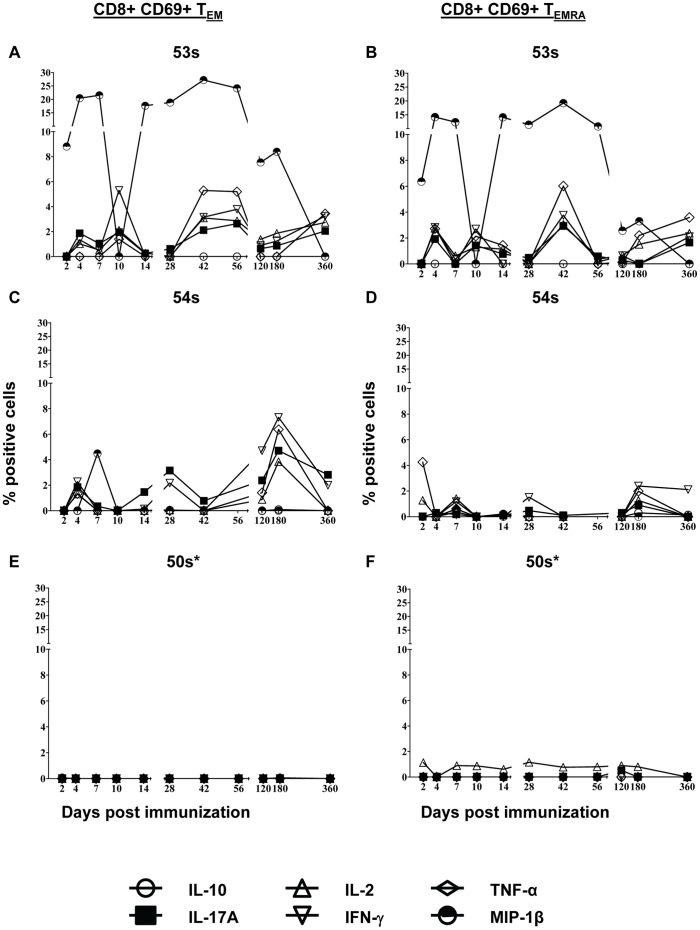
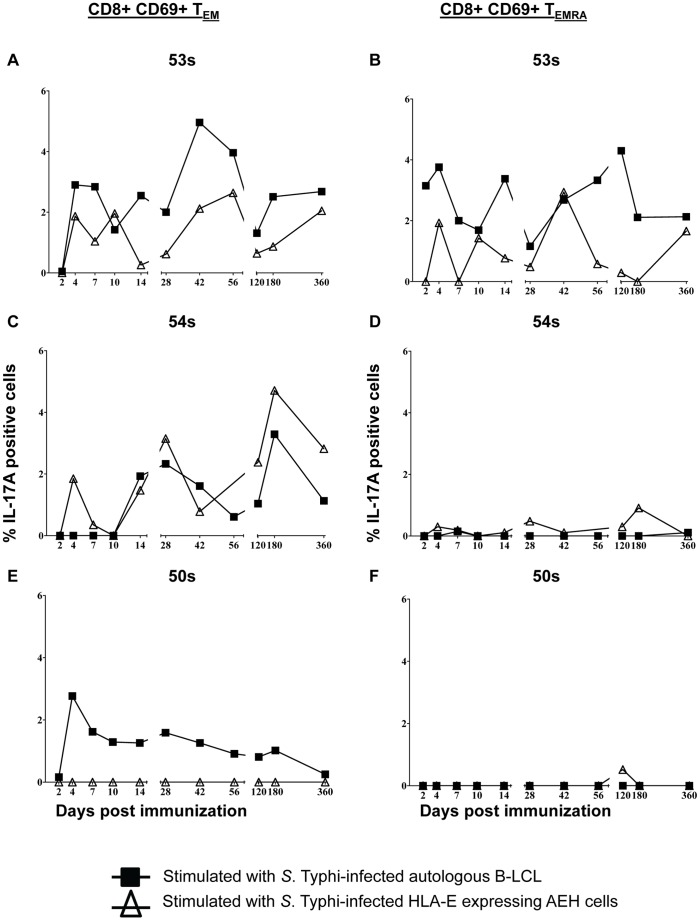
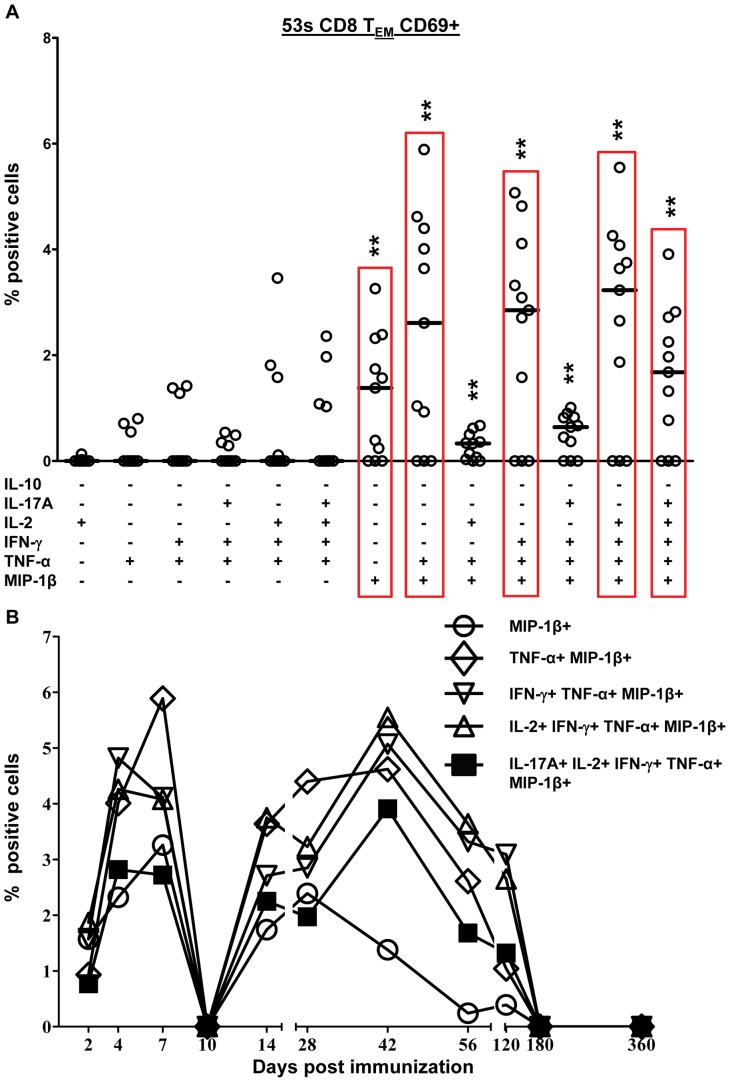
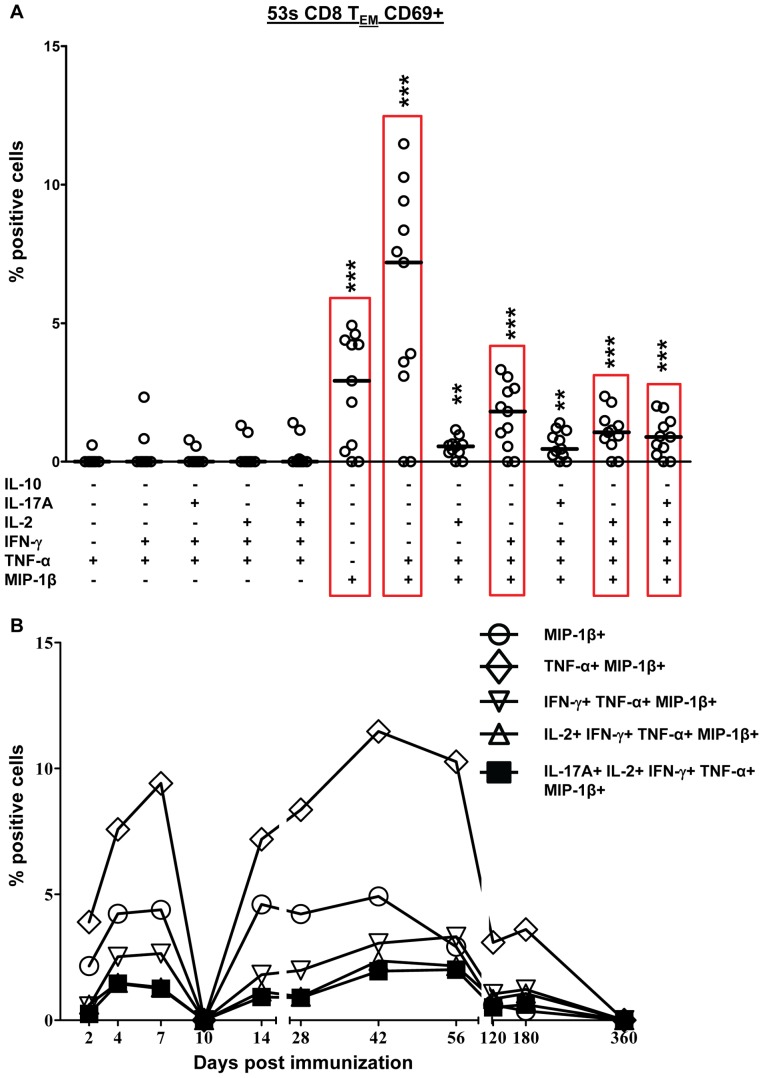
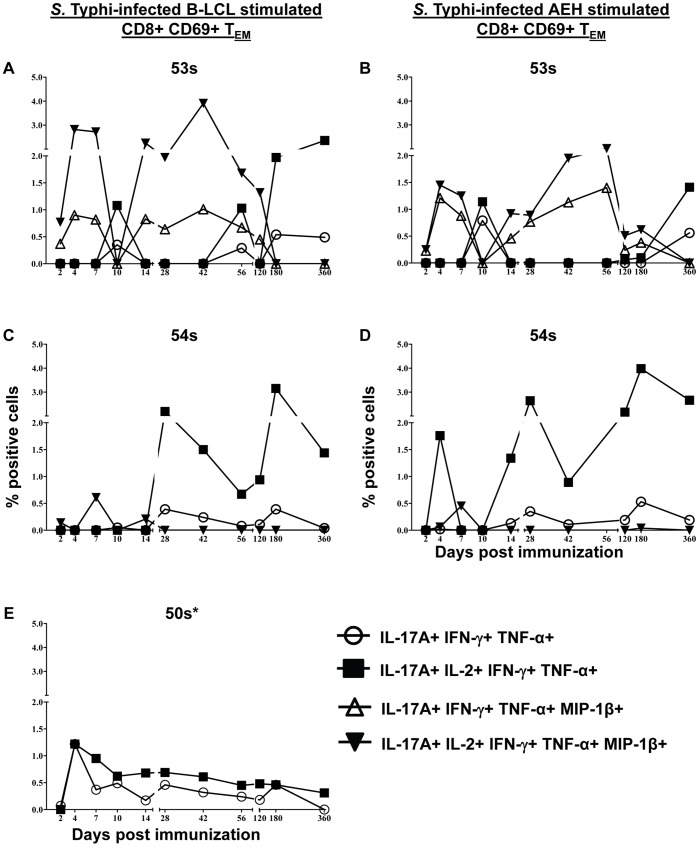
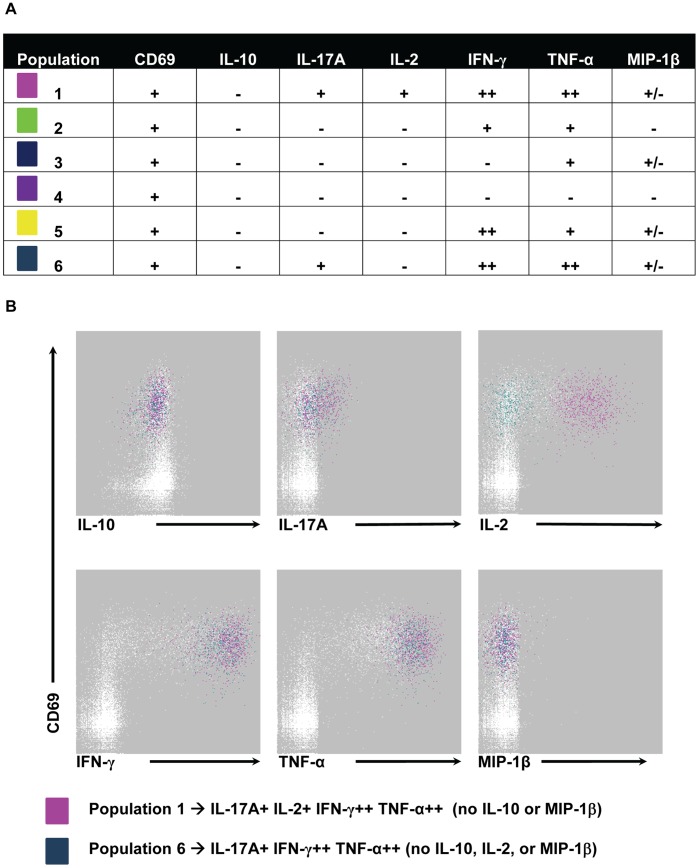
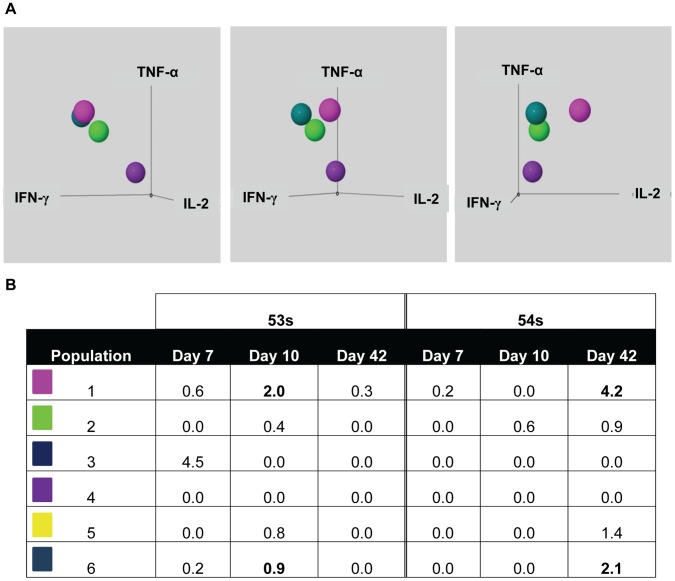
Salmonella enterica serovar Typhi (S. Typhi), the causative agent of typhoid fever, continues to cause significant morbidity and mortality world-wide. CD8+ T cells are an important component of the cell mediated immune (CMI) response against S. Typhi. Recently, interleukin (IL)-17A has been shown to contribute to mucosal immunity and protection against intracellular pathogens. To investigate multifunctional IL-17A responses against S. Typhi antigens in T memory subsets, we developed multiparametric flow cytometry methods to detect up to 6 cytokines/chemokines (IL-10, IL-17A, IL-2, interferon-γ (IFN-γ), tumor necrosis factor-α (TNF-α) and macrophage inflammatory protein-1β (MIP-1β)) simultaneously. Five volunteers were immunized with a 4 dose regimen of live-attenuated S. Typhi vaccine (Ty21a), peripheral blood mononuclear cells (PBMC) were isolated before and at 11 time points after immunization, and CMI responses were evaluated. Of the 5 immunized volunteers studied, 3 produced detectable CD8+ T cell responses following stimulation with S. Typhi-infected autologous B lymphoblastoid cell lines (B-LCL). Additionally, 2 volunteers had detectable levels of intracellular cytokines in response to stimulation with S. Typhi-infected HLA-E restricted cells. Although the kinetics of the responses differed among volunteers, all of the responses were bi- or tri-phasic and included multifunctional CD8+ T cells. Virtually all of the IL-17A detected was derived from multifunctional CD8+ T cells. The presence of these multifunctional IL-17A+ CD8+ T cells was confirmed using an unsupervised analysis program, flow cytometry clustering without K (FLOCK). This is the first report of IL-17A production in response to S. Typhi in humans, indicating the presence of a Tc17 response which may be important in protection. The presence of IL-17A in multifunctional cells co-producing Tc1 cytokines (IL-2, IFN-γ and TNF-α) may also indicate that the distinction between Tc17 and Tc1 responses in humans is not as clearly delineated as suggested by in vitro experiments and animal models.


Conflict of interest statement

Competing Interests: The authors have declared that no competing interests exist.

Figures

Figure 1
Figure 1. Detection of intracellular cytokines/chemokines produced by CD8+ T cell memory subsets in response to stimulation with S. Typhi-infected autologous B-LCL.
Histograms from a representative volunteer (53 s at day 7 post infection) showing the production of 6 cytokines/chemokines by memory T cell subsets following stimulation with S. Typhi-infected autologous B-LCL. CD69 (a marker of recent activation) is displayed on the y-axis and each of the 6 cytokines/chemokines measured are displayed on the x-axes. Column 1 represents total CD8+ T cells, column 2 represents T central memory (TCM; CD62L+ CD45RA-), column 3 represents T naïve (TN; CD62L+ CD45RA+), column 4 represents T effector memory (TEM; CD62L- CD45RA-), and column 5 represents T effector memory CD45RA+ (TEMRA; CD62L- CD45RA+). The percentage of positive cells is shown for the indicated region in each cytogram.
Figure 2
Figure 2. Kinetics of intracellular cytokine/chemokine production following stimulation of PBMC with S. Typhi-infected autologous B-LCL.
Intracellular cytokine/chemokine production is shown as the percentage of positive cells. Responses are expressed as net values with day 0 subtracted to normalize for differences in base-line responses to S. Typhi in different volunteers. A) CD8+ TEM cells for volunteer 53 s B) CD8+ TEMRA cells for volunteer 53 s C) CD8+ TEM cells for volunteer 54 s D) CD8+ TEMRA cells for volunteer 54 s E) CD8+ TEM cells for volunteer 50 s F) CD8+ TEMRA cells for volunteer 50 s. Increases of >0.5% cytokine positive cells over uninfected targets were found to be consistently statistically significant (P<0.01) by chi-square analyses. * MIP-1b not measured.
Figure 3
Figure 3. Detection of intracellular cytokines/chemokines produced by CD8+ T cell memory subsets in response to stimulation with S. Typhi-infected HLA-E restricted cells.
Histograms from a representative volunteer (53 s at day 7 post infection) showing the production of 6 cytokines/chemokines by memory T cell subsets following stimulation with S. Typhi-infected AEH cells. CD69 (marker of recent activation) is displayed on the y-axis and each of the 6 cytokines/chemokines measured are displayed on the x-axes. Column 1 represents total CD8+ T cells, column 2 represents TCM, column 3 represents TN, column 4 represents TEM, and column 5 represents TEMRA. The percentage of positive cells is shown for the indicated region in each cytogram.
Figure 4
Figure 4. Kinetics of intracellular cytokine/chemokine production following stimulation of PBMC with S. Typhi-infected HLA-E restriced cells.
Intracellular cytokine/chemokine production is shown as the percentage of positive cells. Responses are expressed as net values with day 0 subtracted to normalize for differences in base-line responses to S. Typhi in different volunteers. A) CD8+ TEM cells for volunteer 53 s B) CD8+ TEMRA cells for volunteer 53 s C) CD8+ TEM cells for volunteer 54 s D) CD8+ TEMRA cells for volunteer 54 s E) CD8+ TEM cells for volunteer 50 s F) CD8+ TEMRA cells for volunteer 50 s. Increases of >0.5% cytokine positive cells over uninfected targets were found to be statistically significant (P<0.01). * MIP-1b not measured.
Figure 5
Figure 5. Kinetics of intracellular IL-17A production following stimulation with either S. Typhi-infected autologous B-LCL or HLA-E restricted cells.
Intracellular cytokine/chemokine production is shown as the percentage of positive cells. Responses are expressed as net values with day 0 subtracted to normalize for differences in base-line responses to S. Typhi in different volunteers. Responses to S. Typhi-infected autologous B-LCL are indicated by a filled square (▪) and responses to S. Typhi-infected HLA-E restricted cells are indicated by open triangles (▵). A) CD8+ TEM cells for volunteer 53 s B) CD8+ TEMRA cells for volunteer 53 s C) CD8+ TEM cells for volunteer 54 s D) CD8+ TEMRA cells for volunteer 54 s E) CD8+ TEM cells for volunteer 50 s F) CD8+ TEMRA cells for volunteer 50 s. Increases of >0.5% cytokine positive cells over uninfected targets were found to be statistically significant (P<0.01).
Figure 6
Figure 6. Multifunctional CD8+ TEM responses to S. Typhi-infected autologous B-LCL.
A) Scatter plot showing all combinations of the 6 cytokines/chemokines measured that were positive at one or more time points for representative volunteer 53 s. Increases of >0.5% positive cells over uninfected targets were statistically significant (P<0.01). Each point represents a single time-point and the median value is denoted by a horizontal bar. The cyokine/chemokine combinations with the top 5 median values are indicated by red rectangles. Median values of the subsets of multifunctional cells that show a significant difference (**P<0.01), when compared to the subsets without asterisks, are indicated. B) Kinetics of the top 5 populations (as determined by median value) over time.
Figure 7
Figure 7. Multifunctional CD8+ TEM responses to S. Typhi-infected HLA-E restricted cells.
A) Scatter plot showing all combinations of the 6 cytokines/chemokines measured that were positive at one or more time points for representative volunteer 53 s. Increases of >0.5% positive cells over uninfected targets were statistically significant. Each point represents a single time-point and the median value is denoted by a horizontal bar. The cyokine/chemokine combinations with the top 5 median values are indicated by red rectangles. Median values of the subsets of multifunctional cells that show a significant difference (**P<0.01, ***P<0.001), when compared to the subsets without asterisks, are indicated. B) Kinetics of the top 5 populations (as determined by median value) over time.
Figure 8
Figure 8. Multifunctional CD8+ TEM IL-17A+ populations.
Kinetics of multifunctional IL-17A+ populations (if net >0.5%) following stimulation with either S. Typhi-infected autologous B-LCL (A, C, & E) or HLA-E restricted cells (B & D). Net increases of >0.5% cytokine positive cells over uninfected targets were found to be statistically significant (P<0.01). 50 s had no response to HLA-E restricted stimulation. * MIP-1b was not measured.
Figure 9
Figure 9. CD69+ populations identified by unsupervised FLOCK analyses.
CD3+ CD8+ TEM events following S. Typhi-infected autologous B-LCL stimulation were uploaded to ImmPort for FLOCK analyses. A) Cytokine/chemokine production patterns of the 6 CD69+ populations identified by FLOCK. B) Histograms showing FLOCK of representative volunteer 53 s at day 10 post immunization with the IL-17A+ populations highlighted (population 1- pink and population 6- aqua).
Figure 10
Figure 10. Three-dimensional representation of FLOCK data and percentages for each of the CD69+ populations at 3 time-points.
A) Populations 1 (pink), 2 (lime green), 4 (purple), and 6 (aqua) shown in 3-dimensions. IL-2 is shown on the x-axis, IFN-γ on the y-axis, and TNF-α on the z-axis. B) Cross-sample analysis results showing net (day 0 subtracted) percentages of CD8+ TEM for each of the CD69+ populations at days 7, 10, and 42 post immunization for volunteers 53 s and 54 s. Peak responses for each population are bolded.

References

    1. Bhutta ZA, Threlfall J. Addressing the global disease burden of typhoid fever. JAMA. 2009;302:898–899. - PubMed
    1. Crump JA, Mintz ED. Global trends in typhoid and paratyphoid Fever. Clin Infect Dis. 2010;50:241–246. - PMC - PubMed
    1. Atkins BL, Gottlieb T. Emerging drug resistance and vaccination for typhoid fever. JAMA 279: 579; author reply. 1998;580 - PubMed
    1. Bhutta ZA. Impact of age and drug resistance on mortality in typhoid fever. Arch Dis Child. 1996;75:214–217. - PMC - PubMed
    1. Crump JA, Luby SP, Mintz ED. The global burden of typhoid fever. Bull World Health Organ. 2004;82:346–353. - PMC - PubMed

Publication types

LinkOut - more resources