. 2012:2:440.
doi: 10.1038/srep00440. Epub 2012 Jun 6.

Incunabular immunological events in prion trafficking

Affiliations

Incunabular immunological events in prion trafficking

Brady Michel et al. Sci Rep. 2012.

Abstract

While prions probably interact with the innate immune system immediately following infection, little is known about this initial confrontation. Here we investigated incunabular events in lymphotropic and intranodal prion trafficking by following highly enriched, fluorescent prions from infection sites to draining lymph nodes. We detected biphasic lymphotropic transport of prions from the initial entry site upon peripheral prion inoculation. Prions arrived in draining lymph nodes cell autonomously within two hours of intraperitoneal administration. Monocytes and dendritic cells (DCs) required Complement for optimal prion delivery to lymph nodes hours later in a second wave of prion trafficking. B cells constituted the majority of prion-bearing cells in the mediastinal lymph node by six hours, indicating intranodal prion reception from resident DCs or subcapsulary sinus macrophages or directly from follicular conduits. These data reveal novel, cell autonomous prion lymphotropism, and a prominent role for B cells in intranodal prion movement.


Figures

Figure 1
Figure 1. Purification and conjugation of prion rods from infected brain homogenate and real-time whole-mouse in vivo imaging.
(a) Western blot analysis depicting CWD infected elk brain homogenate used as starting material (5 µg in lane 1 and 100 µg in lane 2) from which we enriched prion rod aggregates (100 ng in lanes 3 and 4). Lanes 5 and 6 show 100 µg of control elk normal brain homogenate. (b) SDS page gel depicting fluorochrome tagged prion rods. Prions treated at 37°C without Proteinase K (PK, lane 1) or with PK (lane 2), and at 95°C with PK (lane 3). Molecular weight markers are shown in kilodaltons to the left of the blots. (c) In vivo detection of prion rods by epifluorescent whole-body optical imaging. Representative images of tg5037 mice injected orally or subcutaneously with PBS or fluorescent prion rods or 1 µm polystyrene microspheres (beads). Images were acquired at indicated time points after injection.
Figure 2
Figure 2. Gating strategy for flow cytometry.
Side scatter parameter (SS or SSC) and all other axes are log scale except forward scatter (FS). *CD23 gate not shown, but was set identically to the indicated gate. **CD3 gate not shown, but was set identically to the indicated gate. MΦsF4/80 and DCsF4/80 cells were identified using F4/80 gating. pr, prionophilic; MΦs, macrophages; DCs, dendritic cells; LN, lymph node; SC, Subcapsulary.
Figure 3
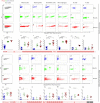
Figure 3. Flow cytometric analysis of immune cells trafficking prions from the PC to MedLN 2 HPI.
PBS (rows a–g, v-ab, ac-ai, and ax-bd), fluorescent beads (h–n, v-ab, aj-ap, and ax-bd) or prion rods (o–u, v-ab, aq-aw, ax-bd) were injected into the PC of mice and cells harvested from peritoneal lavage fluid (a-ab) or mediastinal lymph nodes (ac-bd) two hours later. Graphs in the first column show cells from mice treated with PBS (panels a, v ac, and ax), fluorescent beads (h, v, aj, and ax) and prion rods (panels o, v, aq, and ax). Fluorescent cells (red or green dots) and total cells (grey dots) are plotted to show relative size (forward scatter, linear scale), granularity (side scatter, log scale) and proportion of total live cells that fluoresce. Cells were also stained with antibodies against immune cell surface markers and gated for SSChiLy6G- Ly6C+CD11b+ monocytes (panels b, i, p, w, ad, ak, ar, and ay), SSChiLy6G+ Ly6C-CD11c- CD11b+ neutrophils (c, j, q, x, ae, al, as, and az), SSChiLy6G- Ly6C-CD11b+CD11c+ DCs (d, k, r, y, af, am, at, ba), SSChiLy6G-Ly6C-CD11c-CD11b+ MΦs, (e, l, s, z, ag, an, au, and b), SSCloB220+CD21+CD3- B cells (f, m, t, aa, ah, ao, av, and bc) and SSCloCD21-B220- CD3+ T cells (g, n, u, ab, ai, ap, aw, and bd). Cell counts in graphs are shown as log10 per 105 total cells. Horizontal bars below the PC and MedLN panels represent relative proportions of prion-bearing monocytes (red stripe), neutrophils (solid red), DCs (dotted), MΦs (checkered), B cells (white) and T cells (black).
Figure 4
Figure 4. Analysis of monocytes capturing prion rods in the PC by confocal microscopy.
PBS and prion rods (labeled red) were injected into the PC of mice and CD11b+Ly6C+ (labeled blue and green, respectively) monocytes were analyzed for prion retention. Z stack images were collected at 0.28 μm intervals and range from 0.64 to 7.31 μm. Image shown in row three, column six indicates isotype and PBS controls. Bottom row starting from the left show single stains of the nucleus (white), Ly6C, CD11b, and prion rods. The Last 2 panels in the bottom row represent a merged z stack image and an orthogonal image.
Figure 5
Figure 5. Flow cytometric analysis of passive and active transport of prion rods.
Prion rods were injected IP into donor mice and two hours later immune cells harvested from the PC and mediastinal lymph nodes. Peritoneal cells were washed to remove unbould prion rods and transferred into the PC of recipient mice. MedLN from donor mice 2 HPI (panels a–e), and recipient mice 2 and 16 HPI (panels f–k), were analyzed for prion-bearing resident and migratory immune cells, respectively. Total cells from the MedLN (grey dots in panels a, f and g) are plotted to show relative size (forward scatter, linear scale), granularity (side scatter, log scale) and proportion of total live cells that bear prions (red dots). Resident MedLN cells were analyzed for SSChiCD11b+CD169+ SCS MΦs (b and d) and SSChiCD11c+CD8α+ DCs (c and e) bearing prion rods. Prion-loaded cells from donor mice were injected into the PC of recipient mice and lymph nodes harvested 2 and 16 hours later. Migratory immune cells were also analyzed for monocytes (depicted as red peaks (h and i) and dots (Jjand k)), DCs (green) and MΦs (purple) using the same phenotypic markers used in Figure 3. These cell subsets were compared to cells in MedLN from PBS inoculated control mice (blue). Cell counts in graphs d, e, j and k are shown as log10 per 105 total cells.
Figure 6
Figure 6. Flow cytometric analysis of B cell subsets in transport of prion rods.
Adoptive transfer experiment was performed similarly as experiments in Figure 5. Prion rods were injected IP into donor mice and six hours later immune cells harvested from the PC were washed and transferred into the PC of recipient mice. MedLN from donor (panels a–e) and recipient mice (panels f–h) were analyzed 6 HPI for prion-bearing B1 and B2 cells. Donor MedLN cells were analyzed for SSCloCD21+B220+CD5CD11b-CD23+ follicular B2 cells (b and d) and SSCloB220 CD21CD23CD11b+CD5+ B-1 cells (c and e) bearing prion rods. Recipient MedLNs were also analyzed for prion uptake by B2 cells (red peak (g) and dots (h)) and B1 cells (green). B cell subsets were compared to cells in MedLN from PBS inoculated control mice (blue). Cell counts in graphs are shown as log10 per 105 total cells (d and e) or per 104 B cells (h).
Figure 7
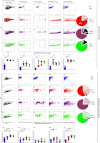
Figure 7. Flow cytometric analysis of immune cells trafficking prions in complement deficient mice.
Figure panels are arranged similarly as in Figure 4. Pie charts to the right of the flow cytographs of prionophils from wt (f–j), C1q−/− (k–o) and C3−/− (p–t) mice represent relative frequencies of prionophils. Pie chart wedges depict MΦs from wt (red), C1q−/− (purple), and C3−/− (green) mice, DCs from wt (dotted red), C1q−/− (dotted purple), and C3−/− (dotted green) mice, monocytes from wt (striped red), C1q−/− (striped purple), and C3−/− (striped green) mice, and neutrophils (black) from wt, C1q−/−, and C3−/− mice.
Figure 8
Figure 8. Prion Trafficking Model.
Immune cells encounter prions in the PC and MedLN. Mφ, DCs, monocytes, neutrophils, B and T cells have all been shown to associate with prions in the PC and MedLN early after infection. Small prion particles traffic passively through the lymphatic system and enter the lymph node through afferent lymphatic vessels where they encounter B cells through follicular conduits. DCs may also access prions through protrusion of their dendrites through tight junctions into follicular conduits. SCS Mφs trap larger prion or prion-complement immune complexes through scavenger or complement receptor 3 and may present them to underlying follicular B cells. Inflammatory monocytes actively transport prions to SCS Mφs, B cells, or DCs in the draining lymph node. B cells facilitate intrafollicular prion trafficking to FDCs for efficient prion replication.

Similar articles

Cited by

References

    1. Prusiner S. B. Novel proteinaceous infectious particles cause scrapie. Science 216, 136–144 (1982). - PubMed
    1. Büeler H. R. et al. Mice devoid of PrP are resistant to scrapie. Cell 73, 1339–1347 (1993). - PubMed
    1. Brown K. L. et al. Scrapie replication in lymphoid tissues depends on prion protein- expressing follicular dendritic cells. Nat Med 5, 1308–1312 (1999). - PubMed
    1. Montrasio F. et al. Impaired prion replication in spleens of mice lacking functional follicular dendritic cells. Science 288, 1257–1259 (2000). - PubMed
    1. Götze O. & Müller-Eberhard H. J. The c3-activator system: an alternate pathway of complement activation. J. Exp. Med. 134, 90–108 (1971). - PMC - PubMed

Publication types

MeSH terms