

Structural determinants of the supramolecular organization of G protein-coupled receptors in bilayers
- PMID: 22679925
- PMCID: PMC3406292
- DOI: 10.1021/ja303286e
Structural determinants of the supramolecular organization of G protein-coupled receptors in bilayers
Abstract
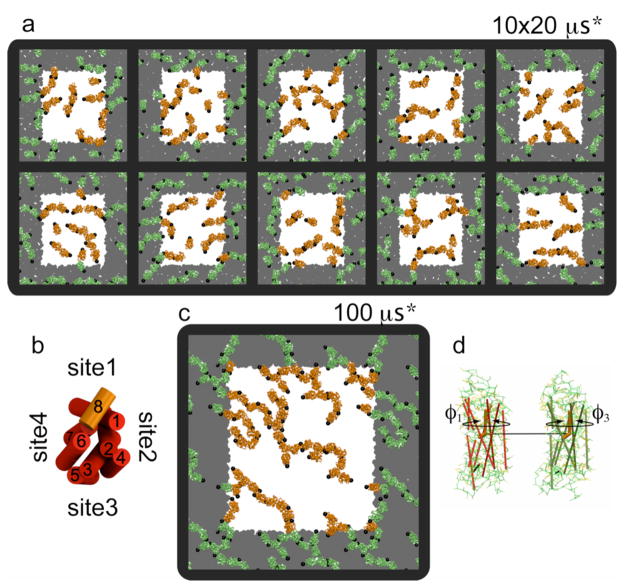
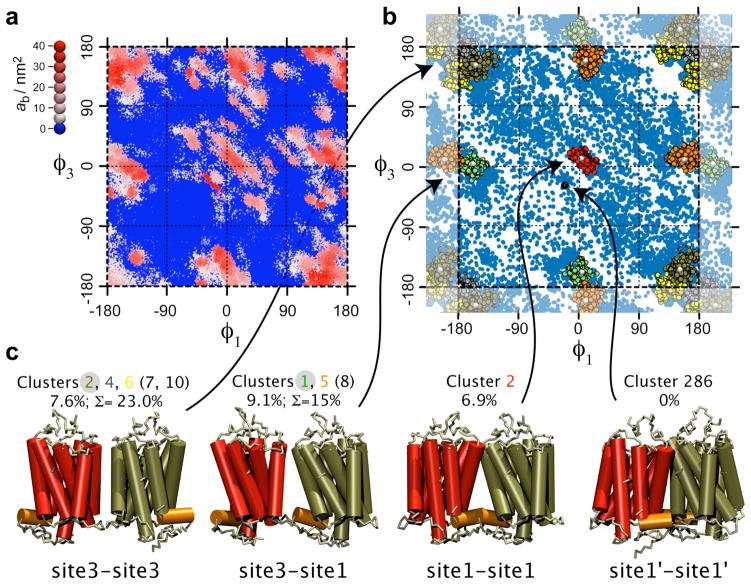
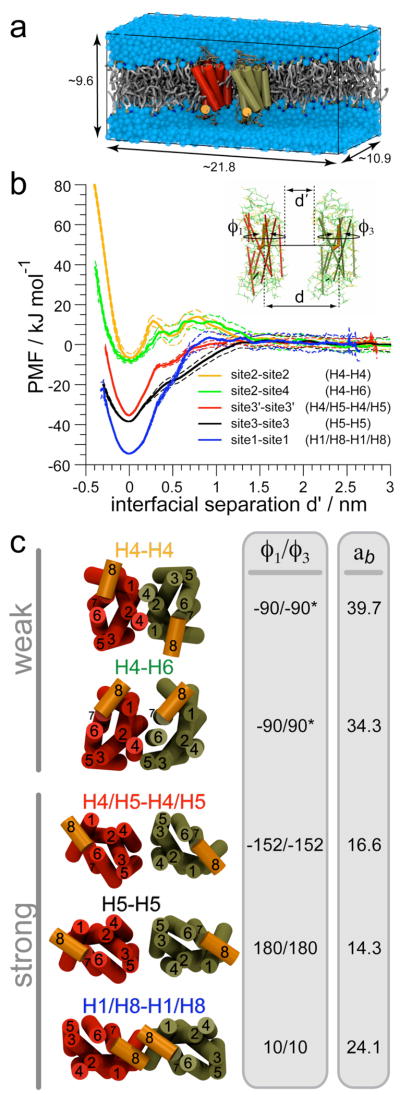
The G protein-coupled receptor (GPCR) rhodopsin self-assembles into supramolecular structures in native bilayers, but the structural determinants of receptor oligomerization are not known. We carried out multiple self-assembly coarse-grained molecular dynamics (CGMD) simulations of model membranes containing up to 64 molecules of the visual receptor rhodopsin over time scales reaching 100 μs. The simulations show strong preferential interaction modes between receptors. Two primary modes of receptor-receptor interactions are consistent with umbrella sampling/potential of mean force (PMF) calculations as a function of the distance between a pair of receptors. The preferential interfaces, involving helices (H) 1/8, 4/5 and 5, present no energy barrier to forming a very stable receptor dimer. Most notably, the PMFs show that the preferred rhodopsin dimer exists in a tail-to-tail conformation, with the interface comprising transmembrane H1/H2 and amphipathic H8 at the extracellular and cytoplasmic surfaces, respectively. This dimer orientation is in line with earlier electron microscopy, X-ray, and cross-linking experiments of rhodopsin and other GPCRs. Less stable interfaces, involving H4 and H6, have a free energy barrier for desolvation (delipidation) of the interfaces and appear to be designed to stabilize "lubricated" (i.e., lipid-coated) dimers. The overall CGMD strategy used here is general and can be applied to study the homo- and heterodimerization of GPCRs and other transmembrane proteins. Systematic extension of the work will deepen our understanding of the forces involved in the membrane organization of integral membrane proteins.
Figures


Similar articles
-
Affinity of rhodopsin to raft enables the aligned oligomer formation from dimers: Coarse-grained molecular dynamics simulation of disk membranes.PLoS One. 2020 Feb 7;15(2):e0226123. doi: 10.1371/journal.pone.0226123. eCollection 2020. PLoS One. 2020. PMID: 32032370 Free PMC article.
-
Assessing the relative stability of dimer interfaces in g protein-coupled receptors.PLoS Comput Biol. 2012;8(8):e1002649. doi: 10.1371/journal.pcbi.1002649. Epub 2012 Aug 16. PLoS Comput Biol. 2012. PMID: 22916005 Free PMC article.
-
An Ensemble-Based Protocol for the Computational Prediction of Helix-Helix Interactions in G Protein-Coupled Receptors using Coarse-Grained Molecular Dynamics.J Chem Theory Comput. 2017 May 9;13(5):2254-2270. doi: 10.1021/acs.jctc.6b01246. Epub 2017 Apr 25. J Chem Theory Comput. 2017. PMID: 28383913 Free PMC article.
-
Interplay of G Protein-Coupled Receptors with the Membrane: Insights from Supra-Atomic Coarse Grain Molecular Dynamics Simulations.Chem Rev. 2017 Jan 11;117(1):156-185. doi: 10.1021/acs.chemrev.6b00344. Epub 2016 Nov 29. Chem Rev. 2017. PMID: 28073248 Review.
-
X-ray structure breakthroughs in the GPCR transmembrane region.Biochem Pharmacol. 2009 Jul 1;78(1):11-20. doi: 10.1016/j.bcp.2009.02.012. Epub 2009 Feb 27. Biochem Pharmacol. 2009. PMID: 19447219 Review.
Cited by
-
Dynamic Cholesterol-Conditioned Dimerization of the G Protein Coupled Chemokine Receptor Type 4.PLoS Comput Biol. 2016 Nov 3;12(11):e1005169. doi: 10.1371/journal.pcbi.1005169. eCollection 2016 Nov. PLoS Comput Biol. 2016. PMID: 27812115 Free PMC article.
-
Coarse-grained molecular dynamics provides insight into the interactions of lipids and cholesterol with rhodopsin.Adv Exp Med Biol. 2014;796:75-94. doi: 10.1007/978-94-007-7423-0_5. Adv Exp Med Biol. 2014. PMID: 24158802 Free PMC article.
-
Toward optimized potential functions for protein-protein interactions in aqueous solutions: osmotic second virial coefficient calculations using the MARTINI coarse-grained force field.J Chem Theory Comput. 2013 Sep 10;9(9):10.1021/ct400008p. doi: 10.1021/ct400008p. J Chem Theory Comput. 2013. PMID: 24223529 Free PMC article.
-
Beta2-adrenergic receptor homodimers: Role of transmembrane domain 1 and helix 8 in dimerization and cell surface expression.Biochim Biophys Acta Biomembr. 2017 Sep;1859(9 Pt A):1445-1455. doi: 10.1016/j.bbamem.2016.12.007. Epub 2016 Dec 18. Biochim Biophys Acta Biomembr. 2017. PMID: 27993566 Free PMC article.
-
Protein crowding and lipid complexity influence the nanoscale dynamic organization of ion channels in cell membranes.Sci Rep. 2017 Nov 30;7(1):16647. doi: 10.1038/s41598-017-16865-6. Sci Rep. 2017. PMID: 29192147 Free PMC article.
References
-
- Pin JP, Neubig R, Bouvier M, Devi L, Filizola M, Javitch JA, Lohse MJ, Milligan G, Palczewski K, Parmentier M, Spedding M. Pharmacol Rev. 2007;59:5. - PubMed
-
- Doyle DA, Cabral JM, Pfuetzner RA, Kuo AL, Gulbis JM, Cohen SL, Chait BT, MacKinnon R. Science. 1998;280:69. - PubMed
-
- Adler J. Annu Rev Biochem. 1975;44:341. - PubMed
-
- White JH, Wise A, Main MJ, Green A, Fraser NJ, Disney GH, Barnes AA, Emson P, Foord SM, Marshall FH. Nature. 1998;396:679. - PubMed
Publication types
MeSH terms
Substances
Grants and funding
LinkOut - more resources
Full Text Sources
