

Time profile of cosmic radiation exposure during the EXPOSE-E mission: the R3DE instrument
- PMID: 22680687
- PMCID: PMC3371259
- DOI: 10.1089/ast.2011.0759
Time profile of cosmic radiation exposure during the EXPOSE-E mission: the R3DE instrument
Abstract
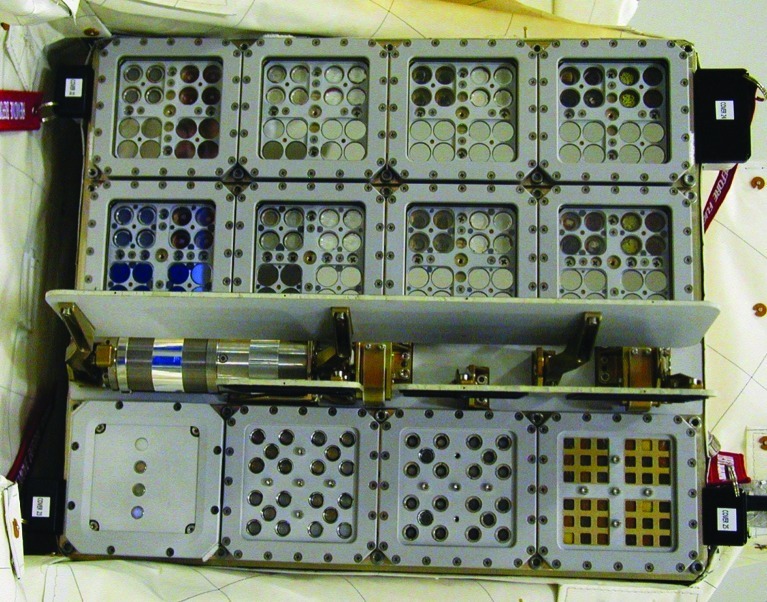
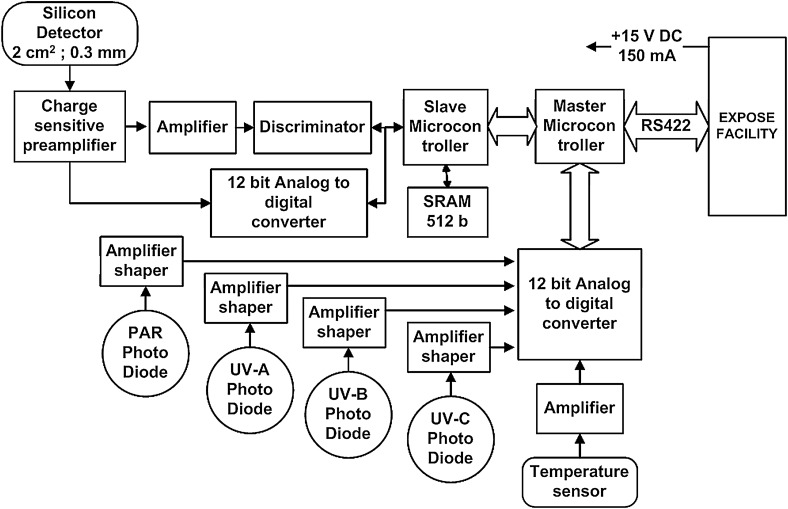
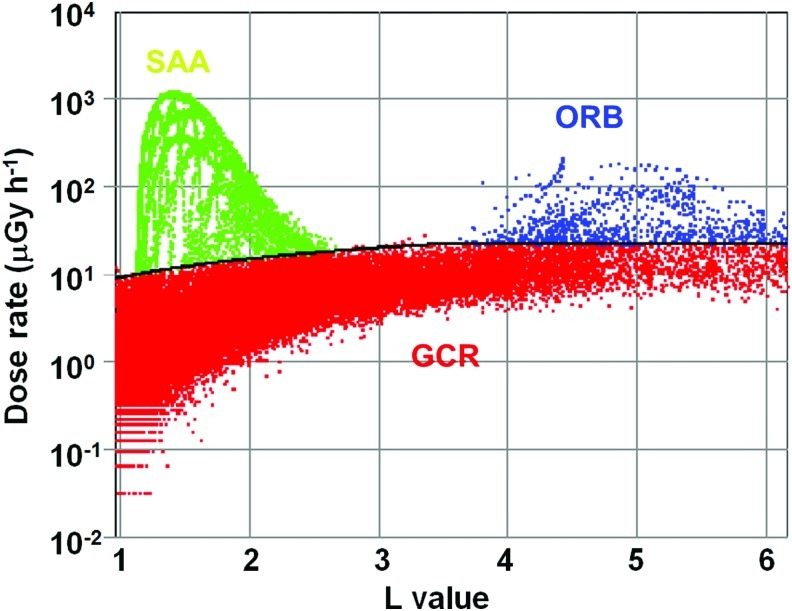
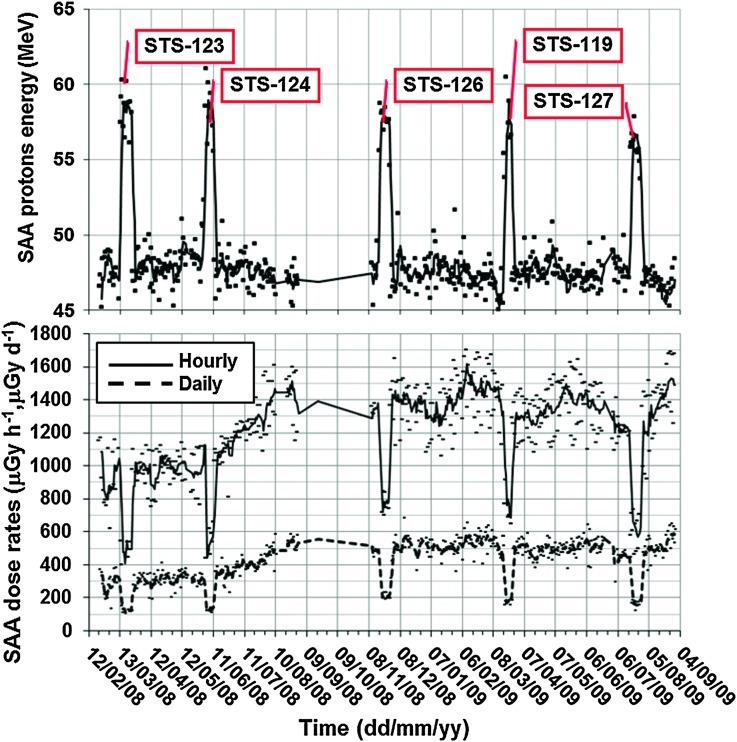
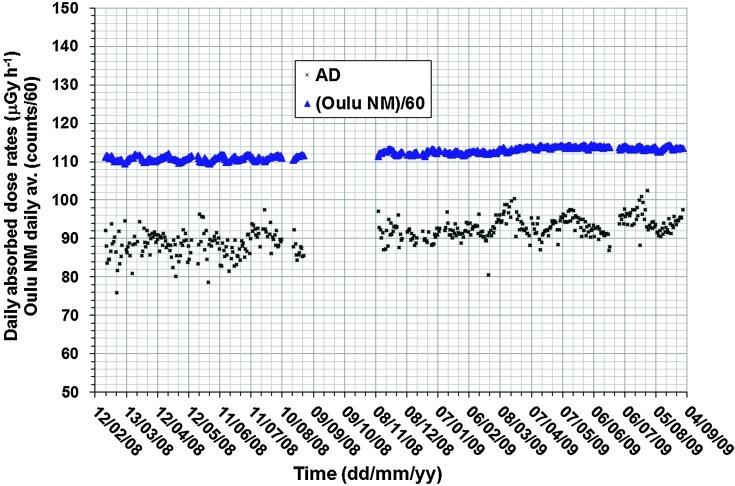
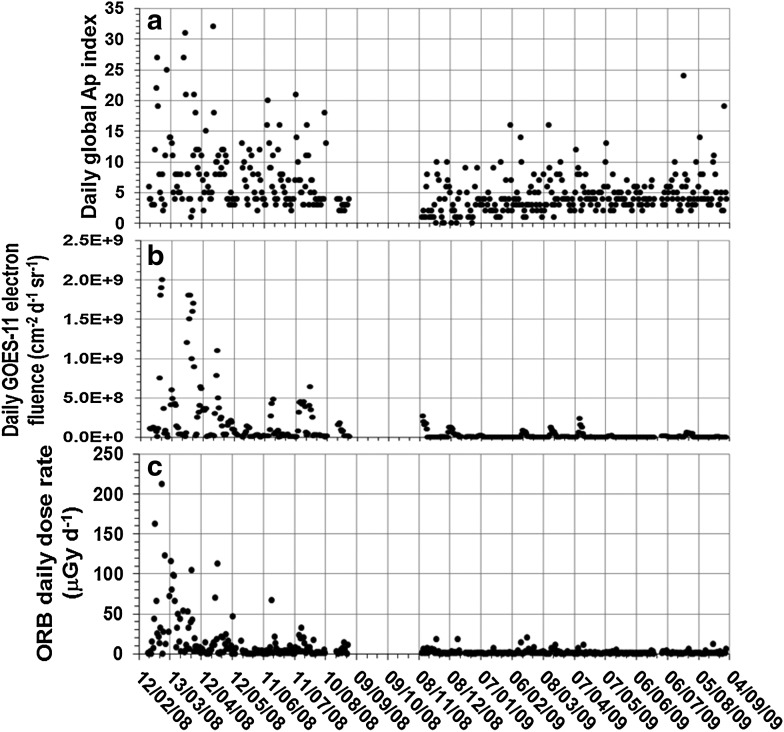
The aim of this paper is to present the time profile of cosmic radiation exposure obtained by the Radiation Risk Radiometer-Dosimeter during the EXPOSE-E mission in the European Technology Exposure Facility on the International Space Station's Columbus module. Another aim is to make the obtained results available to other EXPOSE-E teams for use in their data analysis. Radiation Risk Radiometer-Dosimeter is a low-mass and small-dimension automatic device that measures solar radiation in four channels and cosmic ionizing radiation as well. The main results of the present study include the following: (1) three different radiation sources were detected and quantified-galactic cosmic rays (GCR), energetic protons from the South Atlantic Anomaly (SAA) region of the inner radiation belt, and energetic electrons from the outer radiation belt (ORB); (2) the highest daily averaged absorbed dose rate of 426 μGy d(-1) came from SAA protons; (3) GCR delivered a much smaller daily absorbed dose rate of 91.1 μGy d(-1), and the ORB source delivered only 8.6 μGy d(-1). The analysis of the UV and temperature data is a subject of another article (Schuster et al., 2012 ).
Figures
References
-
- Benghin V.V. Petrov V.M. Drobyshev S.G. Panasyuk M.I. Nechaev O.Yu. Miasnikov A.G. Volkov A.N. 13th Workshop on Radiation Monitoring for the International Space Station (WRMISS); Krakow, Poland: 2008. Sep 8–10, 2008. Results of the radiation monitoring system onboard the service module of ISS.
-
- Berger M.J. NIST Standard Reference Database 124. National Institute of Standards and Technology (NIST); Gaithersburg, MD: 2009. Stopping-power and range tables for electrons, protons, and helium ions.
-
- Dachev T.P. Characterization of the near Earth radiation environment by Liulin type spectrometers. Adv Space Res. 2009;44:1441–1449.
-
- Dachev Ts. Tomov B. Matviichuk Yu. Dimitrov P. Lemaire J. Gregoire G. Cyamukungu M. Schmitz H. Fujitaka K. Uchihori Y. Kitamura H. Reitz G. Beaujean R. Petrov V. Shurshakov V. Benghin V. Spurný F. Calibration results obtained with Liulin-4 type dosimeters. Adv Space Res. 2002;30:917–925. - PubMed
-
- Dachev T.P. Tomov B.T. Matviichuk Yu.N. Dimitrov P.G. Bankov N.G. Relativistic electrons high doses at International Space Station and Foton M2/M3 satellites. Adv Space Res. 2009;44:1433–1440.
Publication types
MeSH terms
Substances
LinkOut - more resources
Full Text Sources
