. 2012 Sep;25(5):573-83.
doi: 10.1111/j.1755-148X.2012.01025.x. Epub 2012 Aug 2.

Melanoma revives an embryonic migration program to promote plasticity and invasion

Affiliations

Melanoma revives an embryonic migration program to promote plasticity and invasion

Caleb M Bailey et al. Pigment Cell Melanoma Res. 2012 Sep.

Abstract

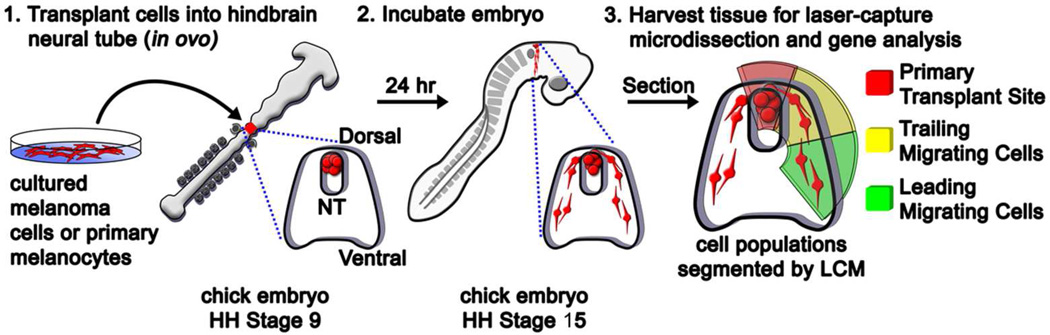
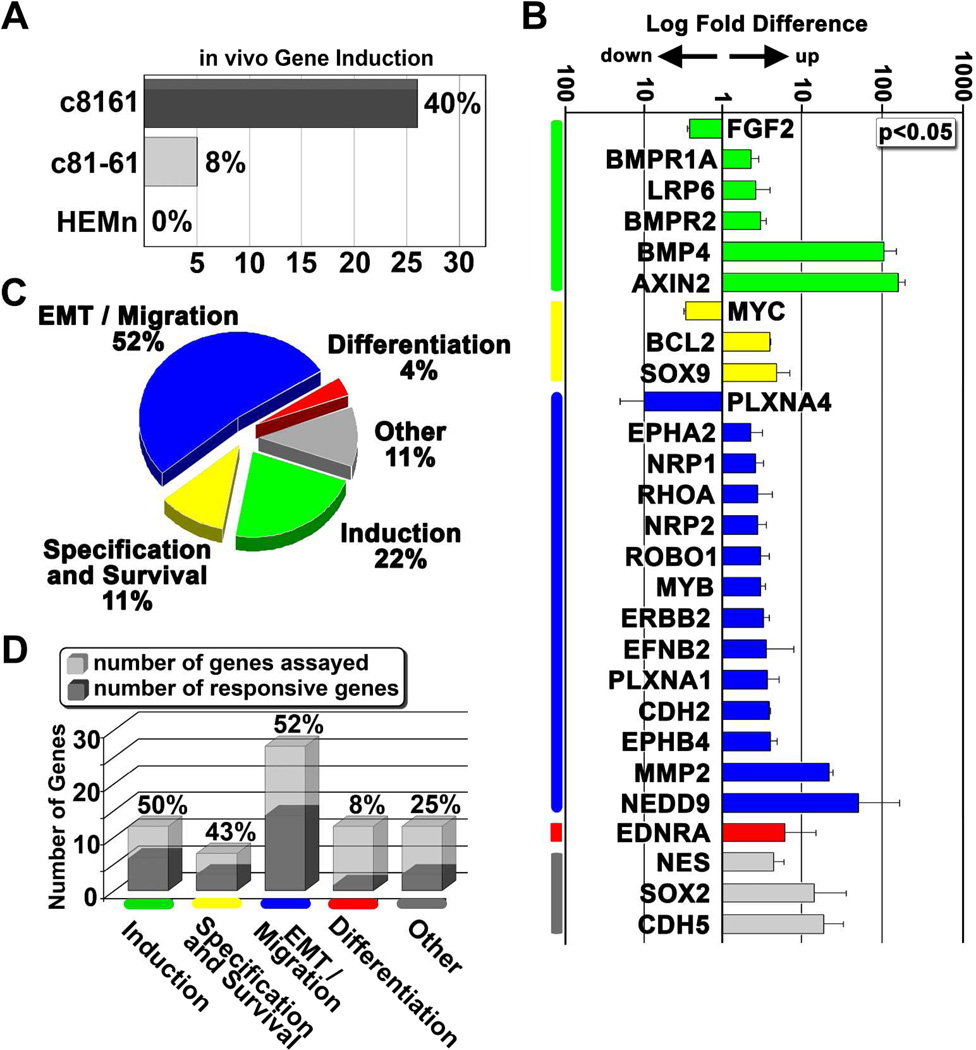
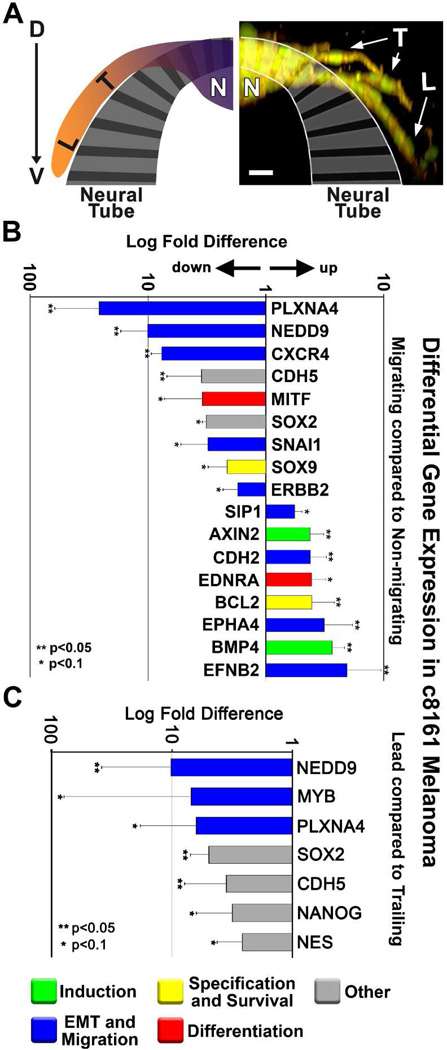
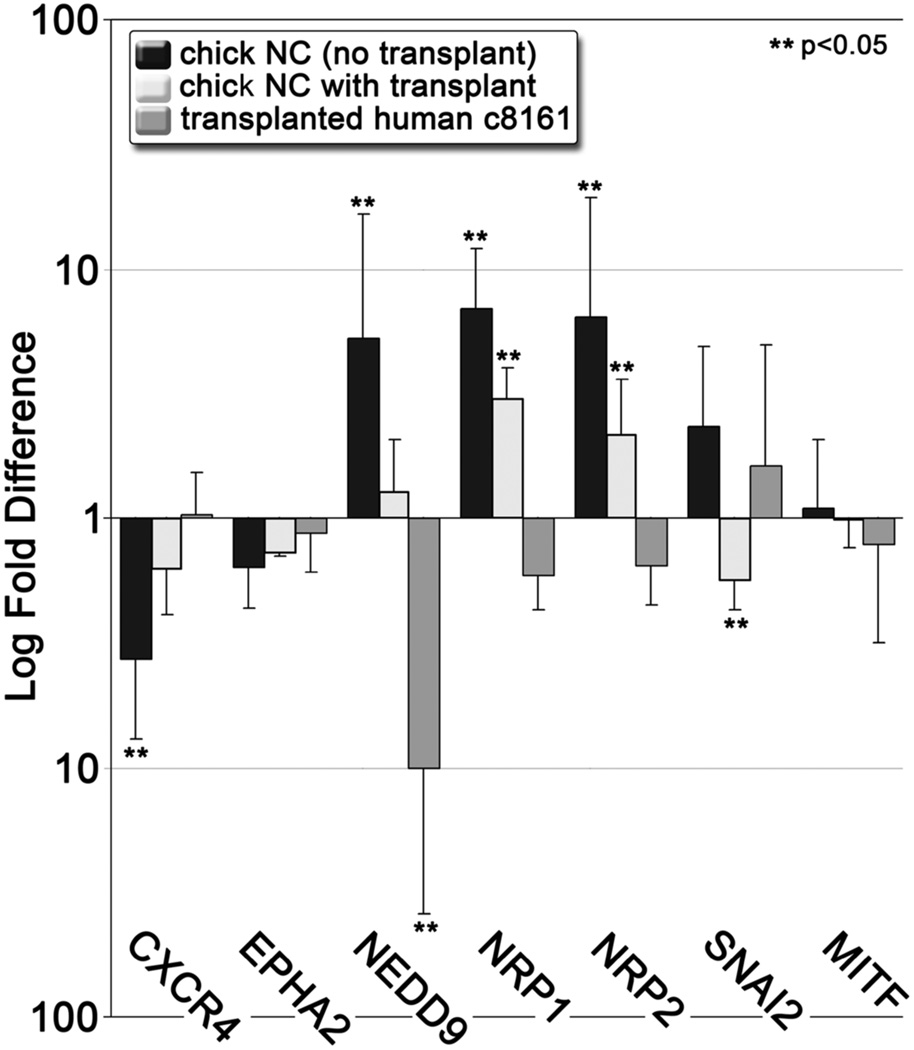
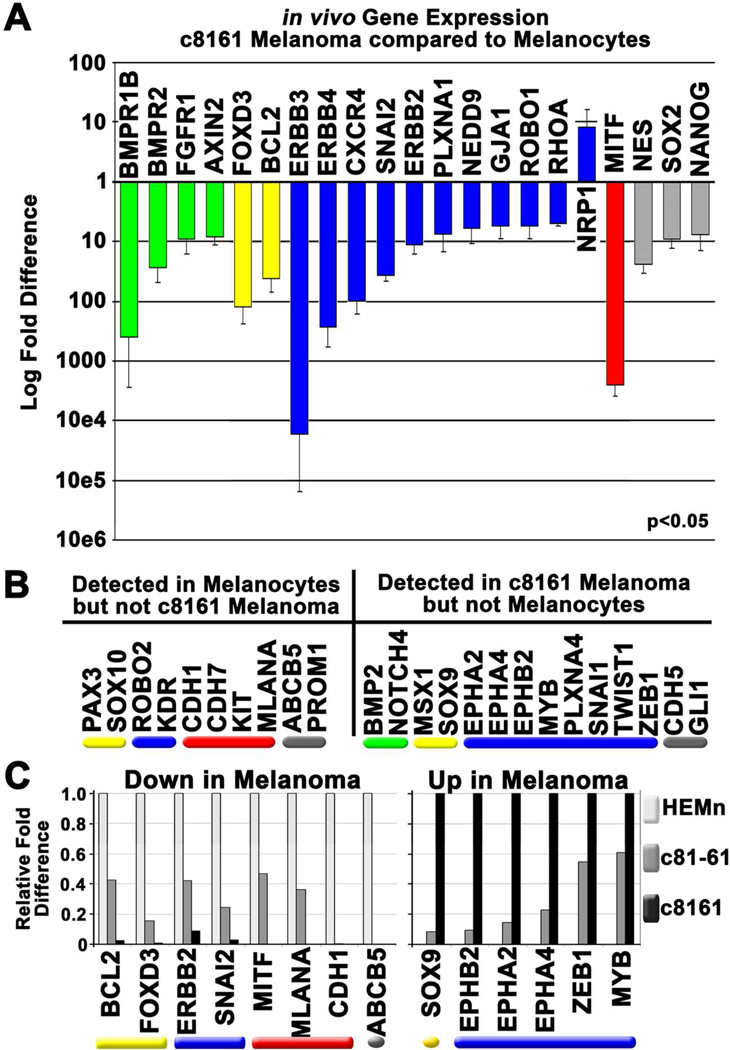
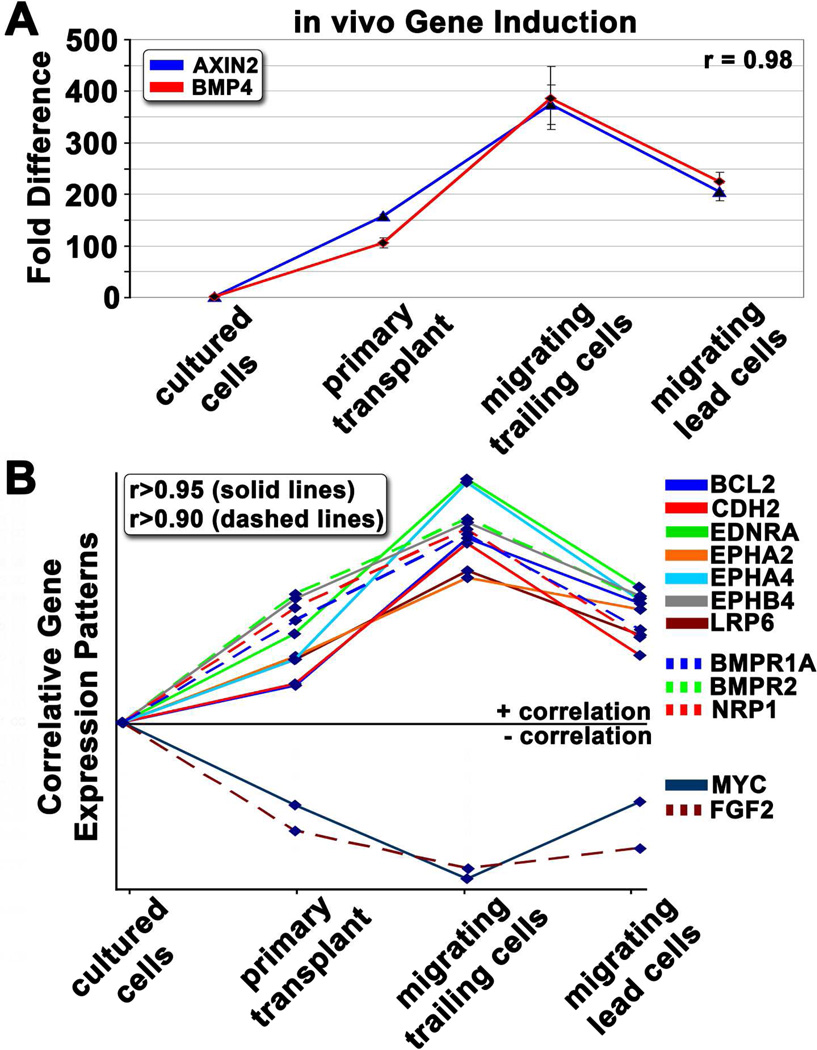
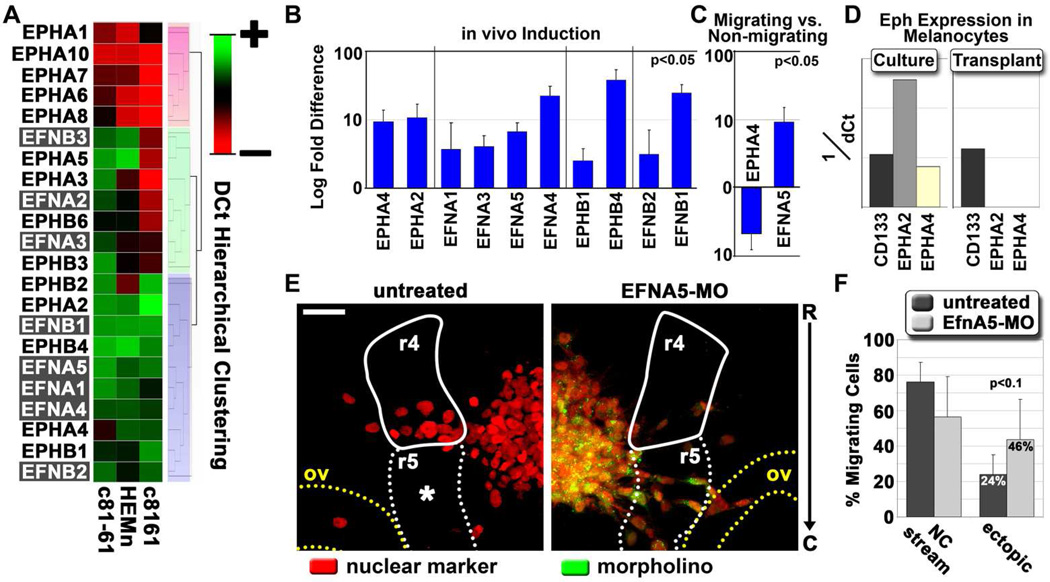
Cancer cells must regulate plasticity and invasion to survive and metastasize. However, the identification of targetable mechanisms to inhibit metastasis has been slow. Signaling programs that drive stem and progenitor cells during normal development offer an inroad to discover mechanisms common to metastasis. Using a chick embryo transplant model, we have compared molecular signaling programs of melanoma and their embryonic progenitors, the neural crest. We report that malignant melanoma cells hijack portions of the embryonic neural crest invasion program. Genes associated with neural crest induction, delamination, and migration are dynamically regulated by melanoma cells exposed to an embryonic neural crest microenvironment. Specifically, we demonstrate that metastatic melanoma cells exploit neural crest-related receptor tyrosine kinases to increase plasticity and facilitate invasion while primary melanocytes may actively suppress these responses under the same microenvironmental conditions. We conclude that aberrant regulation of neural crest developmental genes promotes plasticity and invasiveness in malignant melanoma.


Figures

Figure 1
Figure 1. A cartoon depicting the experimental methods
Cells were transplanted into chick embryo neural tubes at HH Stage 9 and the egg was re-incubated for 24 hours. Following incubation, tissue was harvested and cells from different regions of the transplant were isolated by LCM: cells at the migratory front (leading), trailing cells, and cells from the primary transplant site, shown in green, yellow, and red respectively.
Figure 2
Figure 2. Differential expression of neural crest-related genes from human melanoma and melanocyte cells following exposure to the chick embryonic microenvironment
A) The percentage of total analyzed genes that showed a significant induction following transplantation. c8161 is an invasive human melanoma cell line. c81-61 is a poorly invasive isogenic counterpart to c8161. HEMn are primary human melanocytes. B) A graph showing log fold changes in gene expression following transplantation of c8161 melanoma into the embryo. All genes are normalized to gene expression values acquired from cultured cells, represented by the baseline expression level of 1. All changes reported were statistically significant with a p-value < 0.05 based on the parametric Limma statistical analysis (Jeanmougin et al., 2010) and adjusted using the Benjamini-Hochberg method. Error bars represent the standard deviation of three biological replicates. Genes are grouped based on their involvement with the neural crest program: induction (green), specification and survival (yellow), EMT and migration (blue), differentiation (red). Genes not specifically associated with any of these steps were grouped under the category “other” (gray). C) A pie chart depicting the percentage of induced genes from Figure 2C involved in aspects of the neural crest program: induction, specification, EMT and migration, and differentiation. D) A bar graph illustrating the percent induction of genes involved in the neural crest program, separated by the phases of the neural crest program.
Figure 3
Figure 3. Differential gene expression of migrating compared to non-migrating melanoma cells
A) An immunofluorescent image and accompanying cartoon depicting the biological domains from which melanoma cells were harvested for gene analysis. Domains include “L” for leading cells, “T” for trailing cells, and “N” for non-migrating cells. c8161 melanoma cells are dual-labeled with an H2B:cerulean nuclear marker (pseudo-colored green) and a Gap43:YFP membrane marker. The image is displayed as an XZ projection of an XY z-stack. The image was acquired with a Zeiss 20X NA 1.0 objective. The image is viewed dorsal (D) to ventral (V) along the y-axis. The scale bar represents 30 microns. B) A graph depicting relative fold-changes in gene expression observed in migrating c8161 melanoma cells. Values are displayed as log fold difference. C) A graph depicting relative log-fold changes in gene expression observed in leading c8161 melanoma cells. Error bars represent the standard deviation of three biological replicates. ** depicts changes with p<0.05, * depicts changes with p<0.1 based on Limma statistical analysis.
Figure 4
Figure 4. A comparison of the differential expression of neural crest-related genes from the host chick neural crest and transplanted c8161 melanoma cells
A graph depicting expression in lead cell populations relative to trailing cell populations. Error bars represent the standard deviation of three biological replicates. ** show statistically significant changes (p<0.05).
Figure 5
Figure 5. Expression of some neural crest-related genes correlates with disease progression
A) A graph showing in vivo differential gene expression observed in transplanted c8161 melanoma cells compared to transplanted melanocytes. Error bars represent the standard deviation of three biological replicates. All changes shown in the graph are statistically significant (p<0.05). B) A list of genes expressed by melanocytes but undetected in c8161 and vice versa. C) A graph showing in vivo differential gene expression of genes that show intermediate expression in poorly invasive, more differentiated melanoma cells (c81-61) compared to both melanocytes and c8161 melanoma cells. Genes reduced in c81-61 cells compared to melanocytes are shown in the left panel while those that show an induction compared to melanocytes are shown in the right panel.
Figure 6
Figure 6. Correlative expression patterns highlight important signaling pathways and novel gene interactions
A) A graph depicting relative gene expression patterns for BMP4 and AXIN2 in cells harvested from four distinct microenvironments: cultured cells, primary transplant site, trailing migratory cells, and lead migratory cells (see Figure 1 cartoon for location descriptions). Pearson correlation was used to generate r-values. B) Gene expression patterns showing high correlation (r>0.95 depicted by solid lines, r>0.90 depicted by dashed lines) to AXIN2 and BMP4.
Figure 7
Figure 7. Eph and ephrin expression and regulation in melanoma cells and primary melanocytes
A) Hierarchical cluster analysis based on dCt (cycle threshold normalized for input amount) values. All known human Eph and ephrin family members were analyzed for expression in c8161, c81-61 and primary melanocytes (HEMn). Three primary clusters are highlighted by red, green and gray boxes. B) A graph depicting the induction of Eph/ephrins expressed by c8161 cells following transplantation into the chick embryo, compared to gene expression values from cultured cells. All reported gene expression changes were statistically significant with an adjusted p-value < 0.05. Error bars represent the standard deviation of three biological replicates. C) A graph depicting log-fold changes in Eph/ephrin gene expression observed in migrating c8161 melanoma cells compared to non-migrating cells. D) A graph depicting the expression of EPHA2 and EPHA4 in primary melanocytes harvested from culture or from transplants. Normalized values are provided as 1/dCt. CD133 was used as a positive expression control. E) Microscope images acquired from chick embryos transplanted with wild-type c8161 melanoma cells or c8161 cells pre-treated with a translation-blocking morpholino against ephrin-A5. Cells were labeled with an H2B:cerulean fusion construct (pseudo-colored red). Morpholinos were tagged with lissamine and pseudo-colored green. Embryonic tissue boundaries and fiducial points are provided, including rhombomere 4 in the hindbrain (r4, solid white line), rhombomere 5 (dashed white line), and the otic vesicle (ov, dashed yellow line). The image is viewed rostral (R) to caudal (C) along the y-axis. Fluorescent images represent projected z-stacks, based on a maximum intensity projection. Images were acquired using a Zeiss 20X NA 1.0 objective. Scale bar is 50 microns. F) A graph depicting the percent of c8161 migratory cells that emigrated along the canonical neural crest rhombomere 4 migratory pathway versus those that breached typical migratory pathway boundaries. Values are given as a percent of total migrating cells. Error bars represent the standard deviation of four biological replicates. The statistical analysis was performed using a Student’s t-test.

References

    1. Bustin SA, Benes V, Garson JA, Hellemans J, Huggett J, Kubista M, Mueller R, Nolan T, Pfaffl MW, Shipley GL, et al. The MIQE guidelines: minimum information for publication of quantitative real-time PCR experiments. Clinical chemistry. 2009;55:611–522. - PubMed
    1. Duband JL, Monier F, Delannet M, Newgreen D. Epithelium-mesenchyme transition during neural crest development. Acta anatomica. 1995;154:63–78. - PubMed
    1. Gammill LS, Bronner-Fraser M. Genomic analysis of neural crest induction. Development (Cambridge, England) 2002;129:5731–5741. - PubMed
    1. Gupta PB, Kuperwasser C, Brunet JP, Ramaswamy S, Kuo WL, Gray JW, Naber SP, Weinberg RA. The melanocyte differentiation program predisposes to metastasis after neoplastic transformation. Nature genetics. 2005;37:1047–1054. - PMC - PubMed
    1. Hamburger V, Hamilton HL. A Series of Normal Stages in the Development of the Chick Embryo. Journal of Morphology. 1951;88:49–92. - PubMed

Publication types

MeSH terms