. 2012 Jun 8;46(5):662-73.
doi: 10.1016/j.molcel.2012.05.023.

RNF20 and USP44 regulate stem cell differentiation by modulating H2B monoubiquitylation

Affiliations

RNF20 and USP44 regulate stem cell differentiation by modulating H2B monoubiquitylation

Gilad Fuchs et al. Mol Cell. .

Erratum in

  • Mol Cell. 2015 Oct 15;60(2):338

Abstract

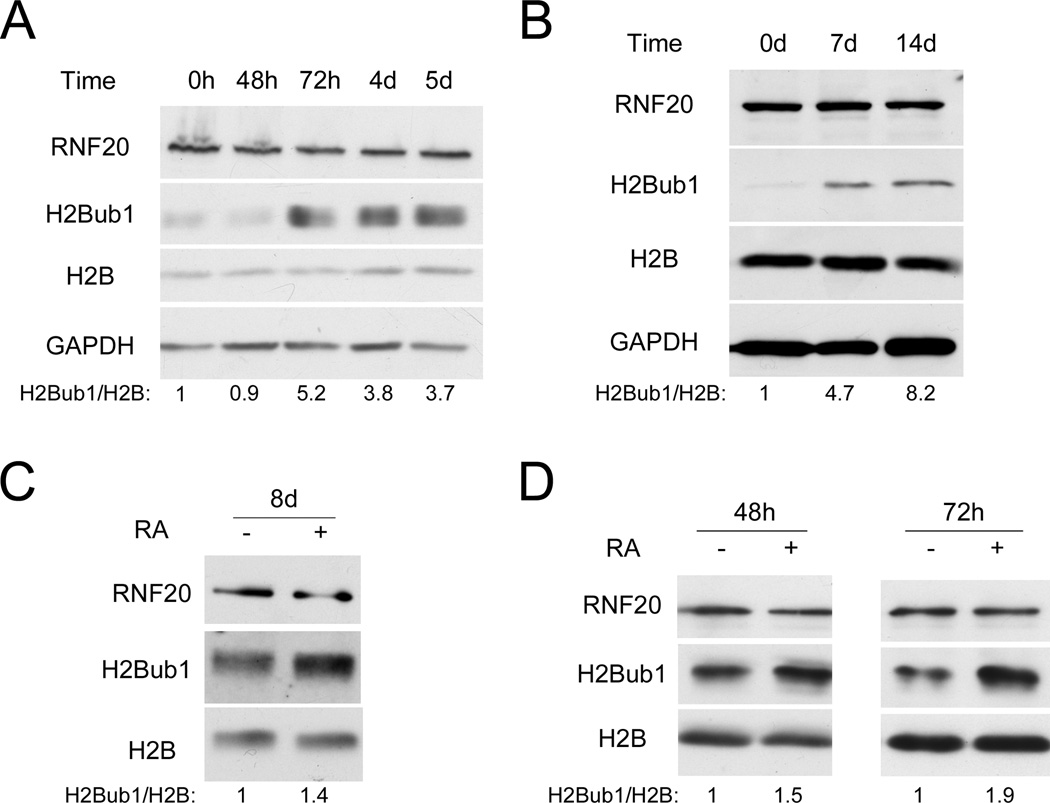
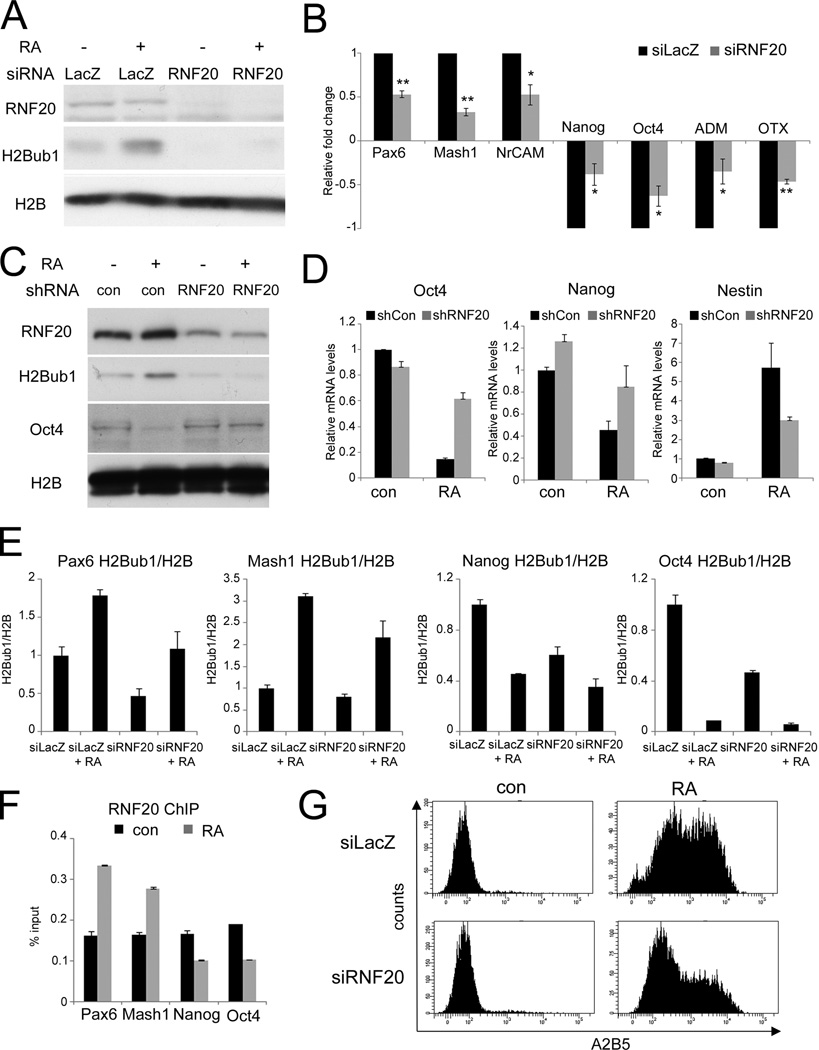
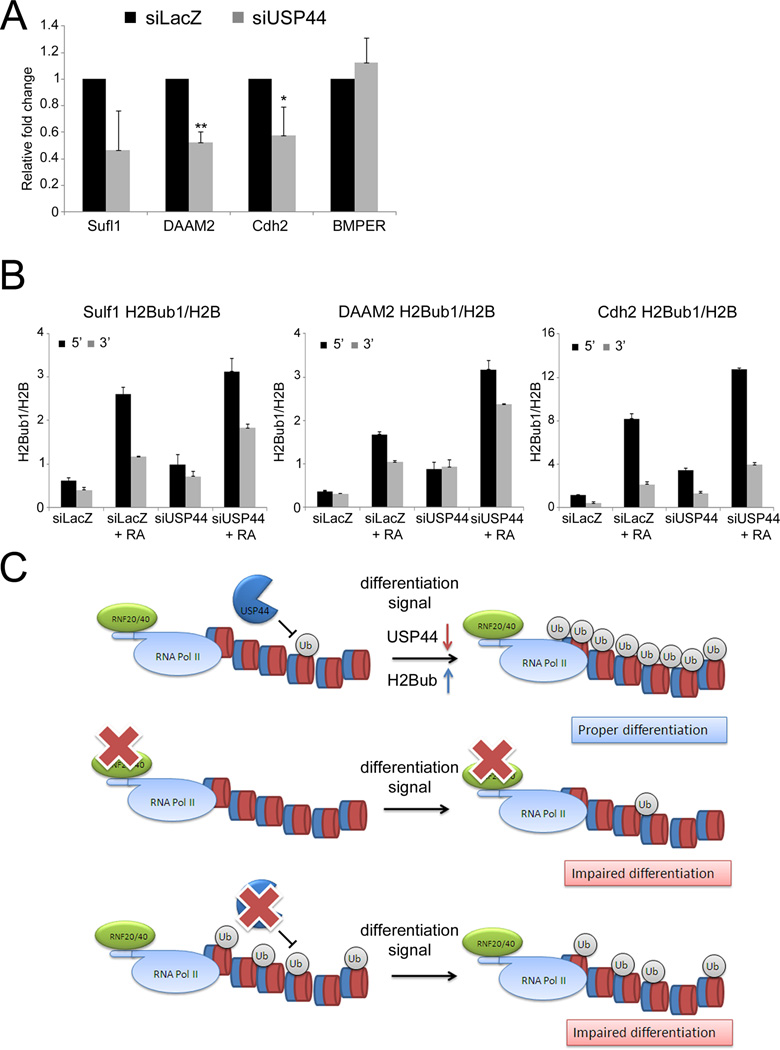
Embryonic stem cells (ESCs) maintain high genomic plasticity, which is essential for their capacity to enter diverse differentiation pathways. Posttranscriptional modifications of chromatin histones play a pivotal role in maintaining this plasticity. We now report that one such modification, monoubiquitylation of histone H2B on lysine 120 (H2Bub1), catalyzed by the E3 ligase RNF20, increases during ESC differentiation and is required for efficient execution of this process. This increase is particularly important for the transcriptional induction of relatively long genes during ESC differentiation. Furthermore, we identify the deubiquitinase USP44 as a negative regulator of H2B ubiquitylation, whose downregulation during ESC differentiation contributes to the increase in H2Bub1. Our findings suggest that optimal ESC differentiation requires dynamic changes in H2B ubiquitylation patterns, which must occur in a timely and well-coordinated manner.


Figures

Figure 1
Figure 1. Histone H2B is monoubiquitylated during embryonic stem cell differentiation
(A) R11 mouse embryonic stem cells (mESC) were harvested at the indicated time points after transfer to defined N2B27 differentiation medium, followed by Western blot analysis. Numbers at the bottom were generated by quantification (ImageJ) of the H2Bub1 signal normalized to the H2B signal. (B) CGR8 mESC were differentiated to keratinocytes as described under Experimental Procedures. Cells were harvested at the indicated time points for Western blot analysis. Quantification was as in (A). (C) Human embryonic stem cells (hESC) were transferred to defined N2B27 differentiation medium, supplemented with EGF and FGF, and treated with retinoic acid (RA, +) or DMSO (−). Cells were harvested 8 days later for Western blot analysis. Quantification was as in (A). (D) NT2 cells were treated with retinoic acid (RA, +) or DMSO (−) for 48 or 72 hr. Cell extracts were subjected to Western blot analysis with the indicated antibodies. Quantification was as in (A). See also Fig. S1A,B,C,D for parallel qRT-PCR analysis, Fig. S1E for H2Aub1 and H3K4me3 analysis, and Fig. S1F,G for cell cycle characterization of NT2 cells.
Figure 2
Figure 2. RNF20 is necessary for optimal neuronal differentiation of NT2 and embryonic stem cells
(A) NT2 cells were transfected with siRNA oligonucleotides (SMARTpool) directed against RNF20 (siRNF20) or against LacZ (siLacZ) as control, and 24 hr later treated with either retinoic acid (RA) or DMSO (−). Following 72 hours of RA treatment, cultures were harvested for Western blot analysis. (B) Cells were treated as in (A). Expression of the indicated genes was quantified by qRT-PCR. All values were normalized to GAPDH mRNA in the same sample. Average relative fold change was calculated from three separate experiments. For each gene, the RA-induced fold change upon RNF20 depletion was normalized to the RA-induced fold change in the control (siLacZ), which was defined as 1.0. * p-value < 0.05. ** p-value < 0.01. See also Fig. S2A for raw values and Fig. S2B for RNF20 depletion with single oligonucleotides. (C) R1 mESC were stably transfected with non-targeting shRNA plasmid (con) or with RNF20 shRNA plasmid (RNF20). Drug-resistant clones were isolated and validated for the expected pattern of RNF20 expression. Cultures were treated with retinoic acid (RA) for 4 days and harvested for Western blot analysis with the indicated antibodies. (D) RNA was extracted from cultures treated as in (C). Expression of the indicated genes was quantified by qRT-PCR. All values were normalized to GAPDH mRNA in the same sample. Bars indicate averages of data from duplicate qPCR reactions; error bars represent standard deviation. Similar data was obtained in three independent experiments. See also Fig. S2C for shRNF20 mESC morphology. (E) Cells were treated as in (A) and subjected to chromatin immunoprecipitation (ChIP) analysis with antibodies specific for H2B and H2Bub1. Immunoprecipitated DNA was quantified by qPCR with primers specific for the 5’ transcribed regions of the indicated genes. Bars indicate H2Bub1 ChIP readings normalized to H2B in the same treatment, and represent averages from duplicate qPCR reactions; error bars represent standard deviation. Similar results were obtained in three independent experiments. (F) Cells were treated as in (A), and subjected to ChIP analysis with RNF20 antibody. Immunoprecipitated DNA and input DNA were quantified by qPCR with primers specific for the 5’ transcribed regions of the indicated genes. Results are average of three separate experiments. (G) NT2 cells were transfected with siRNA oligonucleotides directed against RNF20 (siRNF20) or against LacZ (siLacZ) as control, and 24 hr later were treated either with retinoic acid (RA) or DMSO (con). Following 96 hr of RA treatment, surface levels of the neuronal cell antigen A2B5 were quantified by FACS analysis.
Figure 3
Figure 3. Induction of long genes is selectively affected by RNF20 depletion
(A) NT2 cells were transfected with siRNA oligonucleotides (SMARTpool) directed against RNF20 (R) or LacZ (L) as control, and 24 hr later were treated either with retinoic acid (RA) or DMSO (−). Following 72 hr of RA treatment, RNA was extracted and subjected to expression microarray analysis. The heat-map depicts the expression patterns of the genes whose abundance was significantly upregulated or downregulated (see Supplemental Methods) following addition of RA. For each row (gene) the log-expression values were centered (mean 0) and normalized (STD = 1). Red and blue colors indicate increased and decreased expression, respectively (relative to the mean value of a gene). (B) Empirical probability density functions of the lengths (longest known coding transcripts) of genes in the “RNF20-dependent” group (solid line, median = 86Kb) and “RNF20-independent” group (dashed line, median = 43Kb). The assignment of genes to each group is described in Supplemental Methods P-value was calculated using Rank Sum test, rejecting the null hypothesis that the two groups have equal medians. (C) A Spearman correlation coefficient of 0.27 was found between the length of the longest coding transcript of each gene and the ratio between FC1 and FC2. FC1 was defined as fold change in RA-treated relative to DMSO treated control cells (siLacZ+RA/siLacZ+DMSO), while FC2 denotes fold change in RNF20-depleted cells (siRNF20+RA/siRNF20+DMSO). Each point represents a gene with significant induction by RA in the control cells. (D) Cells were treated as in (A). Mature mRNA and pre-mRNA were analyzed by qRT-PCR employing exon-exon junction primers or intronic primers, respectively. Values were generated as in Fig. 2B, based on three separate experiments. * p-value < 0.05. ** p-value < 0.01. (E) Cells were treated as in (A) and subjected to ChIP analysis as in Fig. 2C. Immunoprecipitated DNA was quantified by qPCR with primers specific for either the 5‘ or 3‘ transcribed regions of the indicated genes. Bars indicate averages of data from duplicate qPCR reactions; error bars represent standard deviation. Similar results were obtained in three independent experiments. See also Fig. S3A for H3K36me3 ChIP, Fig. S3B for RNF20-independent genes H2Bub1 ChIP, Fig. S3C for RNF20 ChIP, Fig. S3D,E for basal expression analysis, and Fig. S4A,B for the effect of WAC depletion on NT2 differentiation.
Figure 4
Figure 4. USP44 is downregulated during differentiation to promote H2B ubiquitylation
(A) qRT-PCR analysis of USP44 mRNA during differentiation. Left: NT2 treated with RA for 72 hr. Middle: hESC treated with RA for 8 days. Right: mESC differentiated to keratinocytes for 7 or 14 days. Levels in undifferentiated cells were set as 1. For NT2 and hESC, values were normalized to β-ACTIN mRNA in the same sample; for mESC, normalization was for 36B4 mRNA. Bars indicate averages from duplicate qPCR reactions; error bars represent standard deviation. (B) HeLa cells were transfected with control empty vector (Vec) or Myc-USP44 expression plasmid. Cells were harvested 48 hr later. Chromatin-bound and unbound proteins were separated and subjected to Western blot analysis. (C) NT2 cells were transfected with siRNA oligonucleotides (SMARTpool) directed against USP44 (siUSP44) or siLacZ as control and harvested 72 hr later for Western blot analysis. Right panel: quantification (ImageJ) of the H2Bub1 signal normalized to the H2B signal, averaged from three independent experiments. The H2Bub1/H2B signal in the siLacZ sample of each experiment was set as 1. * p-value < 0.05. (D) HeLa cells were transfected with either control empty vector (Vec), Myc-tagged USP44 (Myc-USP44 WT) or catalytically inactive Myc-tagged USP44 (Myc-USP44 CI). Cells were harvested 72 hr later and subjected to Western blot analysis. Right panel: quantification as in (C), averaged from three independent experiments; the H2Bub1/H2B value in the empty vector control (Vec) of each experiment was set as 1. ** p-value < 0.01. See also Fig. S5A,B,C for subcellular localization of RNF20 and interaction with RNF40 during differentiation, and Fig. S5D,E,F,G for the effect of siUSP3, siUSP16, siUSP22 and siUSP44 on H2Bub1.
Figure 5
Figure 5. USP44 depletion impairs differentiation
(A) NT2 cells were transfected with siRNA oligos directed against US44 (siUSP44) or siLacZ as control. 24 hr later, retinoic acid (RA) or DMSO (−) was added for an additional 48 hr, followed by extraction and Western blot analysis. Right panel: quantification of relative H2Bub signal, done as in Fig. 4C. * p-value < 0.05. (B) NT2 cells were transfected and treated as in (A). RNA was extracted and analyzed by qRT-PCR with the indicated primers. Values were calculated as in Fig. 2B, averaging from three separate experiments. * p-value < 0.05. ** p-value < 0.01. See also Fig. S6 for raw values. (C) Cells transfected as in (A) were treated with RA or DMSO for 72 hr and subjected to ChIP analysis as in Fig. 2C. Similar results were obtained in three independent experiments. (D) NT2 cells were transfected with siRNA oligonucleotides directed against USP44 (siUSP44) or against LacZ (siLacZ) as control. 24 hr later, cultures were treated with either retinoic acid (RA) or DMSO (con) for an additional 96 hr, and subjected to FACS analysis of surface A2B5 as in Fig. 2E.
Figure 6
Figure 6. USP44 depletion compromises the induction of RNF20-dependent genes
(A) NT2 cells were transfected with siRNA oligos directed against USP44 (siUSP44) or siLacZ as control and 24 hr later were treated for 72 hr with either retinoic acid (RA) or DMSO. RNA was extracted and analyzed by qRT-PCR with the indicated primers, and relative fold change upon RA treatment was calculated as in Fig. 2B, averaging from three separate experiments. * p-value < 0.05. ** p-value < 0.01. (B) Cells treated as in (A) were subjected to ChIP analysis as in Fig. 3E. Similar results were obtained in three independent experiments. (C) Proposed model for regulation of H2Bub1 during ESC differentiation. Upper panel: in the undifferentiated state, USP44 is highly expressed and maintains low levels of H2Bub. Differentiation signals decrease USP44 levels, increasing H2Bub1 to enable efficient differentiation. Middle: RNF20 depletion abolishes the increase in H2Bub1, impairing differentiation. Lower: USP44 depletion prior to the differentiation signal increases H2Bub1 levels; however, the dynamic turnover of H2Bub1 is impaired, disabling proper execution of the differentiation program.

References

    1. Andrews PW. Human teratocarcinomas. Biochim Biophys Acta. 1988;948:17–36. - PubMed
    1. Ang YS, Gaspar-Maia A, Lemischka IR, Bernstein E. Stem cells and reprogramming: breaking the epigenetic barrier? Trends Pharmacol Sci. 2011;32:394–401. - PMC - PubMed
    1. Azuara V, Perry P, Sauer S, Spivakov M, Jorgensen HF, John RM, Gouti M, Casanova M, Warnes G, Merkenschlager M, Fisher AG. Chromatin signatures of pluripotent cell lines. Nat Cell Biol. 2006;8:532–538. - PubMed
    1. Ballman KV, Grill DE, Oberg AL, Therneau TM. Faster cyclic loess: normalizing RNA arrays via linear models. Bioinformatics. 2004;20:2778–2786. - PubMed
    1. Bernstein BE, Mikkelsen TS, Xie X, Kamal M, Huebert DJ, Cuff J, Fry B, Meissner A, Wernig M, Plath K, et al. A bivalent chromatin structure marks key developmental genes in embryonic stem cells. Cell. 2006;125:315–326. - PubMed

Publication types

Associated data