Comparative Study
. 2012 Jun 6;20(6):957-66.
doi: 10.1016/j.str.2012.04.020.

Improving the accuracy of macromolecular structure refinement at 7 Å resolution

Affiliations
Comparative Study

Improving the accuracy of macromolecular structure refinement at 7 Å resolution

Axel T Brunger et al. Structure. .

Abstract

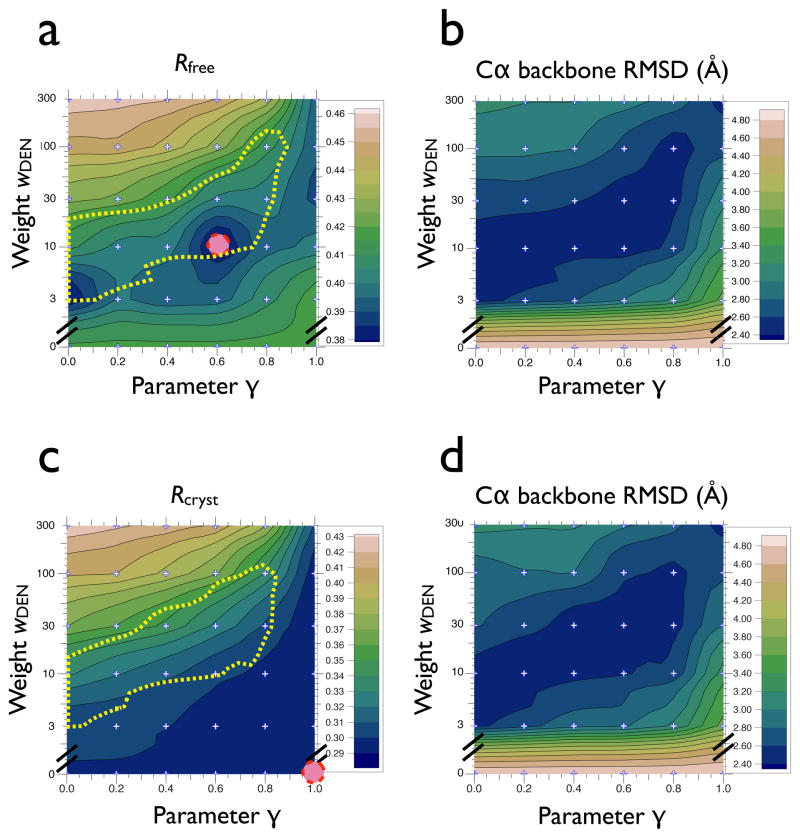
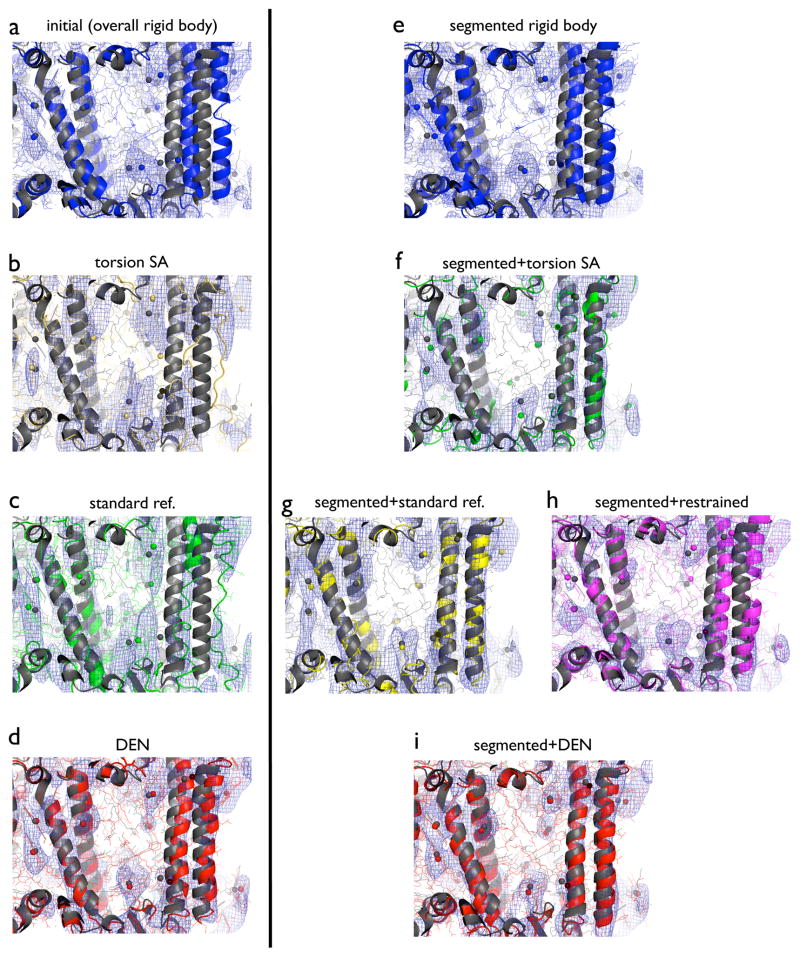
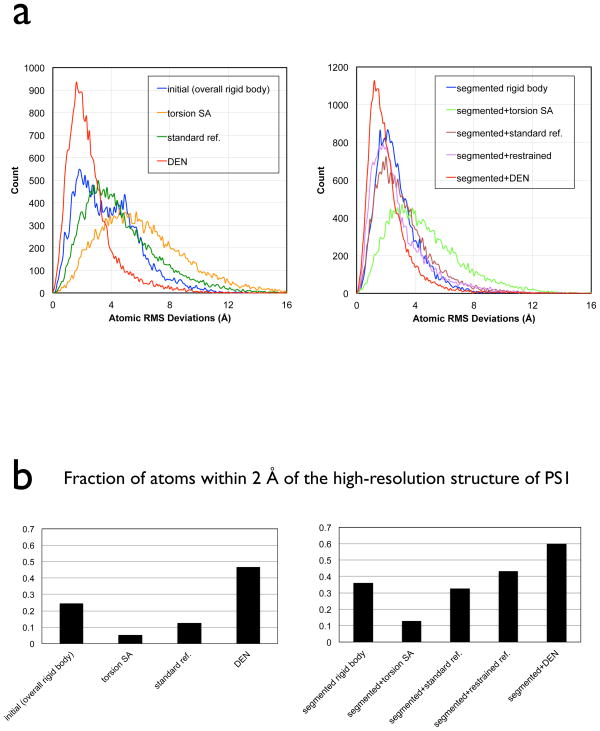
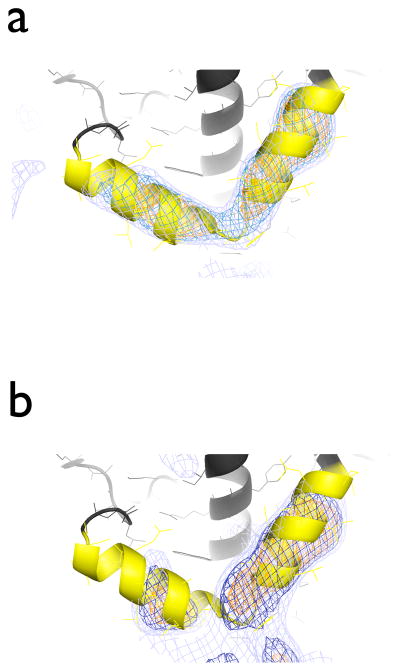
In X-ray crystallography, molecular replacement and subsequent refinement is challenging at low resolution. We compared refinement methods using synchrotron diffraction data of photosystem I at 7.4 Å resolution, starting from different initial models with increasing deviations from the known high-resolution structure. Standard refinement spoiled the initial models, moving them further away from the true structure and leading to high R(free)-values. In contrast, DEN refinement improved even the most distant starting model as judged by R(free), atomic root-mean-square differences to the true structure, significance of features not included in the initial model, and connectivity of electron density. The best protocol was DEN refinement with initial segmented rigid-body refinement. For the most distant initial model, the fraction of atoms within 2 Å of the true structure improved from 24% to 60%. We also found a significant correlation between R(free) values and the accuracy of the model, suggesting that R(free) is useful even at low resolution.


Figures

Figure 1
Figure 1
Rfree and corresponding RMSD to the 2.5 Å structure of PSI (PDB ID 1jb0) for DEN refinements that were performed against the 7.4 Å diffraction data of PSI, starting from model M6 with initial segmented rigid-body refinement (denoted “ M6+seg” in Fig. S2). Panel (a) shows the lowest Rfree value for each parameter pair (γ, wDEN) among 20 repeats; for each parameter pair we performed 20 repeats of the DEN refinement protocol described in Experimental Procedures. The temperature of the slow-cooling simulated annealing scheme was 3000 K. The Rfree value is contoured using values calculated on a 6 × 6 grid (marked by small ‘+’ signs) where the parameter γ was [0.0, 0.2, 0.4, 0.6, 0.8, 1.0] and wDEN was [0, 3, 10, 30, 100, 300]; the results for wDEN = 0 (i.e., torsion angle refinement without DEN restraints) are independent of γ, so the same value was used for all grid points with wDEN = 0. The contour plot shows minima in the range 30 ≥ wDEN ≥ 3; the absolute minimum is at wDEN = 10, γ = 0.6 (dashed circle), corresponding to an Rfree value of 0.38. In contrast, the lowest Rfree value for refinement without DEN restraints (wDEN = 0) is only 0.42. The yellow dashed line indicates the region of DEN-refined models with the smallest Cα backbone RMSD to the 2.5 Å structure of PSI. Panel (b) shows the Cα backbone RMSD between the refinement repeat that produced the lowest Rfree value and the 2.5 Å structure of PSI for each of the parameter pairs (γ, wDEN). Note the large RMSD for refinements without DEN restraints (wDEN = 0). Panel (c) shows the lowest Rcryst value for each of the parameter pairs (γ, wDEN) among 20 repeats; the absolute minimum is at wDEN = 0, γ = 1 (dashed circle). The yellow dashed line indicates the region of DEN-refined models with the smallest Cα backbone RMSD to the 2.5 Å structure of PSI. Panel (d) shows the Cα backbone RMSD between the refinement repeat that produced the lowest Rcryst value and the 2.5 Å structure of PSI for each of the parameter pairs (γ, wDEN). Rcryst and the Cα backbone RMSD are approximately anti-correlated. See also Figure S1 and Table S1.
Figure 2
Figure 2
Models and corresponding m2Fo-DFc electron density maps for specified refinements against the 7.4 Å diffraction data of PSI, starting from model M6. The electron density maps (blue mesh) were calculated with phases from the corresponding refined model and contoured at 1.5 σ. The 2.5 Å structure of PSI (PDB ID 1jb0) is shown in dark gray in each of the panels. Spheres indicate Mg2+ ions at the center of the chlorin rings. All non-hydrogen atoms are shown (lines) along with a cartoon representation. The region shown in the figure includes four α-helices (residues 54–100, 155–181, 669–694, and 720–750 of chain A) along with their protein environment and associated co-factors. (a) Initial, overall rigid-body refined model (blue). (b) Model obtained by torsion angle simulated annealing (yellow). (c) Model obtained by standard refinement (green). (d) Model obtained by DEN refinement (red). (e) Model obtained by segmented rigid-body refinement (blue). (f) Model obtained by torsion angle simulated annealing with initial segmented rigid-body refinement (green). (g) Model obtained by standard refinement with initial segmented rigid-body refinement (yellow). (h) Model obtained by refinement with secondary structure and reference restraints with phenix.refine with initial segmented rigid-body refinement (magenta). (i) Model obtained by DEN refinement with initial segmented rigid-body refinement (red). Refinement protocols are described in Experimental Procedures. See also Figure S2.
Figure 3
Figure 3
Individual atomic RMS deviations to the 2.5 Å structure of PSI (PDB ID 1jb0) for specified refinements against the 7.4 Å diffraction data of PSI, starting from the model M6. (a) Histogram of individual atomic RMS deviations between the model refined by the specified method and the 2.5 Å structure of PSI. (b) Fraction of atoms that show RMS deviations less than 2 Å from the 2.5 Å structure of PSI. See also Figure S3.
Figure 4
Figure 4
(a) Omit DEN refinement against the 7.4 Å diffraction data of PSI. The initial model was model M1, i.e., the 2.5 Å structure of PSI (PDB ID 1jb0), with a pair of α-helices omitted (chain F, residues 103:126). Shown are mFo-DFc electron density maps at 3 σ (orange), 2.5 σ (blue), and 2 σ (light blue). Note that these two α-helices are located at the detergent-exposed periphery of the PSI complex. (b) DEN refinement with initial segmented rigid body refinement starting from model M6, with the same α-helix pair omitted, against the 7.4 Å diffraction data of PSI. Shown are mFo-DFc electron density maps at 3 σ (orange), 2.5 σ (blue), and 2 σ (light blue).

References

    1. Adams PD, Afonine PV, Bunkoczi G, Chen VB, Davis IW, Echols N, Headd JJ, Hung LW, Kapral GJ, Grosse-Kunstleve RW, et al. PHENIX: a comprehensive Python-based system for macromolecular structure solution. Acta Crystallogr D Biol Crystallogr. 2010;66:213–221. - PMC - PubMed
    1. Afonine PV, Grosse Kunstleve RW, Echols N, Headd JJ, Moriarty NW, Mustyakimov M, Terwilliger TC, Urzhumtsev A, Zwart PH, Adams PD. Towards automated crystallographic structure refinement with phenix.refine. Acta Cryst. 2012;D68:352–367. - PMC - PubMed
    1. Brunger AT. Free R value: a novel statistical quantity for assessing the accuracy of crystal structures. Nature. 1992;355:472–475. - PubMed
    1. Brunger AT. Free R value: cross-validation in crystallography. Methods Enzymol. 1997;277:366–396. - PubMed
    1. Brunger AT, Adams PD, Clore GM, DeLano WL, Gros P, Grosse-Kunstleve RW, Jiang JS, Kuszewski J, Nilges M, Pannu NS, et al. Crystallography & NMR system: A new software suite for macromolecular structure determination. Acta Crystallogr D Biol Crystallogr. 1998;54:905–921. - PubMed

Publication types

MeSH terms

Substances

Associated data

LinkOut - more resources