

Multi-scale data-driven modeling and observation of calcium puffs
- PMID: 22682010
- PMCID: PMC3560535
- DOI: 10.1016/j.ceca.2012.04.018
Multi-scale data-driven modeling and observation of calcium puffs
Abstract
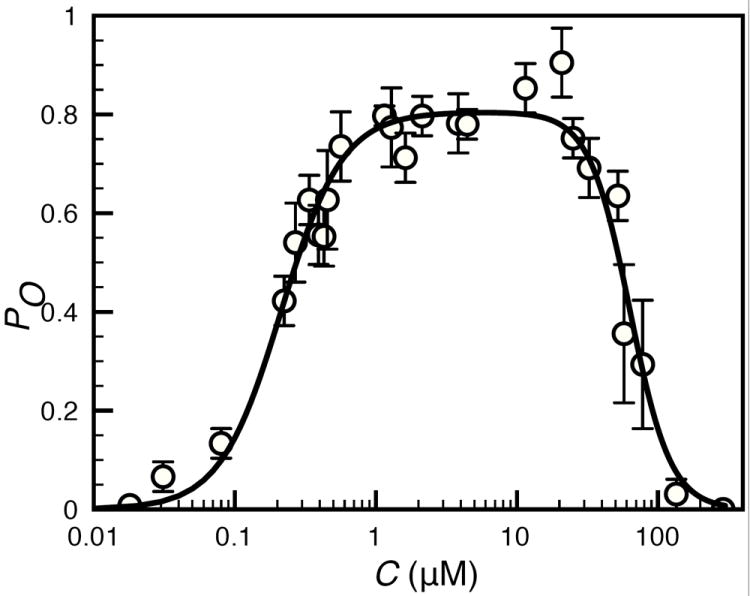
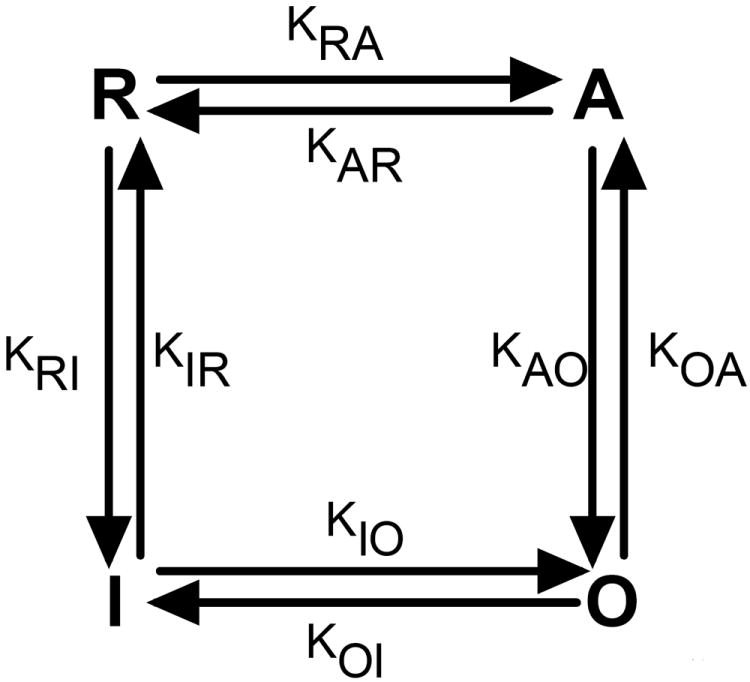
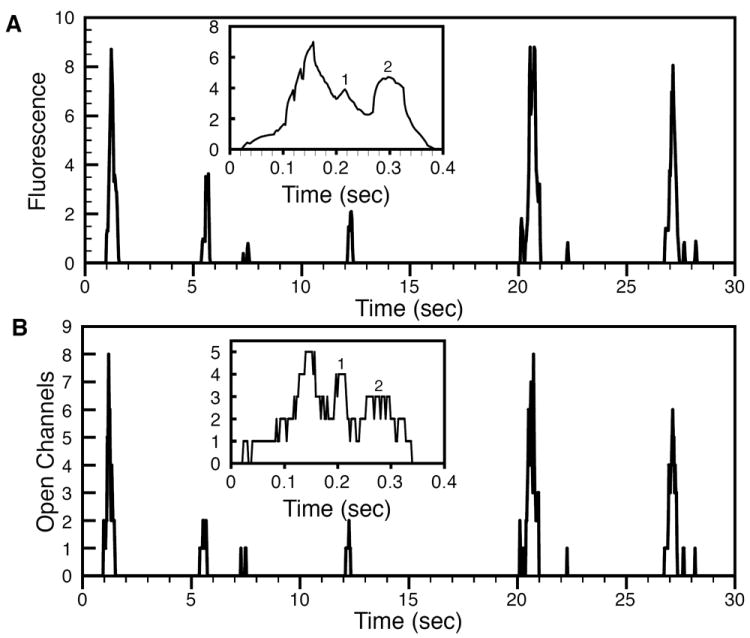
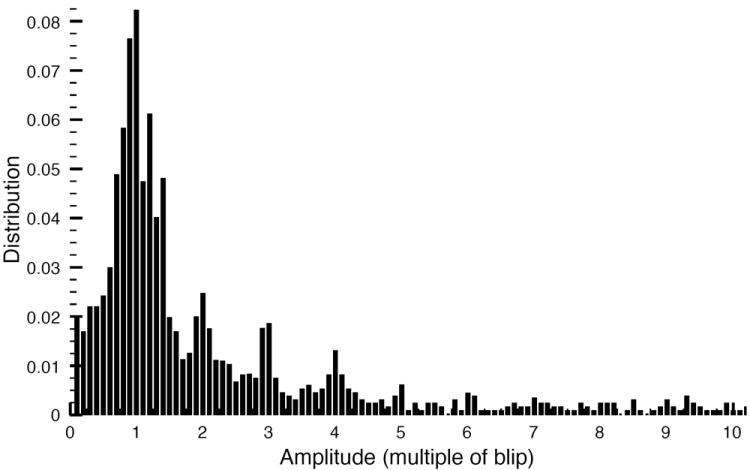
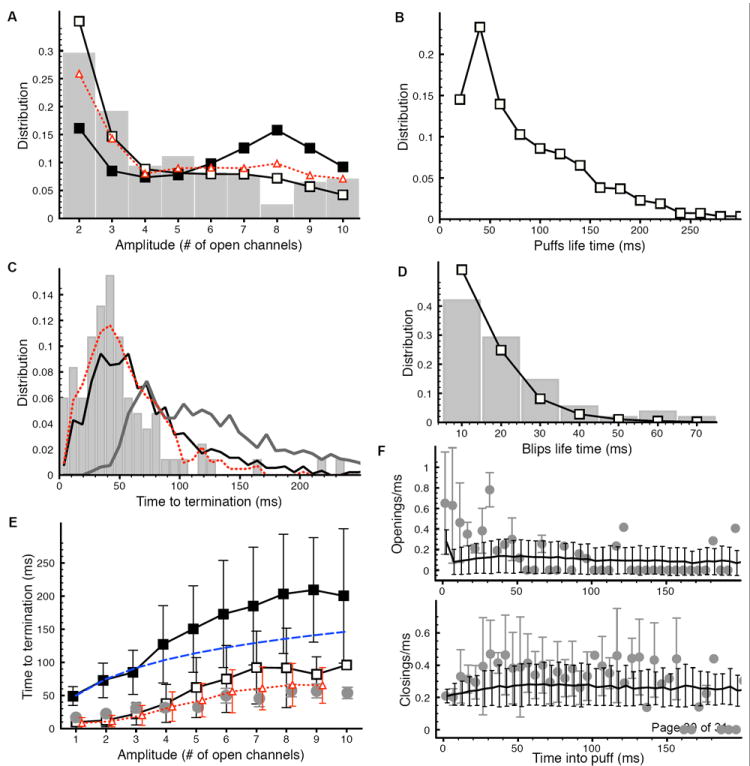
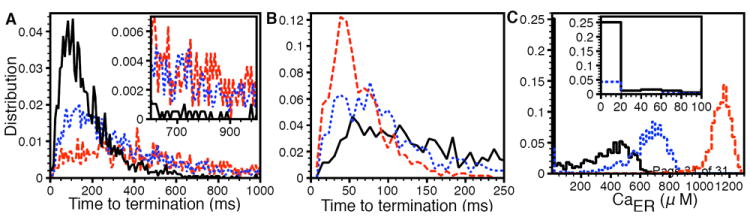
The spatiotemporal dynamics of elementary Ca(2+) release events, such as "blips" and "puffs" shapes the hierarchal Ca(2+) signaling in many cell types. Despite being the building blocks of Ca(2+) patterning, the mechanism responsible for the observed properties of puffs, especially their termination is incompletely understood. In this paper, we employ a data-driven approach to gain insights into the complex dynamics of blips and puffs. We use a model of inositol 1,4,5-trisphosphate (IP(3)) receptor (IP(3)R) derived directly from single channel patch clamp data taken at 10 μM concentration of IP(3) to simulate calcium puffs. We first reproduce recent observations regarding puffs and blips and then investigate the mechanism of puff termination. Our model suggests that during a puff, IP(3)R s proceed around a loop through kinetic states from "rest" to "open" to "inhibited" and back to "rest". A puff terminates because of self-inhibition. Based on our simulations, we rule out the endoplasmic reticulum (ER) Ca(2+) depletion as a possible cause for puff termination. The data-driven approach also enables us to estimate the current through a single IP(3)R and the peak Ca(2+) concentration near the channel pore.
Published by Elsevier India Pvt Ltd.
Figures
Similar articles
-
'Trigger' events precede calcium puffs in Xenopus oocytes.Biophys J. 2006 Dec 1;91(11):4024-32. doi: 10.1529/biophysj.106.088872. Epub 2006 Sep 15. Biophys J. 2006. PMID: 16980363 Free PMC article.
-
Inositol (1,4,5)-trisphosphate receptor microarchitecture shapes Ca2+ puff kinetics.Biophys J. 2011 Feb 16;100(4):822-31. doi: 10.1016/j.bpj.2011.01.003. Biophys J. 2011. PMID: 21320425 Free PMC article.
-
The probability of triggering calcium puffs is linearly related to the number of inositol trisphosphate receptors in a cluster.Biophys J. 2012 Apr 18;102(8):1826-36. doi: 10.1016/j.bpj.2012.03.029. Biophys J. 2012. PMID: 22768938 Free PMC article.
-
Ca(2+) signalling by IP(3) receptors.Subcell Biochem. 2012;59:1-34. doi: 10.1007/978-94-007-3015-1_1. Subcell Biochem. 2012. PMID: 22374086 Review.
-
Inositol 1,4,5-trisphosphate receptors in the endoplasmic reticulum: A single-channel point of view.Cell Calcium. 2015 Jul;58(1):67-78. doi: 10.1016/j.ceca.2014.12.008. Epub 2014 Dec 18. Cell Calcium. 2015. PMID: 25555684 Free PMC article. Review.
Cited by
-
TraceSpecks: A Software for Automated Idealization of Noisy Patch-Clamp and Imaging Data.Biophys J. 2018 Jul 3;115(1):9-21. doi: 10.1016/j.bpj.2018.06.003. Biophys J. 2018. PMID: 29972815 Free PMC article.
-
Towards the Physics of Calcium Signalling in Plants.Plants (Basel). 2013 Sep 27;2(4):541-88. doi: 10.3390/plants2040541. Plants (Basel). 2013. PMID: 27137393 Free PMC article. Review.
-
Maternal high-altitude hypoxia and suppression of ryanodine receptor-mediated Ca2+ sparks in fetal sheep pulmonary arterial myocytes.Am J Physiol Lung Cell Mol Physiol. 2012 Nov 1;303(9):L799-813. doi: 10.1152/ajplung.00009.2012. Epub 2012 Sep 7. Am J Physiol Lung Cell Mol Physiol. 2012. PMID: 22962012 Free PMC article.
-
Cytosolic [Ca2+] regulation of InsP3-evoked puffs.Biochem J. 2013 Jan 1;449(1):167-73. doi: 10.1042/BJ20121271. Biochem J. 2013. PMID: 23035871 Free PMC article.
-
Modulation of elementary calcium release mediates a transition from puffs to waves in an IP3R cluster model.PLoS Comput Biol. 2015 Jan 8;11(1):e1003965. doi: 10.1371/journal.pcbi.1003965. eCollection 2015 Jan. PLoS Comput Biol. 2015. PMID: 25569772 Free PMC article.
References
-
- Cheng H, Lederer WJ. Ca2+ Sparks. Physiol Rev. 2008;88:1491–1545. - PubMed
Publication types
MeSH terms
Substances
Grants and funding
LinkOut - more resources
Full Text Sources
Miscellaneous
