

Impact of inherent variability and experimental parameters on the reliability of small animal PET data
- PMID: 22682020
- PMCID: PMC3438085
- DOI: 10.1186/2191-219X-2-26
Impact of inherent variability and experimental parameters on the reliability of small animal PET data
Abstract
Background: Noninvasive preclinical imaging methodologies such as small animal positron emission tomography (PET) allow the repeated measurement of the same subject which is generally assumed to reduce the variability of the experimental outcome parameter and to produce more robust results. In this study, the variability of tracer uptake in the rodent brain was assessed within and between subjects using the established radiopharmaceuticals 18F-FDG and 18F-fallypride. Moreover, experimental factors with potential impact on study outcome were elicited, and the effect of their strict homogenization was assessed.
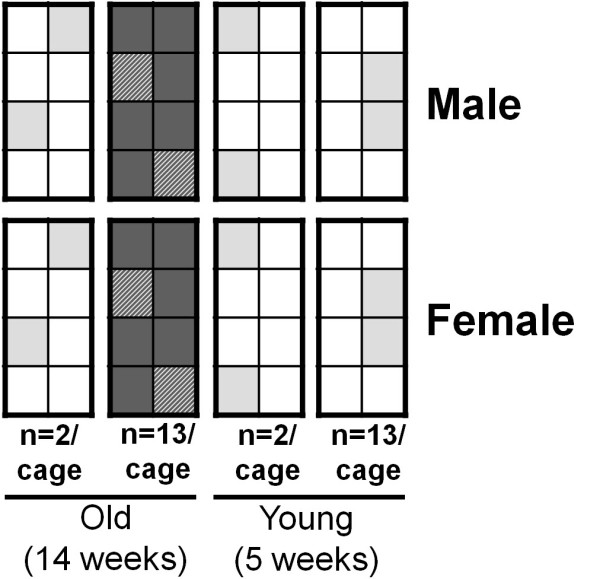
Methods: Brain standardized uptake values of rodents were compared between three PET scans of the same animal and scans of different individuals. 18F-FDG ex vivo tissue sampling was performed under variation of the following experimental parameters: gender, age, cage occupancy, anesthetic protocol, environmental temperature during uptake phase, and tracer formulation.
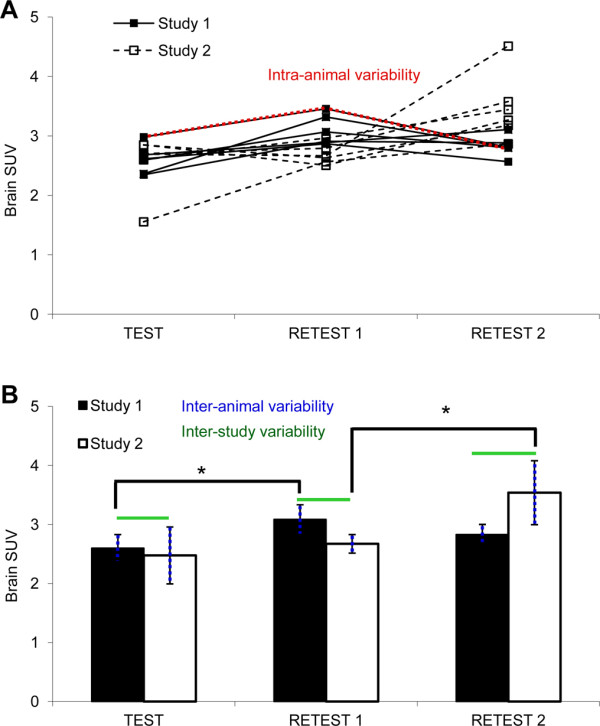
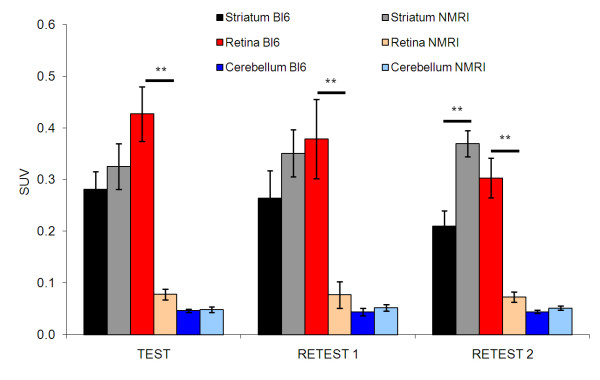
Results: No significant difference of variability in 18F-FDG or 18F-fallypride brain or striatal uptake was identified between scans of the same and scans of different animals (COV = 14 ± 7% vs. 21 ± 10% for 18F-FDG). 18F-FDG brain uptake was robust regarding a variety of experimental parameters; only anesthetic protocols showed a significant impact. In contrast to a heterogenization approach, homogenization of groups produced more false positive effects in 18F-FDG organ distribution showing a false positive rate of 9% vs. 6%.
Conclusions: Repeated measurements of the same animal may not reduce data variability compared with measurements on different animals. Controlled heterogenization of test groups with regard to experimental parameters is advisable as it decreases the generation of false positive results and thus increases external validity of study outcome.
Figures
References
-
- Cherry SR. Of mice and men (and positrons) – advances in PET imaging technology. J Nucl Med. 2006;47:1735–1745. - PubMed
-
- Cherry SR, Gambhir SS. Use of positron emission tomography in animal research. ILAR J. 2001;42:219–232. - PubMed
-
- Van Zutphen LFM, Baumans V, Beynen AC. Grundlagen der Versuchstierkunde. Gustav Fischer Verlag, Stuttgart; 1995.
LinkOut - more resources
Full Text Sources
