. 2012 Jun 6;15(6):813-26.
doi: 10.1016/j.cmet.2012.04.023.

The sedoheptulose kinase CARKL directs macrophage polarization through control of glucose metabolism

Affiliations

The sedoheptulose kinase CARKL directs macrophage polarization through control of glucose metabolism

Arvand Haschemi et al. Cell Metab. .

Abstract

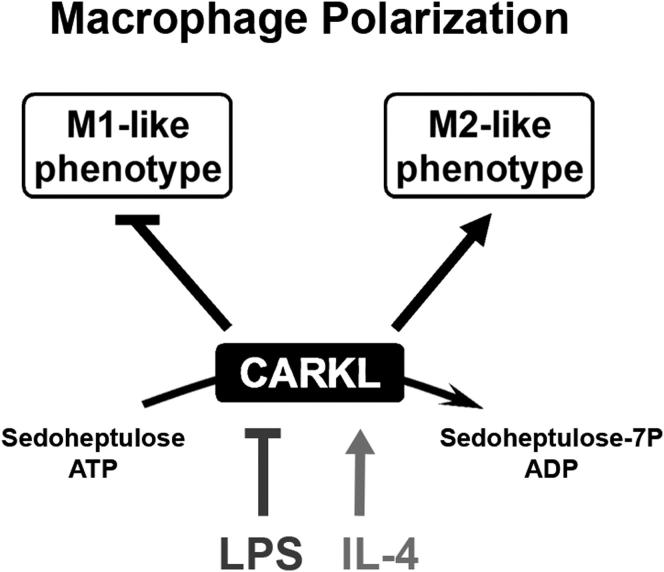
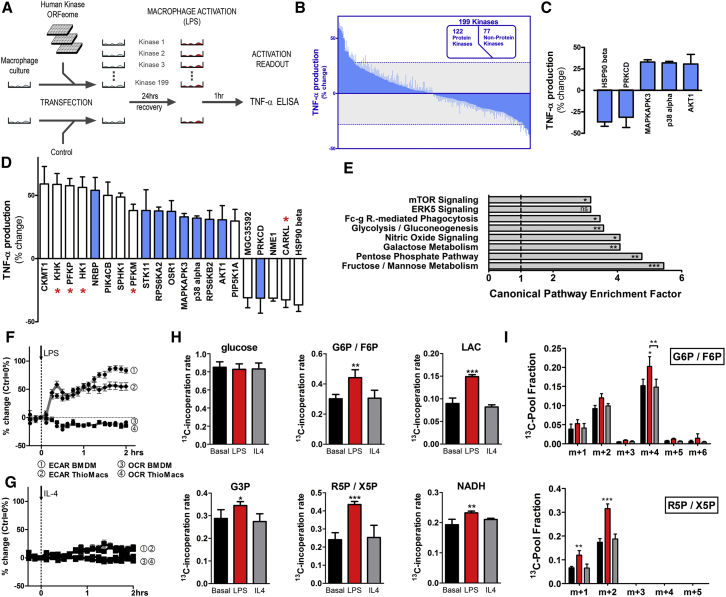
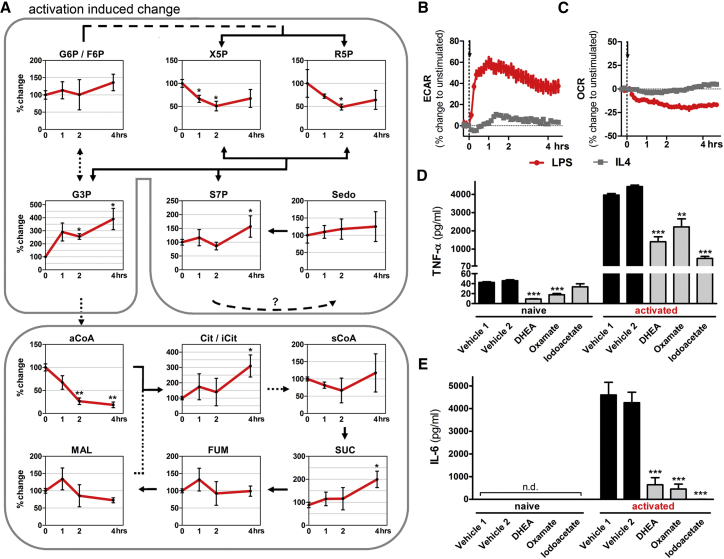
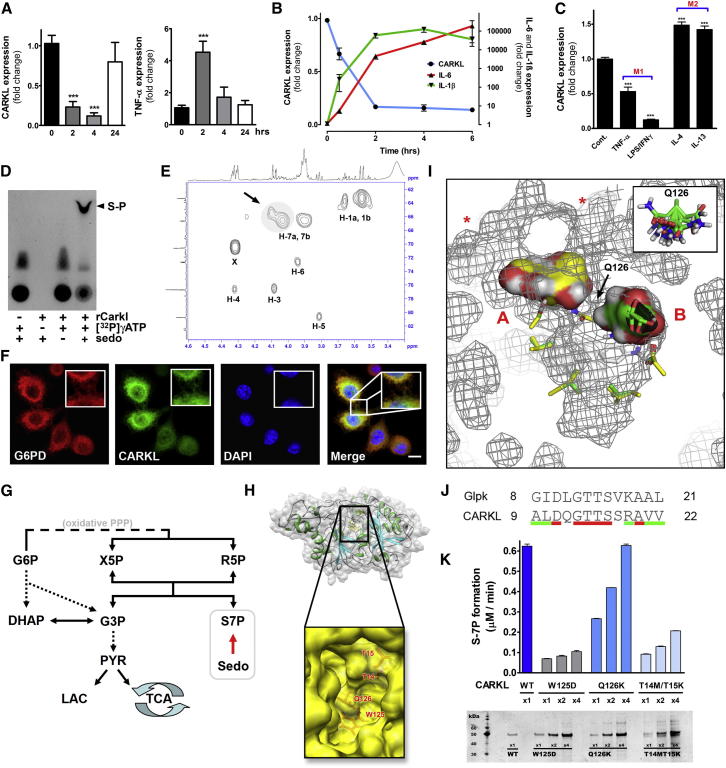
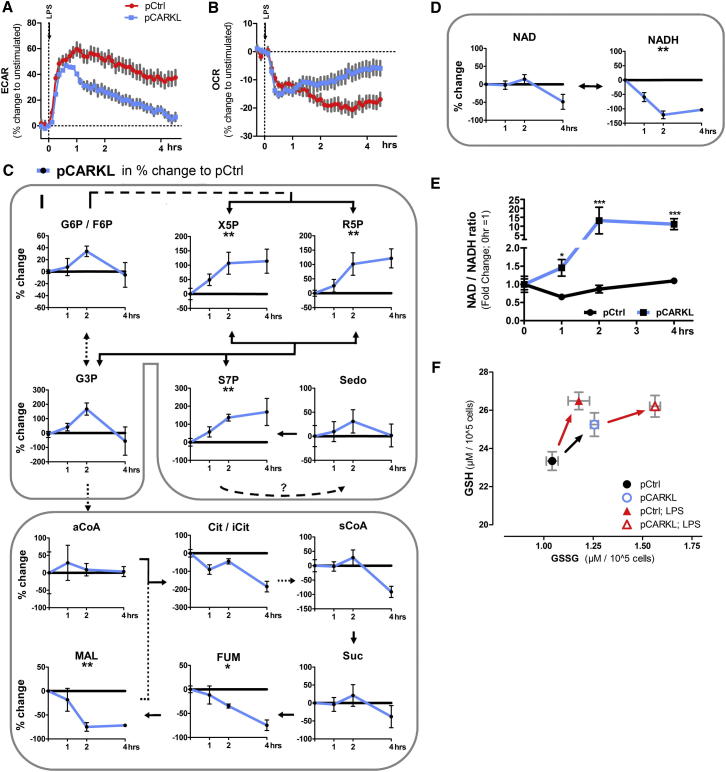
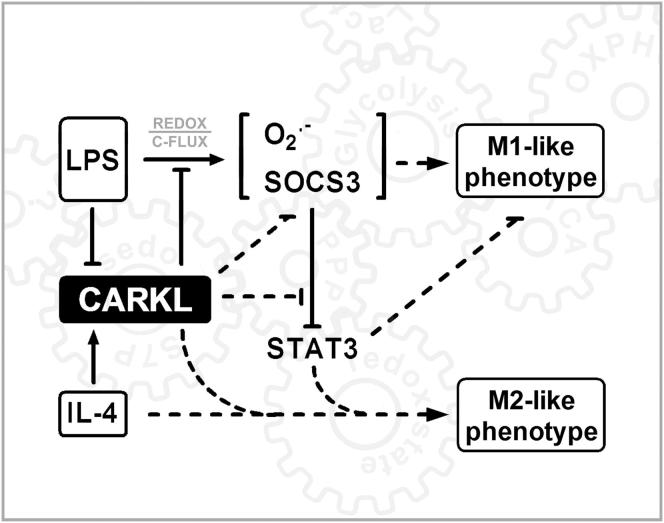
Immune cells are somewhat unique in that activation responses can alter quantitative phenotypes upwards of 100,000-fold. To date little is known about the metabolic adaptations necessary to mount such dramatic phenotypic shifts. Screening for novel regulators of macrophage activation, we found nonprotein kinases of glucose metabolism among the most enriched classes of candidate immune modulators. We find that one of these, the carbohydrate kinase-like protein CARKL, is rapidly downregulated in vitro and in vivo upon LPS stimulation in both mice and humans. Interestingly, CARKL catalyzes an orphan reaction in the pentose phosphate pathway, refocusing cellular metabolism to a high-redox state upon physiological or artificial downregulation. We find that CARKL-dependent metabolic reprogramming is required for proper M1- and M2-like macrophage polarization and uncover a rate-limiting requirement for appropriate glucose flux in macrophage polarization.


Figures

None
Graphical abstract
Figure 1
Figure 1
Kinase Screen Reveals Distinct Metabolic Adaptation in Activated Macrophages (A) Schematic of kinase screen. (B and C) (B) Kinome modulation of LPS-induced (100 ng/ml; 1 hr) TNFα production (mean change ± SD) in RAW264.7 cells, including (C) kinases with known immune regulatory functions. Dotted lines indicate screen cut-off. (D) 21 Kinases exceeded the screen cut-off. Blue bars represent protein kinases (PK) and white bars nonprotein kinases (NPK). Kinases involved in primary glucose metabolism are indicated by . (E) Enrichment analysis for Canonical Pathways. (F and G) (F) Bone marrow-derived or thioglycollate-elicited macrophages were stimulated with LPS (100 ng/ml) or (G) IL-4 (10 ng/ml), and ECAR and OCR were recorded. (H and I) Dynamic (nonstationary) metabolic flux anaylsis of LPS or IL-4 stimulated BMDM by incubation with 100% labeled 13C-1-2-glucose. For abbreviations, see text. (H) shows isotope incorporation rate (m+n/total/10 min; m+n is all 13C-labeled molecules irrespective of mass shift, and total is all labeled and unlabeled), and (I) shows isotope distribution; ± SD, n = 5; p < 0.05, ∗∗p < 0.01, ∗∗∗p < 0.001.
Figure 2
Figure 2
LPS-Induced Polarization in Macrophages Results in a Functional Metabolic Adaptation (A) Analysis of the initial M1-like activation phase by a steady-state metabolomic time-course in RAW264.7 empty vector control cells (pCtrl = 100%). In the metabolic-pathway illustration, solid lines represent direct metabolite synthesis, whereas dashed lines indicate multiple enzymatic steps. (B and C) (B) ECAR and (C) OCR recordings of RAW264.7 cells during LPS (100 ng/ml) or IL-4 (10 ng/ml) induced activation. (D and E) (D) TNF-α and (E) IL-6 cytokine production of RAW264.7 cells pretreated with dehydroepiandrosterone (DHEA, 200 μM), oxamate (40 mM), or iodoacetate (100 μM) 10 min before stimulation with 100 ng/ml LPS for 2 hr (TNF-α) or 6 hr (IL-6). All data represent mean ± SEM of at least three individual experiments; n.d. = not detected, p < 0.05, ∗∗p < 0.01, ∗∗∗p < 0.001.
Figure 3
Figure 3
Regulation, Function, and Structural Evaluation of CARKL (A) Human CARKL and TNFα mRNA levels in PBMCs from healthy volunteers administered i.v. LPS (2 ng/kg). (B) CARKL and cytokine mRNA expression in RAW264.7 cells incubated with LPS (100 ng/ml). (C) CARKL expression in thioglycollate-elicited peritoneal macrophage polarized to either the M1- or M2-like phenotype by stimulation with LPS (100 ng/ml) in combination with IFN (20 ng/ml) or by TNFα (25 ng/ml) for M1 and for M2 with IL-4 (20 ng/ml) or IL-13 (10 ng/ml) for 2 hr. Data represent mean ± SEM; p < 0.05, ∗∗p < 0.01, ∗∗∗p < 0.001. (D) Recombinant CARKL (rCARKL) formed sedoheptulose-phosphate (S-P) as shown by in vitro kinase assay with 32P labeled ATP resolved on thin layer chromatography. (E) 1H/13C HSQC spectrum of purified reaction product. X = residual HEPES buffer. (F) Confocal fluorescence imaging of macrophages expressing CARKL_eGFP (green). Nuclei were visualized by DAPI (blue), and for colocalization cells were stained for glucose-6-phosphate dehyrdogenase (G6PD) (red). Scale bar equals 5 μm. (G) Simplified scheme of glucose metabolism indicating the central position of CARKL functioning as sedoheptulose kinase. Glucose-6-phosphate (G6P), xylulose-5-phosphate (X5P), ribose-5-phosphate (R5P), dihydroxyacetone phosphate (DHAP), glyceraldehyde-3-phosphate (G3P), sedoheptulose-7-phosphate (S7P), sedoheptulose (Sedo), pyruvate (PYR), lactate (LAC), and tricarboxylic acid cycle (TCA). (H) Three-dimensional model for CARKL protein by comparative modeling. Insert shows opening of the central pocket. (I) A representative result of computational sedoheptulose docking to CARKL presented in a 3D mesh model where the central cleft is centered and surface accessibility sites are indicated by . AA Q126, defined as flexible AA, is depicted in the inset. (J) Amino acid (AA) sequence alignment of ATPase domain fragment from glycerol kinase (Glpk) sequence to CARKL (conserved AA red; similar AA green). (K) Activities of recombinant CARKL point mutants for predicted critical AAs. Silver stain below bar graph indicated equal protein quantities.
Figure 4
Figure 4
CARKL Reconfigures Cellular Metabolism and Represses Macrophage Activation (A) CARKL protein expression levels in stable overexpressors (pCARKL) and empty vector control cells (pCtrl). Cell lines were derived from RAW264.7 cells. (B) Metabolic intermediates in pCARKL cells relative to pCtrl cells. (C) OCR and ECAR of pCARKL cells relative to pCtrl cells. (D) CARKL expression in pCARKL cells in the presence and absence of LPS. (E) Relative mRNA expression of (a) CARKL and classical LPS target genes ([b] receptors, [c] cytokines, [d] chemokines) following LPS (100 ng/ml) administration (pCtrl, squares on black; pCARKL, triangles on blue). (F) MHC class II surface expression of resting (basal, dashed lines) and LPS-activated (solid lines, for 24 hr) macrophages measured by FACS. Histogram is representative of at least three independent experiments. (G) NF-κB activity measured by a cis-reporting luciferase construct in pCARKL and pCtrl cells before and after activation with LPS (100 ng/ml) for 8 hr. (H) SOCS3 and SOCS1 mRNA expression in pCARKL (blue) and pCtrl cells (black) relative to unstimulated pCtrl cells. (I) Nuclear protein fraction from LPS-stimulated (2 hr) pCtrl and pCARKL cells was analyzed by western blot for the presence of phosphorylated STAT3 (STAT3-P) and analyzed by densitometry. (J) Quantification of intracellular superoxid (O2.-) production rates in macrophages before and after LPS exposure (2 hr) measured by electron spin resonance spectroscopy. Data are means ± SEM of at least three independent experiments; ns = not significant, p < 0.05, ∗∗p < 0.01, ∗∗∗p < 0.001.
Figure 5
Figure 5
CARKL Integrates Redox State and Glucose Metabolism in Activated Macrophages (A and B) ECAR and OCR during LPS activation of pCARKL and pCtrl cells. (C and D) Metabolite profiles of pCtrl and pCARKL cells during initial activation phase (0–4 hrs post 100 ng/ml LPS). Solid lines represent direct metabolite synthesis. Dashed lines indicate multiple enzymatic steps. Data represent delta mean change in % of pCARKL to pCtrl cells (pCtrl = 0%) ± SEM of three independent experiments; to test if a metabolite profile was significantly changed, we used two-way ANOVA as the statistical test (indicated below metabolite name); black line = pCtrl, blue line = pCARKL. (E) Changes in NAD/NADH peak ratio during activation phase as fold change to unstimulated cells. (F) GSH and GSSG of resting and LPS-activated (4 hr) pCtrl and pCARKL cells. Data are means ± SEM of three independent experiments; p < 0.05, ∗∗p < 0.01, ∗∗∗p < 0.001.
Figure 6
Figure 6
CARKL Regulation Directs the Macrophage Activation Process (A) Macrophages overexpressing either wild-type or mutant CARKL were stimulated with LPS (100 ng/ml), and subsequent IL-6 secretion was measured in cell-free supernatants 4 hr post activation. (B) Protein expression levels of miCARKL and control (miCtrl) RAW264.7 cells. (C) Relative bioavailability of metabolic intermediates in miCARKL and control cells. (D–F) OCR and ECAR of miCARKL and miCtrl cells and their ECAR (E) and NAD/NADH ratios (F) relative to LPS-activated macrophages (1 hr). (G–J) TNF-α (G) and IL-6 (H) cytokine secretion before and after LPS activation in miCARKL cells and miCtrl cells. Resting miCARKL and control cells were incubated with Celastrol (1 μg/ml), DHEA (200 μM), oxamate (40 mM), and expression of TNFα (I) and Mrc-1 (J) was measured by RT-PCR. (K) Mrc-1 expression by IL-4-stimulated miCtrl (black) and miCARKL (white) cells in the absence or presence of buthionine sulphoximine (BSO; 300 μM). (L and M) TNF-α (L) and Mrc-1 (M) expression of IL-4 (10 ng/ml) activated pCARKL and pCtrl cells in the absence or presence of reduced glutathione ethyl ester (GSH-Et; 5 mM). Incubation time was 4 hrs. Data are mean ± SEM of at least three independent experiments; nd = not detected, p < 0.05, ∗∗p < 0.01, ∗∗∗p < 0.001.
Figure 7
Figure 7
CARKL Regulation of M1/M2 Activation Schematic shows how CARKL may direct activation phases/fates of macrophages. CARKL directs carbon reshuffling (C-Flux) between glycolysis and PPP (Figure S7). The resulting alteration in bioenergetics likely functions as a regulatory system analogous to classical protein-based activation schemes (as, for example, for inositol-phosphates). Dashed lines represent effects for which direct evidence exists but where exact molecular mechanisms remain to be defined.

Comment in

References

    1. Beurel E., Yeh W.I., Michalek S.M., Harrington L.E., Jope R.S. Glycogen synthase kinase-3 is an early determinant in the differentiation of pathogenic Th17 cells. J. Immunol. 2011;186:1391–1398. - PMC - PubMed
    1. Chen Y.J., Hsu K.W., Tsai J.N., Hung C.H., Kuo T.C., Chen Y.L. Involvement of protein kinase C in the inhibition of lipopolysaccharide-induced nitric oxide production by thapsigargin in RAW 264.7 macrophages. Int. J. Biochem. Cell Biol. 2005;37:2574–2585. - PubMed
    1. Clasquin M.F., Melamud E., Singer A., Gooding J.R., Xu X., Dong A., Cui H., Campagna S.R., Savchenko A., Yakunin A.F. Riboneogenesis in yeast. Cell. 2011;145:969–980. - PMC - PubMed
    1. Demas G.E., Chefer V., Talan M.I., Nelson R.J. Metabolic costs of mounting an antigen-stimulated immune response in adult and aged C57BL/6J mice. Am. J. Physiol. 1997;273:R1631–R1637. - PubMed
    1. Drapier J.C., Hibbs J.B., Jr. Differentiation of murine macrophages to express nonspecific cytotoxicity for tumor cells results in L-arginine-dependent inhibition of mitochondrial iron-sulfur enzymes in the macrophage effector cells. J. Immunol. 1988;140:2829–2838. - PubMed

Publication types

MeSH terms