. 2012 Jun 6;15(6):827-37.
doi: 10.1016/j.cmet.2012.05.001.

Analysis of tumor metabolism reveals mitochondrial glucose oxidation in genetically diverse human glioblastomas in the mouse brain in vivo

Affiliations

Analysis of tumor metabolism reveals mitochondrial glucose oxidation in genetically diverse human glioblastomas in the mouse brain in vivo

Isaac Marin-Valencia et al. Cell Metab. .

Erratum in

  • Cell Metab. 2012 Nov 7;16(5):686

Abstract

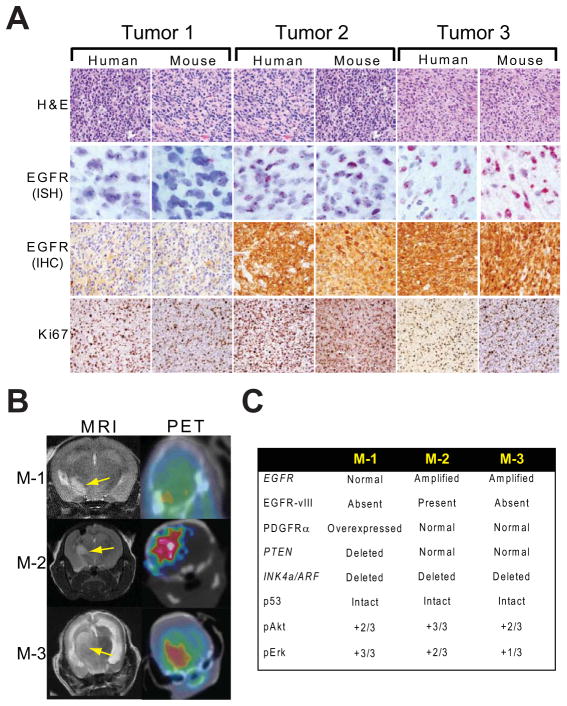
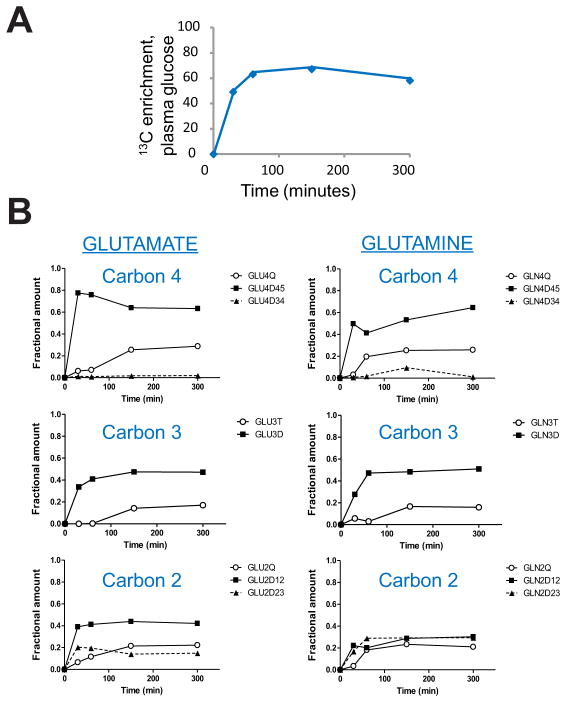
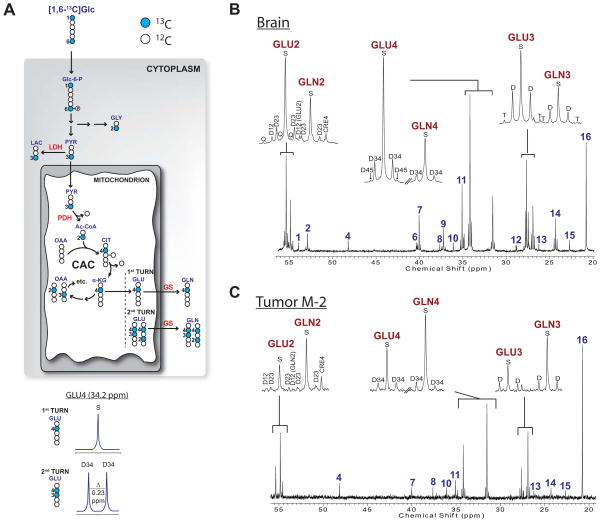
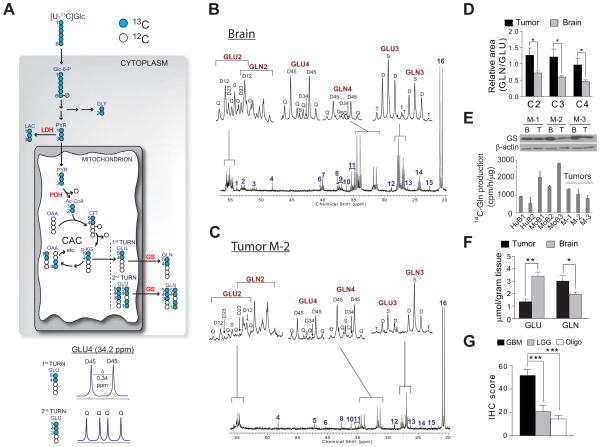
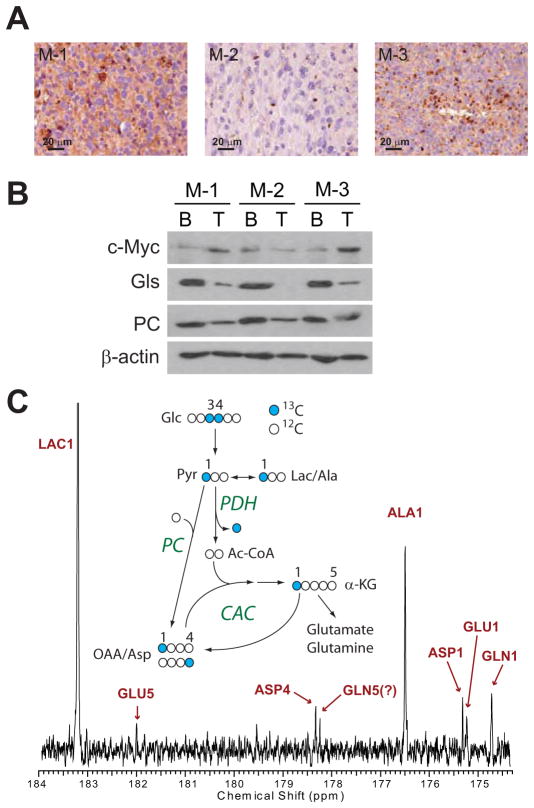
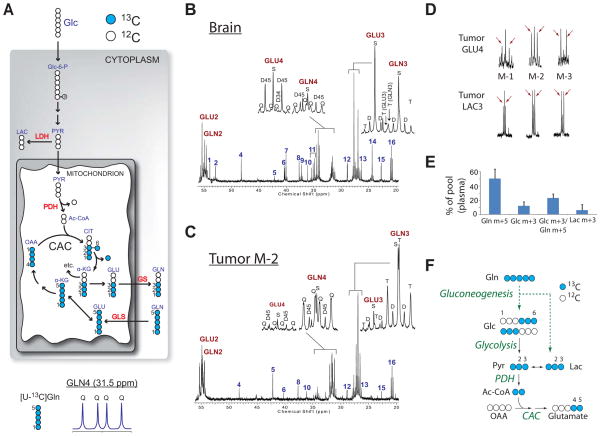
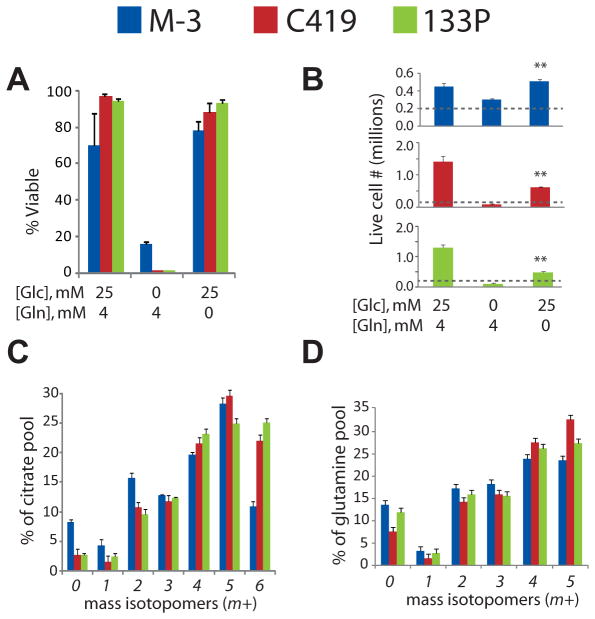
Dysregulated metabolism is a hallmark of cancer cell lines, but little is known about the fate of glucose and other nutrients in tumors growing in their native microenvironment. To study tumor metabolism in vivo, we used an orthotopic mouse model of primary human glioblastoma (GBM). We infused (13)C-labeled nutrients into mice bearing three independent GBM lines, each with a distinct set of mutations. All three lines displayed glycolysis, as expected for aggressive tumors. They also displayed unexpected metabolic complexity, oxidizing glucose via pyruvate dehydrogenase and the citric acid cycle, and using glucose to supply anaplerosis and other biosynthetic activities. Comparing the tumors to surrounding brain revealed obvious metabolic differences, notably the accumulation of a large glutamine pool within the tumors. Many of these same activities were conserved in cells cultured ex vivo from the tumors. Thus GBM cells utilize mitochondrial glucose oxidation during aggressive tumor growth in vivo.


Figures

Figure 1
Figure 1. Human orthotopic tumors (HOTs) established from three primary human GBMs
(A) Hematoxylin and eosin (H&E) stains, EGFR in situ hybridization (ISH) and immunohistochemistry (IHC), and Ki67 staining of parental human GBMs and representative mouse HOTs. (B) MRI and 18FDG-PET of representative mouse HOTs (M-1, M-2, M-3) derived from each parental line. Arrows indicate GBM masses in the right hemisphere. (C) Summary of genomic and IHC data from HOTs M-1, M-2 and M-3.
Figure 2
Figure 2. Time course for 13C-glucose infusions in HOT-bearing mice
(A) Four mice bearing HOTs derived from the same parental tumor were infused with [U-13C]glucose for the indicated times. The time course shows 13C enrichment (in %) of plasma glucose in the individual mice used in this time course experiment. Enrichment at time 0 was assumed to be 0%. All mice received a bolus of [U-13C]glucose over 1 minute followed by a continuous [U-13C]glucose infusion as described in Experimental Procedures. (B) NMR isotopomer analysis for carbons 2, 3 and 4 of glutamate and glutamine. None of these carbons demonstrated any appreciable change in 13C labeling after 150 minutes of [U-13C]glucose infusion.
Figure 3
Figure 3. Metabolism of [1,6-13C]glucose in HOTs and surrounding brain
(A) Illustration of [1,6-13C]glucose metabolism. Filled symbols are 13C and open symbols are 12C. The diagram shows the positions of 13C after glucose is metabolized through glycolysis, glycine synthesis, and multiple turns of the CAC. Numbers refer to carbon positions. At the bottom, the spectra demonstrate the appearance of the 13C NMR spectra for glutamate labeled in position 4 alone (S, singlet), or in positions 3 and 4 (D34, 3–4 doublet), as detailed in Supplemental Experimental Procedures. Abbreviations: Glc, glucose; Glc-6-P, glucose-6-phosphate; GLY, glycine; PYR, pyruvate; LAC, lactate; Ac-CoA, acetyl-CoA; CIT, citrate; α-KG, α-ketoglutarate; OAA, oxaloacetic acid; GLU, glutamate; GLN, glutamine; LDH, lactate dehydrogenase; PDH, pyruvate dehydrogenase; GS, glutamine synthetase. (B) Brain and (C) tumor spectra from a mouse with an M-2 HOT infused with [1,6-13C]glucose. Insets are GLU and GLN C2, C3 and C4. Chemical shift assignments are the same for all spectra in the paper: 1, NAA C2; 2, Aspartate C2; 3, Alanine C2; 4, Taurine C1; 5, Glycine C2; 6, NAA C3; 7, GABA C4; 8, Creatine C2; 9, Aspartate C3; 10, Taurine C2; 11, GABA C2; 12–13, unassigned; 14, GABA C3; 15, NAA C6; 16, Lactate C3. Abbreviations: S, singlet; D, doublet; T, triplet; Q, quartet; ppm, parts per million.
Figure 4
Figure 4. Metabolism of [U-13C]glucose in HOTs and surrounding brain
(A) Illustration of [U-13C]glucose metabolism. See legend to Fig. 3A and Supplemental Experimental Procedures for details and abbreviations. (B) Brain and (C) tumor spectra from a mouse with an M-2 HOT infused with [U-13C]glucose. Insets are glutamate (GLU) and glutamine (GLN) C2, C3 and C4. (D) Ratio of glutamine area to glutamate area for carbons 2, 3 and 4 in tumor and surrounding brain. Data are the average and S.E.M. for six individual mice, two for each of the three HOT lines. Statistical analysis: Wilcoxon signed rank test. *, p<0.05. (E) Top, Glutamine synthetase (GS) western blot in tumor (T) and surrounding brain (B) of HOT lines. Bottom, GS enzyme activity in two human brain samples (HuB1, HuB2), three mouse brain samples (MoB1 – MoB3), and three HOTs (M-1 to M-3). MoB3 is the brain tissue surrounding tumor M-1. Data are the average and S.D. for three replicates from each sample. (F) Total GLN and GLU abundance in tumor and brain extracts (n=9), measured by high-performance liquid chromatography. Data are the average and S.D. *, p<0.05; **, p<0.005, Student’s t-test. (G) Immunohistochemistry (IHC) scores for GS expression in a tissue microarray consisting of GBM (n=81), low-grade (Grade II–III) gliomas (LGG, n=37) and oligodendrogliomas (Oligo, n=33). Data are the average and S.E.M. ***, p<0.001, one-way ANOVA with Dunnett’s post-hoc test.
Figure 5
Figure 5. Anaplerosis in HOTs
(A) c-Myc IHC in HOT tumors. (B) Protein abundance of c-Myc and two anaplerotic enzymes, glutaminase (GLS) and pyruvate carboxylase (PC) in HOT tumors (T) and surrounding brain (B). (C) 13C NMR spectrum from an M-1 tumor infused with [3,4-13C]glucose. The diagram illustrates that in this infusion, PC is active if C1 signal exceeds C5 signal in glutamate and glutamine. GLN5 was not definitively assigned; it is either the indicated peak, or co-resonant with ASP4, both of which are smaller than the GLN1 peak.
Figure 6
Figure 6. HOTs use glucose, not glutamine, to supply the citric acid cycle
(A) Illustration of [U-13C]glutamine metabolism. See legend to Fig. 3A and Supplemental Experimental Procedures for details and abbreviations. (B) Brain and (C) tumor spectra from a mouse with an M-2 HOT infused with [U-13C]glutamine. Insets are glutamate (GLU) and glutamine (GLN) C3 and C4. (D) Expansion of GLU4 and LAC3 multiplets in three tumors infused with [U-13C]-glutamine. Arrows highlight the 2–3 doublet in lactate and the 4–5 doublet in glutamate. (E) 13C enrichment in plasma glutamine, glucose and lactate of mice infused with [U-13C]glutamine. Data are the average ± S.D. of three HOT-bearing mice. (F) Schematic of metabolic activities occurring outside of the tumor by which [U-13C]-glutamine is converted to glucose and lactate (dashed green arrows), which are detected in the plasma. Subsequent metabolism in the tumor (black arrows) uses 13C glucose and/or lactate to supply the CAC.
Figure 7
Figure 7. Cells from HOTs survive and grow without exogenous glutamine
(A) Viability and (B) live cell number in neurosphere cultures derived from three HOTs (M-3, C419 and 133P) in medium containing both glucose and glutamine, glutamine alone, or glucose alone. The dashed line indicates the number of cells plated at the start of the experiment. Data are the average ± S.D. of three independent cultures (**, p<0.005, Student’s t-test). (C) Mass isotopomer distribution of citrate in neurospheres cultured in medium with [U-13C]glucose. Data are the average ± S.D. of three independent cultures. (D) Mass isotopomer distribution of glutamine in the same cells. Data are the average ± S.D. of three independent cultures.

Comment in

References

    1. Cheng T, Sudderth J, Yang C, Mullen AR, Jin ES, Mates JM, DeBerardinis RJ. Pyruvate carboxylase is required for glutamine-independent growth of tumor cells. Proc Natl Acad Sci U S A. 2011;108:8674–8679. - PMC - PubMed
    1. Choi C, Ganji SK, DeBerardinis RJ, Dimitrov IE, Pascual JM, Bachoo R, Mickey BE, Malloy CR, Maher EA. Measurement of glycine in the human brain in vivo by 1H-MRS at 3 T: application in brain tumors. Magn Reson Med. 2011;66:609–618. - PMC - PubMed
    1. Choi C, Ganji SK, Deberardinis RJ, Hatanpaa KJ, Rakheja D, Kovacs Z, Yang XL, Mashimo T, Raisanen JM, Marin-Valencia I, et al. 2-hydroxyglutarate detection by magnetic resonance spectroscopy in IDH-mutated patients with gliomas. Nat Med. 2012;18:624–629. - PMC - PubMed
    1. DeBerardinis RJ, Lum JJ, Hatzivassiliou G, Thompson CB. The biology of cancer: metabolic reprogramming fuels cell growth and proliferation. Cell Metab. 2008a;7:11–20. - PubMed
    1. DeBerardinis RJ, Mancuso A, Daikhin E, Nissim I, Yudkoff M, Wehrli S, Thompson CB. Beyond aerobic glycolysis: transformed cells can engage in glutamine metabolism that exceeds the requirement for protein and nucleotide synthesis. Proc Natl Acad Sci U S A. 2007;104:19345–19350. - PMC - PubMed

Publication types

MeSH terms