. 2012 Jun 8;149(6):1381-92.
doi: 10.1016/j.cell.2012.04.029.

Comparative epigenomic annotation of regulatory DNA

Affiliations

Comparative epigenomic annotation of regulatory DNA

Shu Xiao et al. Cell. .

Abstract

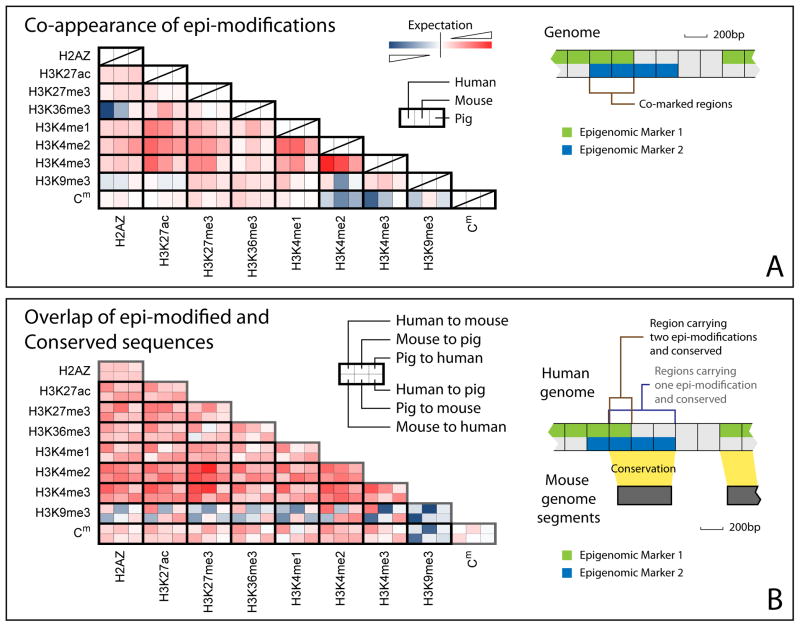
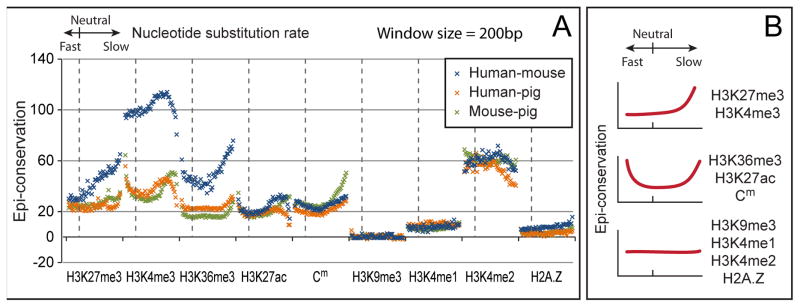
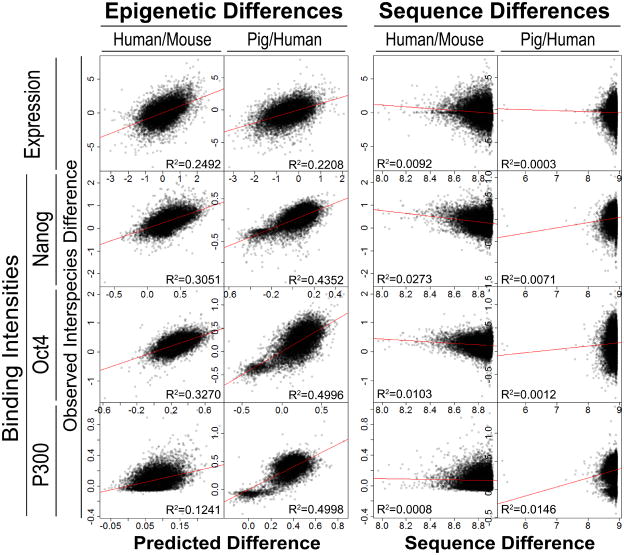
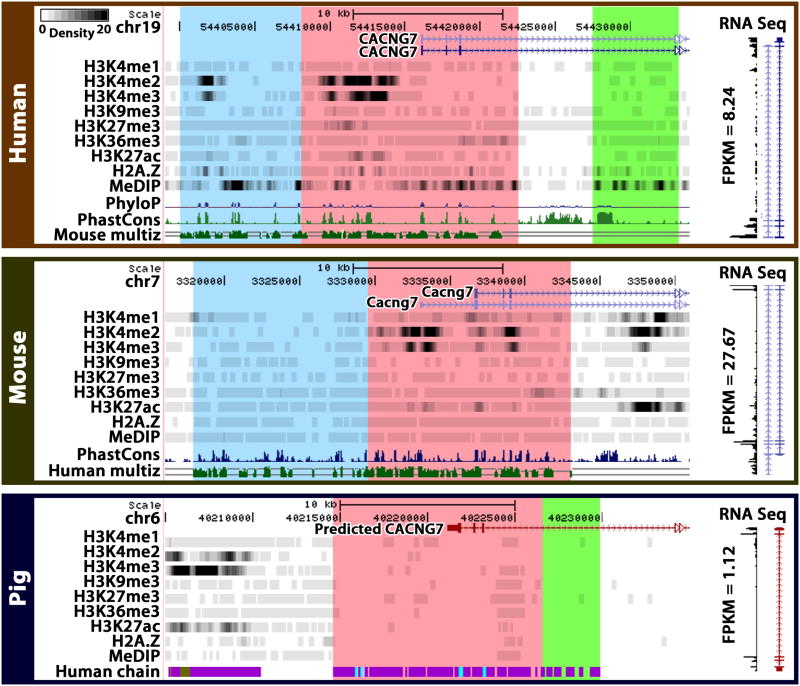
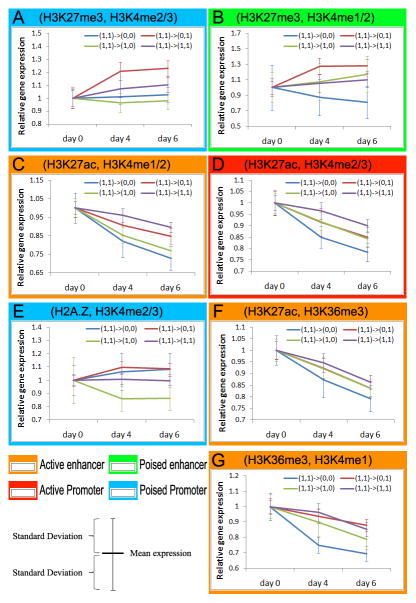
Despite the explosive growth of genomic data, functional annotation of regulatory sequences remains difficult. Here, we introduce "comparative epigenomics"-interspecies comparison of DNA and histone modifications-as an approach for annotation of the regulatory genome. We measured in human, mouse, and pig pluripotent stem cells the genomic distributions of cytosine methylation, H2A.Z, H3K4me1/2/3, H3K9me3, H3K27me3, H3K27ac, H3K36me3, transcribed RNAs, and P300, TAF1, OCT4, and NANOG binding. We observed that epigenomic conservation was strong in both rapidly evolving and slowly evolving DNA sequences, but not in neutrally evolving sequences. In contrast, evolutionary changes of the epigenome and the transcriptome exhibited a linear correlation. We suggest that the conserved colocalization of different epigenomic marks can be used to discover regulatory sequences. Indeed, seven pairs of epigenomic marks identified exhibited regulatory functions during differentiation of embryonic stem cells into mesendoderm cells. Thus, comparative epigenomics reveals regulatory features of the genome that cannot be discerned from sequence comparisons alone.


Figures

Figure 1
Figure 1
Interspecies conservation of epigenomic modifications. Each box plot represents the distribution of the normalized intensities of the indicated epi- modifications (e.g., Cm, upper-most row) in various genomic regions (e.g., 500bp upstream of genes, left-most column). Median, quartiles, maximum, and minimum intensity values are shown in each box plot (see insert). The assembly of 9 box plots shows the distribution of relative intensities of an epi- modification on different genomic regions in a species (e.g., Cm in human, upper-most and left-most panels). P-value: the support to conservation of each epi- modification, calculated from a non-parametric test comparing the data in the left, middle, and right panels.
Figure 2
Figure 2
Interspecies conservation of co-occupancy of different epi- modifications. (A) Log ratio between the number of genomic regions carrying two epi- modifications (shown as row and column names) and the expected number, calculated from a null model that the epi- modifications appear independently of each other (each small box, red: log ratio > 0, co-occupancy; blue: log ratio < 0, anti-co-occupancy). With a few exceptions, both positive and negative co-occupancies of any epi- marks are conserved across species, as seen in similar colors of the three consecutive boxes in a row. (B) Log ratio between the number of conserved regions carrying one (diagonal boxes) or two (non-diagonal boxes) epi- modifications and the expected number, calculated from a null model in which conserved regions and epi- modified regions appear independently. Conserved genomic regions are determined by six pair-wise comparisons, shown in six small boxes outlined with a darker edge. For example, the left-most upper box refers to the human genomic regions conserved in a human vs. mouse comparison. All genomic regions with epi- modifications except H3K9me3 were positively associated with conserved regions (red). H3K9me3 selectively marks non-conserved regions (blue). Bivalent domains (co-marked by repression mark H3K27me3 and activation mark H3K4me2/3) exhibited the strongest association with conserved regions. (See also figure S2)
Figure 3
Figure 3
Global comparison of genomic and epigenomic conservations. (A) The human genome was categorized into 50 distinct sets by nucleotide substitution rates (x-axis). These sets were ordered from the fastest changing (1st), to neutral (17th), and to slowest changing (50th). Epi- conservation levels by human-mouse (green) and human-pig (orange) comparisons are plotted on the y-axis. Similarly, the mouse genome was categorized into 50 sets, and the epi- conservation levels in a mouse-pig comparison were plotted (blue). (B) Schematic representations of the correlations between sequence selection and epi- conservation. Some epi- marks exhibit a U-shaped correlation, while others can be represented by the right half or the flat bottom of the U-curve. (See also Figure S2)
Figure 4
Figure 4
Correlations among evolutionary changes of epi- modification intensities, gene expression levels, TF binding intensities, and genomic sequences. (Left panel) Evolutionary changes of epi- modification intensities are predictive of gene expression changes and TF binding intensity changes. X-axis: predicted gene expression or TF binding intensity changes with a linear model of interspecies epi- intensity changes; Y-axis: observed interspecies changes. (Right panel) Scatter plots between interspecies gene expression difference (y-axis) and promoter sequence difference (x-axis). For every orthologous gene pair, sequence difference was measured by log(m) − log(n), where m is the maximum log blastn score of all orthologous promoters (4k bp centered at TSS), and n is the blastn score of the orthologous promoter pair under consideration. R2: square of the sample correlation coefficient. (See also figure S3 and table S2)
Figure 5
Figure 5
An example of correlated interspecies epi- and gene expression changes. The genomic and epigenomic neighborhoods of CACNG7 (calcium channel, voltage-dependent, gamma subunit 7) in three species are displayed by the Comparative Epigenome Browser. The orthologous regions determined by the liftOver program are shaded in the same color. Densities of ChIP-seq counts and MeDIP-seq counts are plotted in gray scale. ~12kb upstream sequences of the gene are conserved (pink). H3K4me2 and H3K4me3 are present and conserved in upstream regions in humans and mice, coinciding with conserved expression of the gene (RNA-seq data drawn vertically on the right). The conserved pig upstream sequence (in pink) is devoid of H3K4me2/3 marks, coinciding with a much lower expression level of the pig gene. (See also figure S3)
Figure 6
Figure 6
Epi- changes and gene expression changes during differentiation. Each panel represents a set of genomic regions associated with a pair of epi- marks. Each set of regions is categorized into four subclasses, i.e., kept both marks during differentiation (1,1→1,1), lost the first mark (1,1→0,1), lost the second mark (1,1→1,0), and lost both marks (1,1→0,0). For example, the red line (1,1→0,1) in Panel A (H3K27me3, H3K4me2/3) represents sequences with loss of H3K27me3 (the first sign changes from 1 to 0) and retention of H3K4me2/3 (the second sign stays at 1). Relative gene expression values of the nearest genes to the co-marked regions are plotted on the y-axis. (See also figure S5–7 and table S1)

References

    1. Bernstein BE, Mikkelsen TS, Xie X, Kamal M, Huebert DJ, Cuff J, Fry B, Meissner A, Wernig M, Plath K, et al. A Bivalent Chromatin Structure Marks Key Developmental Genes in Embryonic Stem Cells. Cell. 2006;125:315–326. - PubMed
    1. Campos EI, Reinberg D. Histones: Annotating Chromatin. Annual Review of Genetics. 2009;43:559–599. - PubMed
    1. Chan E, Quon G, Chua G, Babak T, Trochesset M, Zirngibl R, Aubin J, Ratcliffe M, Wilde A, Brudno M, et al. Conservation of core gene expression in vertebrate tissues. Journal of Biology. 2009;8:33. - PMC - PubMed
    1. Chen X, Xu H, Yuan P, Fang F, Huss M, Vega VB, Wong E, Orlov YL, Zhang W, Jiang J, et al. Integration of external signaling pathways with the core transcriptional network in embryonic stem cells. Cell. 2008;133:1106–1117. - PubMed
    1. Cooper GM, Stone EA, Asimenos G, Green ED, Batzoglou S, Sidow A. Distribution and intensity of constraint in mammalian genomic sequence. Genome Res. 2005;15:901–913. - PMC - PubMed

Publication types

Substances

Associated data