. 2012 Jun 9;2(1):31.
doi: 10.1186/2191-219X-2-31.

Pharmacodynamic analysis of tumour perfusion assessed by 15O-water-PET imaging during treatment with sunitinib malate in patients with advanced malignancies

Affiliations

Pharmacodynamic analysis of tumour perfusion assessed by 15O-water-PET imaging during treatment with sunitinib malate in patients with advanced malignancies

Andrew M Scott et al. EJNMMI Res. .

Abstract

Background: We evaluated pharmacodynamic changes in tumour perfusion using positron emission tomography (PET) imaging with 15O-water to assess biological response to sunitinib, a multitargeted tyrosine kinase inhibitor.

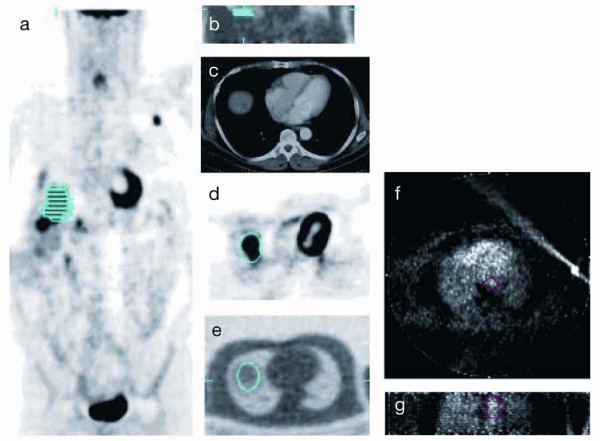
Methods: Patients with advanced malignancies received sunitinib 50 mg/day orally, once daily for 4 weeks on treatment, followed by 2 weeks off treatment, in repeated 6-week cycles. Quantitative measurement of tumour perfusion was assessed using 15O-water-PET at baseline and after 2 weeks of treatment. At least one reference tumour lesion was included in the fields of view and assessed at both time points. Patients also underwent 18 F-fluorodeoxyglucose (FDG)-PET imaging at baseline and after 2 and 4 weeks of treatment. Radiological response of the reference tumour lesion and overall radiological response were assessed at week 12. Serum pharmacokinetic and biomarker analyses were also performed.

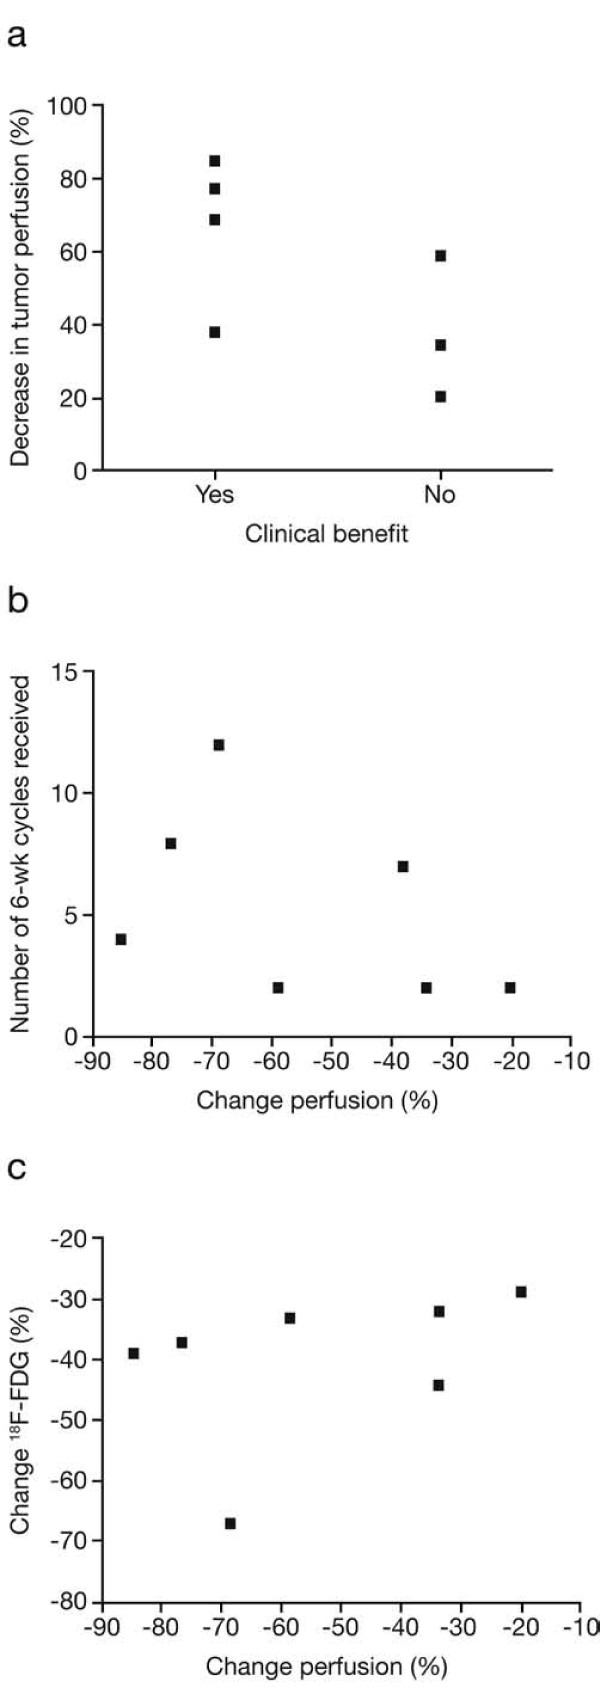
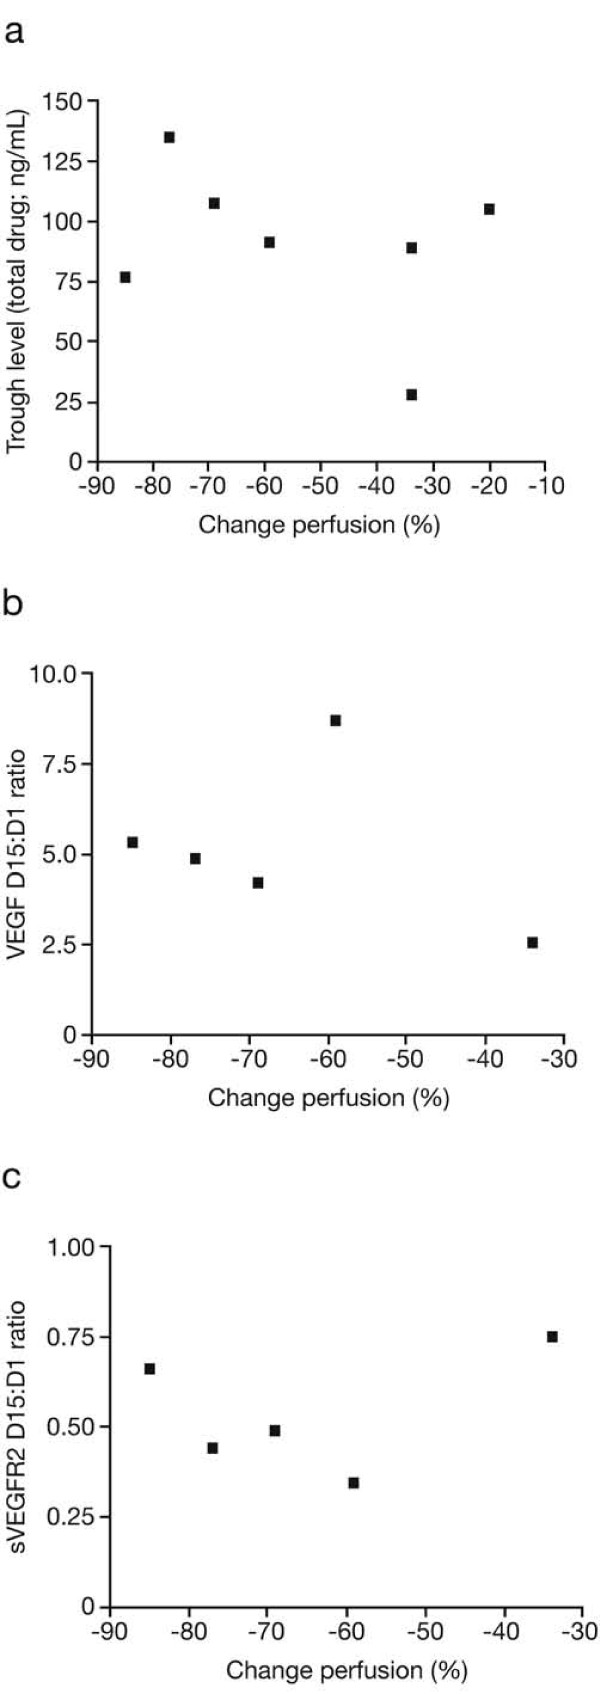
Results: Data were available for seven patients. Compared with baseline, all patients experienced a decrease in reference tumour blood flow ranging from 20 % to 85 % and also a reduction in the FDG standard uptake value ranging from 29 % to 67 %. Six patients experienced a partial metabolic response based on FDG-PET criteria. Four patients had stable disease defined by radiological response (Response Evaluation Criteria in Solid Tumors) lasting between 4 and 12 cycles. An association between perfusion change and clinical benefit, and biomarker levels including vascular endothelial growth factor was observed.

Conclusion: Administering sunitinib to patients with advanced malignancies is associated with early biological responses, including decreased blood flow in secondary tumour deposits.


Figures

Figure 1
Figure 1
Reference tumour volume of interest using the attenuation image for the FDG and 15O-water studies. Liver metastasis defined on the FDG-PET emission image ((a) coronal and (d) transaxial), also seen on the CT scan (c), was identified and transposed onto the 15O-water acquired attenuation image ((b) coronal and (e) transaxial) to be subsequently applied to the dynamic 15O-water emission image. The descending aorta volume of interest markup from 15O-water early dynamic frames ((f) transaxial and (g) coronal).
Figure 2
Figure 2
Spectral analysis model and operational equations. Spectral analysis model used to calculate tumour blood flow comprising vascular and tissue compartments (a), and the operational equation defining tissue blood flow (b) and (c) where M(t) denotes the detected activity within a volume of interest and is made up of a vascular component given by V0Ca(t) and an extra-vascular or tissue component Me(t), where V0 denotes the vascular volume term, and Ca(t), the arterial input term. Such a system is governed by a so-called one-tissue-compartment model dictated by the equation given in (c). The analytic solution to this differential equation is expressed in (d). The equation in (e) illustrates the linearisation process whereby a spectrum of exponentials convolved with the input function are predetermined so as to allow the linear solution for the blood-perfusion weighting terms given by αi.
Figure 3
Figure 3
Tumour blood flow analysis in patient 4. The result of the spectral fitting procedure for patient 4 pre-treatment (a) and post-treatment (b), with the associated estimation of tumour blood perfusion reported in the value of K1.
Figure 4
Figure 4
Correlation between reduction in tumour perfusion and clinical benefit, duration of therapy, and FDG-SUV change. Potential correlations between percent reduction in tumour perfusion and clinical benefit (p = 0.05) (a), duration of therapy (p = 0.05) (b), and percent reduction in FDG-SUV (p > 0.05) (c).
Figure 5
Figure 5
Correlation between reduction in tumour perfusion and trough levels of total drug, VEGF, and sVEGFR-2. Potential correlations between percent reduction in tumour perfusion and day 15 trough levels of total drug (sunitinib plus SU12662; p > 0.05) (a), change in plasma VEGF levels (p = 0.05) (b), and change in plasma sVEGFR-2 levels (p > 0.05) (c). D15:D1, day 15:day 1 ratio.

Similar articles

Cited by

References

    1. Bedor M, Alexander C, Edelman MJ. Management of common symptoms of advanced lung cancer. Curr Treat Options Oncol. 2005;6:61–68. doi: 10.1007/s11864-005-0013-2. - DOI - PubMed
    1. Dixon MR, Stamos MJ. Strategies for palliative care in advanced colorectal cancer. Dig Surg. 2004;21:344–351. doi: 10.1159/000081351. - DOI - PubMed
    1. Ruan DT, Warren RS. Palliative techniques for hepatic cancer. Surg Oncol Clin N Am. 2004;13:505–516. doi: 10.1016/j.soc.2004.04.003. ix. - DOI - PubMed
    1. Isobe T, Herbst RS, Onn A. Current management of advanced non-small cell lung cancer: targeted therapy. Semin Oncol. 2005;32:315–328. doi: 10.1053/j.seminoncol.2005.02.016. - DOI - PubMed
    1. Scott AM. Current status of positron emission tomography in oncology. Intern Med J. 2001;31:27–36. doi: 10.1046/j.1445-5994.2001.00015.x. - DOI - PubMed

LinkOut - more resources