. 2012 Jun 9:9:35.
doi: 10.1186/1743-0003-9-35.

An EEG-based study of discrete isometric and isotonic human lower limb muscle contractions

Affiliations

An EEG-based study of discrete isometric and isotonic human lower limb muscle contractions

Joseph T Gwin et al. J Neuroeng Rehabil. .

Abstract

Background: Electroencephalography (EEG) combined with independent component analysis enables functional neuroimaging in dynamic environments including during human locomotion. This type of functional neuroimaging could be a powerful tool for neurological rehabilitation. It could enable clinicians to monitor changes in motor control related cortical dynamics associated with a therapeutic intervention, and it could facilitate noninvasive electrocortical control of devices for assisting limb movement to stimulate activity dependent plasticity. Understanding the relationship between electrocortical dynamics and muscle activity will be helpful for incorporating EEG-based functional neuroimaging into clinical practice. The goal of this study was to use independent component analysis of high-density EEG to test whether we could relate electrocortical dynamics to lower limb muscle activation in a constrained motor task. A secondary goal was to assess the trial-by-trial consistency of the electrocortical dynamics by decoding the type of muscle action.

Methods: We recorded 264-channel EEG while 8 neurologically intact subjects performed isometric and isotonic, knee and ankle exercises at two different effort levels. Adaptive mixture independent component analysis (AMICA) parsed EEG into models of underlying source signals. We generated spectrograms for all electrocortical source signals and used a naïve Bayesian classifier to decode exercise type from trial-by-trial time-frequency data.

Results: AMICA captured different electrocortical source distributions for ankle and knee tasks. The fit of single-trial EEG to these models distinguished knee from ankle tasks with 80% accuracy. Electrocortical spectral modulations in the supplementary motor area were significantly different for isometric and isotonic tasks (p < 0.05). Isometric contractions elicited an event related desynchronization (ERD) in the α-band (8-12 Hz) and β-band (12-30 Hz) at joint torque onset and offset. Isotonic contractions elicited a sustained α- and β-band ERD throughout the trial. Classifiers based on supplementary motor area sources achieved a 4-way classification accuracy of 69% while classifiers based on electrocortical sources in multiple brain regions achieved a 4-way classification accuracy of 87%.

Conclusions: Independent component analysis of EEG reveals unique spatial and spectro-temporal electrocortical properties for different lower limb motor tasks. Using a broad distribution of electrocortical signals may improve classification of human lower limb movements from single-trial EEG.


Figures

Figure 1
Figure 1
A sketch of the experimental setup for A) isometric knee extension, B) isometric knee flexion, C) isotonic knee extension, D) isometric ankle plantar flexion, E) isometric ankle dorsiflexion, F) isotonic ankle plantar flexion, and G) isotonic ankle dorsiflexion. For isometric exercises the direction of the applied force is indicated by a dashed arrow. For isotonic exercises the direction of movement is indicated by solid arrows.
Figure 2
Figure 2
AMICA model probabilities for ankle trials (left) and knee trials (right). Error bars show 1 SD. * p < 0.01.
Figure 3
Figure 3
Clusters of electrocortical source equivalent current dipoles localized to the (1: orange) supplementary motor area, (2: purple) left dorsal premotor area, (3: magenta) right dorsal premotor area, (4: blue) posterior cingulate, (5: yellow) posterior parietal, (6: brown) anterior cingulate, and (7: green) visual cortex. Two dipole models are shown; (top) the model best fitting the EEG signals during ankle exercises and (bottom) knee exercises. Small spheres indicate dipole locations for single electrocortical sources for single subjects; larger spheres indicate geometric cluster centroids
Figure 4
Figure 4
Grand average normalized spectrograms for supplementary motor area electrocortical sources showing average changes in spectral power during the task relative to a pre-trial baseline for isometric (left) versus isotonic (middle) trials. The right panel shows the difference between isometric and isotonic conditions. The horizontal axis begins 1 s prior to trial onset (To; first black vertical line) and ends 1 s after trial offset (Tf; second black vertical line). The times between the onset and offset of the trials were warped to align these latencies across all trials. Non-significant changes from baseline (p > 0.05) were set to 0 dB (green).
Figure 5
Figure 5
Average event-related desyncronization (ERD) for high effort and low effort muscle contractions shown separately for isometric (left) and isotonic (right) conditions. Error bars show 1 SD. * p < 0.01.
Figure 6
Figure 6
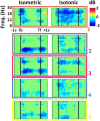
Grand average normalized spectrograms for (top row) supplementary motor area, (second row) left dorsal premotor area, (third row) right dorsal premotor area, (fourth row) posterior cingulate, and (fifth row) posterior parietal cortex showing average changes in spectral power during the task relative to a −1000 ms to −500 ms baseline for isometric (left) and isotonic (right) trials. The color of the border and the numeric label for each row corresponds to the color and numeric label of the dipoles for the corresponding cluster shown in Figure 3. The horizontal axis begins 1 s prior to trial onset (To; first black vertical line) and ends 1 s after trial offset (Tf; second black vertical line). The times between the onset and offset of the trials were warped to align these latencies across all trials. Non-significant changes from baseline (p > 0.05) were set to 0 dB (green).

References

    1. Boyd LA, Vidoni ED, Daly JJ. Answering the call: The influence of neuroimaging and electrophysiological evidence on rehabilitation. Phys Ther. 2007;87(6):684–703. doi: 10.2522/ptj.20060164. - DOI - PubMed
    1. Yang JF, Gorassini M. Spinal and brain control of human walking: implications for retraining of walking. Neuroscientist. 2006;12(5):379–389. doi: 10.1177/1073858406292151. - DOI - PubMed
    1. Weiller C. Imaging recovery from stroke. Exp Brain Res. 1998;123(1–2):13–17. - PubMed
    1. Wang W. et al.Neural interface technology for rehabilitation: exploiting and promoting neuroplasticity. Phys Med Rehabil Clin N Am. 2010;21(1):157–178. doi: 10.1016/j.pmr.2009.07.003. - DOI - PMC - PubMed
    1. Daly JJ, Wolpaw JR. Brain-computer interfaces in neurological rehabilitation. Lancet Neurol. 2008;7(11):1032–1043. doi: 10.1016/S1474-4422(08)70223-0. - DOI - PubMed

Publication types

LinkOut - more resources