. 2012 Jul 6;11(1):36-49.
doi: 10.1016/j.stem.2012.05.013. Epub 2012 Jun 7.

Bone marrow failure in Fanconi anemia is triggered by an exacerbated p53/p21 DNA damage response that impairs hematopoietic stem and progenitor cells

Affiliations

Bone marrow failure in Fanconi anemia is triggered by an exacerbated p53/p21 DNA damage response that impairs hematopoietic stem and progenitor cells

Raphael Ceccaldi et al. Cell Stem Cell. .

Abstract

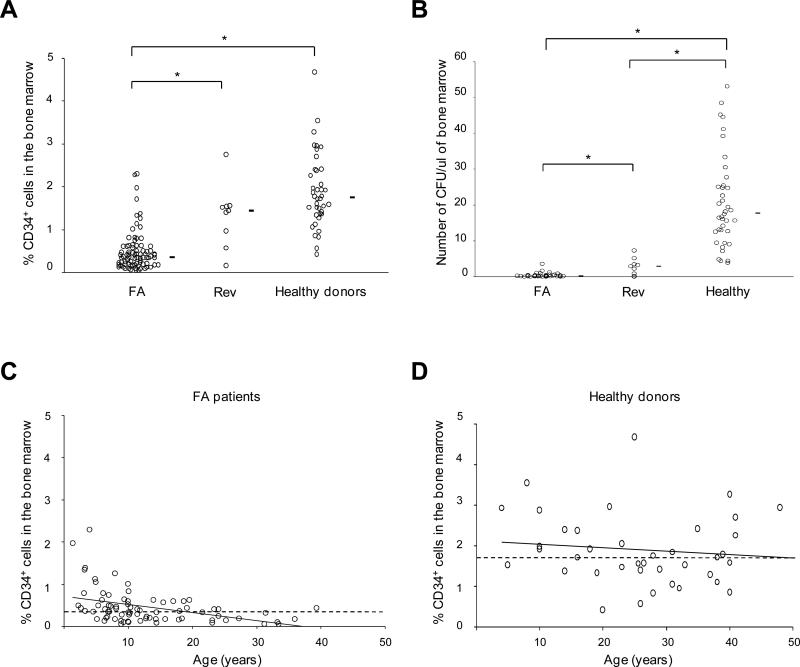
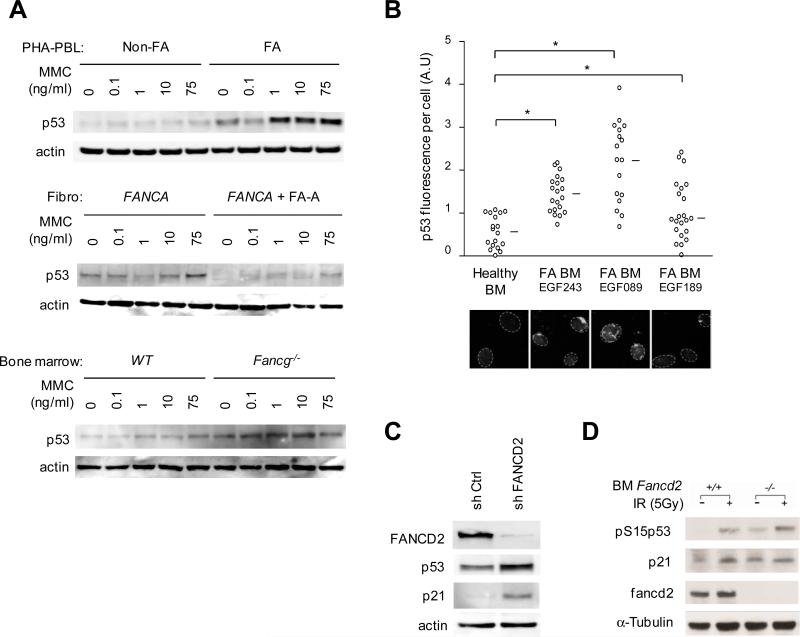
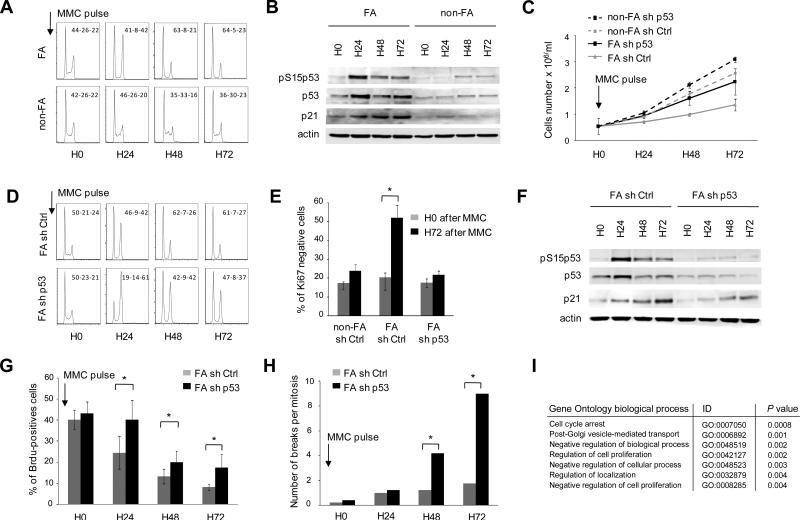
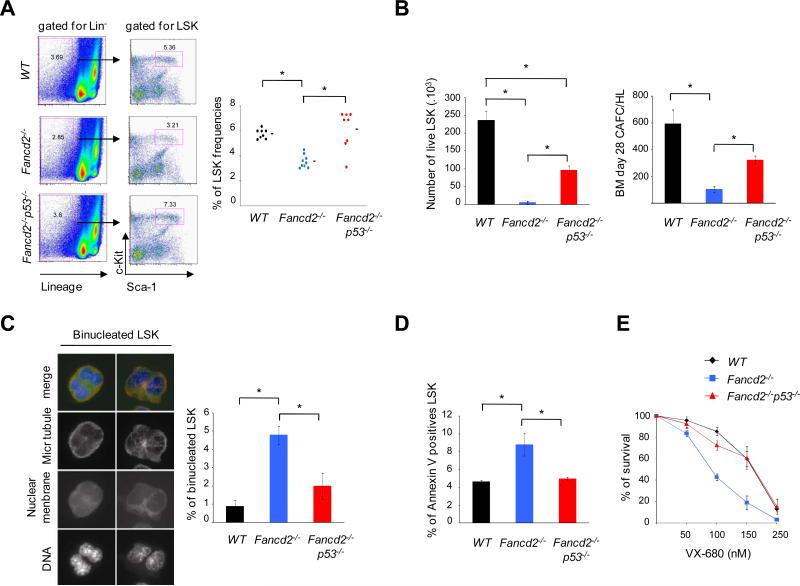
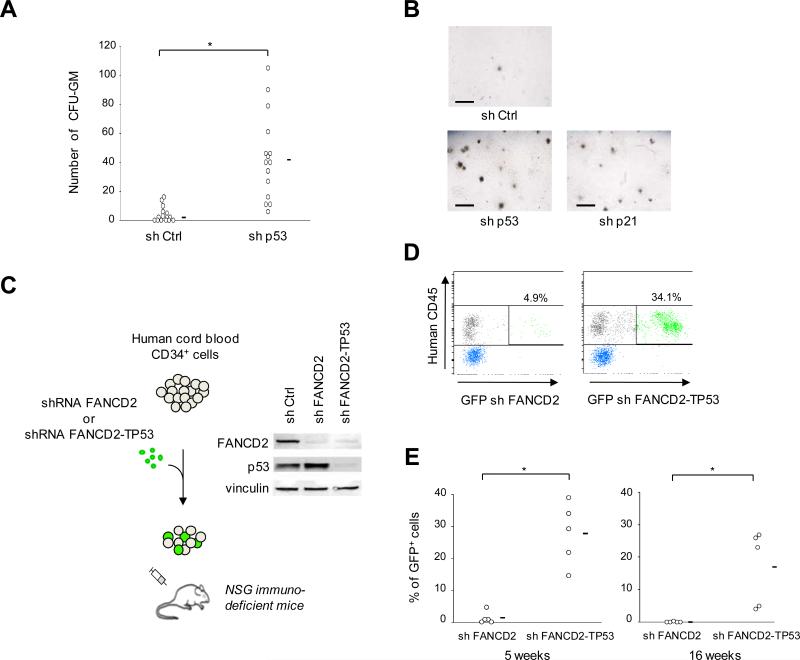
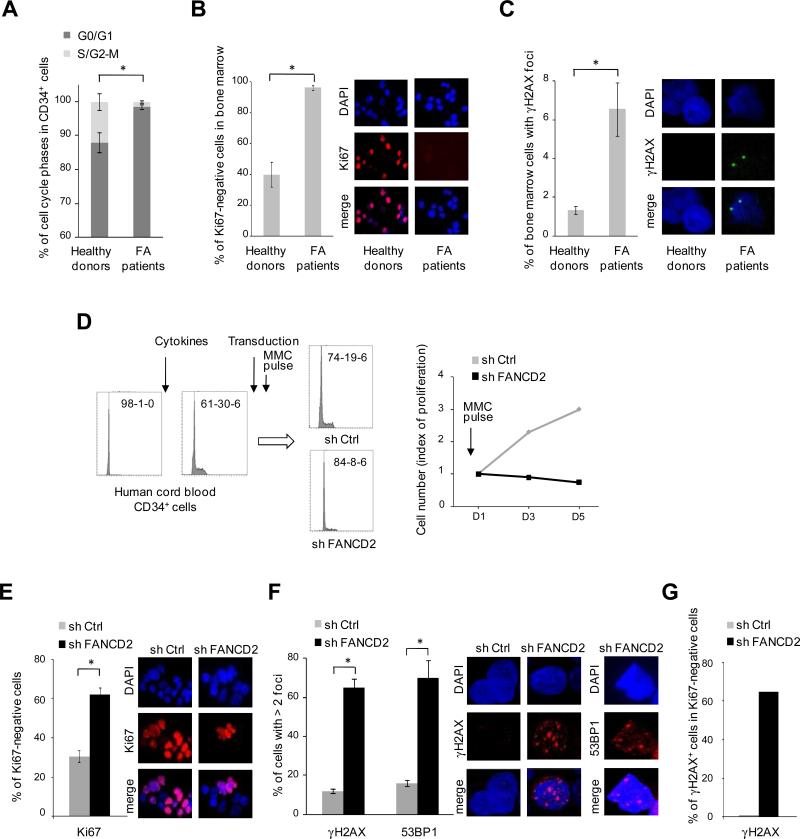
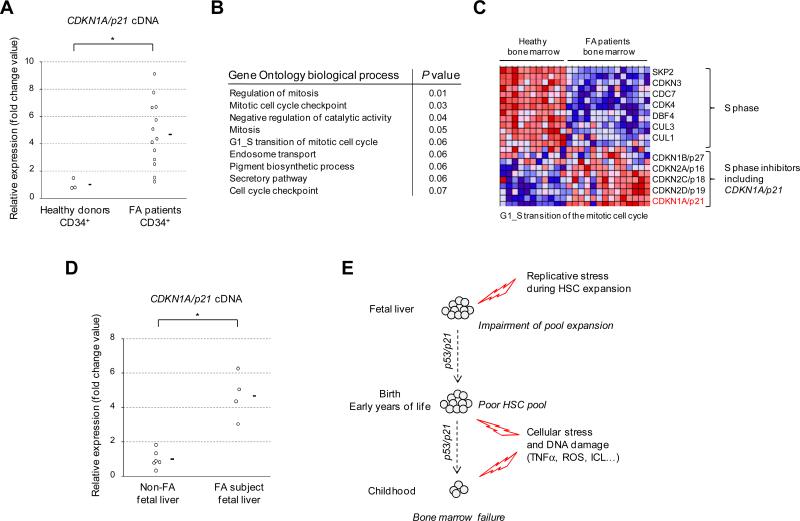
Fanconi anemia (FA) is an inherited DNA repair deficiency syndrome. FA patients undergo progressive bone marrow failure (BMF) during childhood, which frequently requires allogeneic hematopoietic stem cell transplantation. The pathogenesis of this BMF has been elusive to date. Here we found that FA patients exhibit a profound defect in hematopoietic stem and progenitor cells (HSPCs) that is present before the onset of clinical BMF. In response to replicative stress and unresolved DNA damage, p53 is hyperactivated in FA cells and triggers a late p21(Cdkn1a)-dependent G0/G1 cell-cycle arrest. Knockdown of p53 rescued the HSPC defects observed in several in vitro and in vivo models, including human FA or FA-like cells. Taken together, our results identify an exacerbated p53/p21 "physiological" response to cellular stress and DNA damage accumulation as a central mechanism for progressive HSPC elimination in FA patients, and have implications for clinical care.


Figures

Figure 1
Figure 1. Impairment of hematopoietic stem and progenitor cells (HSPCs) and worsening with age in FA patients
(A) CD34+ cell percentages in fresh bone marrow samples of 82 FA patients (FA), 9 FA patients with genetic reversion and somatic mosaicism (Rev), and 40 non-FA healthy donors. Mean values are indicated by horizontal bars. Statistical analyses were performed using the Wilcoxon test (*; FA vs healthy donors, P< 10-15; FA vs Rev, P< 10-4; Rev vs healthy donors, non significant). (B) CFU-GM assays (CFU) using fresh bone marrow cells from 47 FA, 9 Rev patients, and 40 healthy donors (*; FA vs donors, P< 10-15; FA vs Rev, P< 10-3; Rev vs donors, P< 10-4). (C) Bone marrow CD34+ cell percentages according to age in FA patients (N = 82) and (D) healthy donors (N = 40). For clarity, data from FA patients with genetic reversion (somatic mosaicism) are not indicated here. The dashed line indicates the median value in FA patients (0.40%) and in healthy donors (1.75%), the solid line indicates the trend according to aging. See also Figure S1.
Figure 2
Figure 2. Constitutive p53 induction in FA cells
(A) Representative immunoblot analysis of phytohemagglutinin-stimulated blood lymphocytes (PHA-PBL, top panel; PHA-PBL from 11 FA patients were tested with consistent results) and primary fibroblasts from FA patients (fibro FANCA), and bone marrow cells of Fancg-/- mice. Controls were PHA-PBL from healthy donors (Non-FA), FANCA-deficient human fibroblasts that were corrected by retroviral complementation (+FA-A), and wild-type (WT) littermate mice. Cells were cultured with increasing concentrations of Mitomycin C (MMC) as indicated. (B) Top panel, quantification of p53 fluorescence signal in individual bone marrow cells. Each circle represents a single cell; data from 3 representative FA patients (referred by unique EGF identification number) and a healthy donor are shown. Lower panel, representative microscopy images of p53 staining. Circles indicate nuclear contours; mean values are indicated by a horizontal bar and statistical analyses were performed using the Student test (*, P< 10-4, 10-4 and 10-2 in Healthy donor vs FA patient EGF243, EGF089 and EGF189, respectively). A.U., arbitrary unit; original magnification, × 63. (C) Immunoblot analysis of p53 and p21 protein levels in human 293T cells after transduction with sh Ctrl or sh FANCD2 shRNAs. (D) Immunoblot analysis of phospho-S15-p53 and p21 protein levels in murine wild-type (WT) and Fancd2-/- bone marrow cells. Cells were irradiated as indicated.
Figure 3
Figure 3. Unresolved DNA damage triggers a p53/p21 response which restricts the cell cycle into G0/G1 in FA cells
(A) Cell-cycle analysis in FA EBV cells relative to non-FA EBV cells. After MMC pulse, FA cells displayed an early FA-prototypical arrest in G2. At later time-points and after resolution of the G2 checkpoint, FA cells shifted to arrest in G0/G1 with S phase extinction. G0/G1-S-G2 relative percentages are indicated for each panel. (B) p53, phospho-S15-p53, and p21 immunoblot analyses of FA and non-FA cell extracts at several time-points after the MMC pulse. (C) FA EBV cell lines were transduced with sh Ctrl or sh p53 shRNAs, GFP+ cells were sorted, cultured for 24 h, and grown for 3 days in MMC-free medium after a MMC pulse. Live cell numbers are shown at time-points 0, 24, 48, and 72 h. A non-FA EBV cell line transduced with sh Ctrl or sh p53 is shown as control. In the absence of MMC-pulse, sh Ctrl- or sh p53-transduced cell growth did not differ (not shown). (D) Cell-cycle analysis of FA cells shows a prototypical arrest in G2 of both sh Ctrl- and sh p53-transduced cells. G0/G1-S-G2 relative percentages are indicated for each panel. (E) Percentage of Ki67-negative cells in FA EBV cells transduced with sh Ctrl and sh p53 at H0 and H72 after MMC pulse. Statistical analyses were performed using the Chi–squared test for trend in proportions (*, P< 10-6). (F) p53, phospho-S15-p53 (pS15p53, activated), p21CDKN1A/CIP1/WAF1, and actin (loading control) immunoblot analyses of sh Ctrl- and sh p53-transduced EBV FA-cell extracts. (G) Quantification of the fraction of cycling sh Ctrl- and sh p53-transduced FA cells by BrdU incorporation. The strongly decreased percentages of cells in S phase after MMC treatment were lower in sh p53-transduced cells; statistical analyses were performed using the Odd ratio test (*, P<10-4). FA tests were performed in triplicates in at least two EBV FA cell lines. (H) Quantification of the genomic instability (chromosomal breaks per mitosis) in sh Ctrl- and sh p53-transduced EBV FA-cells. Statistical analyses were performed using the Chi–squared test for trend in proportions (*, P<10-12). (I) Top-ranked biological pathways which were differentially expressed in sh p53- relative to sh Ctrl-transduced EBV FA-cells at H72; significance values were determined by the hypergeometrical test using the 188 most differentially-expressed genes between p53-silenced and control cells. See also Figure S2.
Figure 4
Figure 4. Knockdown of p53 rescues the hematopoietic defects of murine Fancd2-/- bone marrow
(A) Analysis of LSK (Lin-Sca-1+c-Kit+) cell frequencies in the bone marrow; Fancd2-/- samples are compared to the wild-type (WT) and Fancd2-/-p53-/- samples, respectively. The left panel shows representative examples of flow cytometric plots of Sca-1 and c-Kit staining of lineage negative (Lin-) bone marrow. The right panel shows frequencies of LSK cells in the bone marrow as determined by flow cytometry. Mean values are indicated by horizontal bars; statistical analyses were performed using the t test (*, P<10-3 WT vs Fancd2-/- and Fancd2-/- vs Fancd2-/-p53-/- ; WT vs Fancd2-/-p53-/-, non significant). (B) Analysis of clonal growth of murine bone marrow HSPCs as determined by proliferation of isolated LSK cells in vitro for two weeks in presence of TPO and SCF (left panel), and Cobblestone area-forming cell (CAFC) frequencies of total bone marrow cells on FBMD1 stroma cells by day 28 (right panel). The data are mean from 3 mice per group; statistical analyses were performed using the t test (*; for proliferation, P<10-2 WT vs Fancd2-/- and Fancd2-/- vs Fancd2-/-p53-/-, P<0.05 WT vs Fancd2-/-p53-/-; for CAFC count, P< 0.05 WT vs Fancd2-/- and P<10-2 Fancd2-/- vs Fancd2-/-p53-/-; WT vs Fancd2-/-p53-/-, non significant). (C) Frequencies of binucleated cells in proliferating HSPCs. Bone marrow LSK cells were grown in culture for 48-72 h and stained for microtubules (red), nuclear membrane Lap2 (green) and DNA (blue) to determine the frequencies of binucleated cells. Representative images of binucleated LSK cells are shown in the left panel with original magnification, × 63. The data in the right panel are mean from 4 mice per group; statistical analyses were performed using the t test (*, P<10-3 WT vs Fancd2-/- and P<10-2 Fancd2-/- vs Fancd2-/-p53-/-; WT vs Fancd2-/-p53-/-, non significant). (D) Apoptosis of the bone marrow HSPCs as determined by Annexin V staining. Data are mean from 3 mice per group; statistical analyses were performed using the t test (*, P<0.05 WT vs Fancd2-/- and Fancd2-/- vs Fancd2-/-p53-/-; WT vs Fancd2-/-p53-/-, non significant). (E) Survival of bone marrow in presence of the cytokinesis inhibitor VX-680. Lin- cells from the bone marrow were cultured, exposed to VX-680 for 72 h, and cell survival was determined by counting live cells. The data are mean from 3-4 mice per group. See also Figure S3 and S4.
Figure 5
Figure 5. Silencing p53/p21 expression rescues FA hematopoietic progenitor cell capacities in human in vitro and in vivo models
(A) CFU-GM assays using sh Ctrl- or sh p53-transduced CD34+ bone marrow cells from 14 FA patients. Colonies were counted 12 days after plating 500 CD34+ cells/well in 6-well plate, in duplicates. Mean values are indicated by horizontal bars. Statistical analyses were performed using the Wilcoxon test (*, P< 10-4). Complete data, and data from p21-silenced cells are shown in Table S1. (B) Representative examples of CFU-GM derived colonies from CD34+ cells of a given FA patient. Horizontal bar size = 1000 μm. (C) Design of human FA-like cell xenotransplant experiments. Human cord blood CD34+ cells were transduced overnight with sh FANCD2-GFP or tandem sh FANCD2-TP53-GFP, and injected into sub-lethally irradiated immunodeficient Nod/Scid/IL2-R γc null (NSG) mice. Immunoblot shows FANCD2 and p53 silencing efficiency. (D) Representative flow cytometry analysis of the proportion of donor human cells in mouse peripheral blood as quantified by HuCD45 staining 5 weeks post-transplant. The percentage of blood donor GFP+ cells (transduced cells) is indicated. (E) Chimerism post-xenotransplant of sh FANCD2- or tandem sh FANCD2-TP53-transduced human cord blood CD34+ cells, as assessed by GFP+ cell percentages on blood cell (5 weeks post-transplant, left panel) and bone marrow cell (16 weeks post-transplant, right panel). Each circle represents data from one mouse. Mean values are indicated by horizontal bars. Statistical analysis was performed using the Wilcoxon test (*; at 5 weeks post-transplant, P = 10-2; at 16 weeks post-transplant, P<10-2). See also Table S1.
Figure 6
Figure 6. G0/G1 cell cycle arrest in FA HSPCs
(A) Percentage of cell cycle phases in the CD34+ cells from 6 FA patients and 2 healthy donors (*; P< 10-4 for G0/G1; P< 10-4 for S/G2-M). Data in healthy donors were consistent with previous reports (Gothot et al., 1997). (B) Percentage of Ki67 negative cells in fresh bone marrow cells from 3 FA patients and 2 healthy controls (*, P< 10-4); representative microscopy images for Ki67 staining are shown. (C) Percentage of bone marrow positive cells for γH2AX staining (at least 1 foci) in 5 FA patients and 2 healthy donors (*, P< 10-2); representative microscopy images for γH2AX staining are shown. (D) Healthy human cord blood CD34+ cells were stimulated to enter in cell cycle by cytokines stimulation. After 24 h, cells were transduced by shFANCD2 or shCtrl. Three days later, GFP+ cells were sorted, briefly exposed to MMC (2 h at 100 ng/ml), grown for 5 days in MMC-free medium, and analyzed for cell cycle and proliferation. Cell cycle analysis is shown at time-point D5; G0/G1-S-G2 relative percentages are indicated for each condition. (E) Percentage of Ki67 negative cells from the experiment shown in (D) at D5 (*, P< 10-4). (F) Percentage of γH2AX and 53BP1 positive cells (*, P< 10-6 for γH2AX, and P< 10-5 for 53BP1). (G) Percentage of γH2AX positive cells within the Ki67 negative population. Data of (A), left panels of (D), and (G) were obtained by flow cytometry. Original magnification of microscopy images, × 63. For (A), (B), (C), (E) and (F), the mean value is shown; statistical analyses were performed using the Chi–squared test for trend in proportions.
Figure 7
Figure 7. P21 expression and cell-cycle arrest in embryonic and adult HSPCs from FA patients
(A) CDKN1A/p21 gene expression was analyzed by RT-qPCR in bone marrow CD34+ cells from 13 FA patients and 3 healthy donors. Normalization was performed using the GUS reference gene. CDKN1A values are expressed by fold change relative to the mean expression in healthy donors which was arbitrary attributed to 1. Mean values are indicated by a horizontal bar. Statistical analyses were performed using the Wilcoxon test (*, P<10-2). (B) Top-ranked differentially expressed biological processes between FA and non-FA bulk bone marrow samples; Gene Ontology genesets were scored using the Gene Set Enrichment Analysis (GSEA) and P values were computed using 2000 permutations. The top-ranked GO biological processes are shown. (C) Hierarchical clustering and heat-map of gene expression in FA and non-FA bone marrow samples using the geneset G1_S_TRANSITION_OF_ MITOTIC_CELL_CYCLE. (D) CDKN1A/p21 gene expression was analyzed by RT-qPCR in liver samples from 4 human FA fetus and compared to 6 non-FA fetus from the same term (14-18 weeks of gestation). Normalization and representation of the expression data was performed like in (A). Statistical analyses were performed using the Student test (*, P< 10-3). For (A) and (D), RT-qPCR analysis were performed in an independent set of experiment and normalized to the expression of a second reference gene (ABL1) with consistent results (data not shown). (E) A model for bone marrow failure in FA.

Comment in

Similar articles

Cited by

References

    1. Abbas T, Dutta A. p21 in cancer: intricate networks and multiple activities. Nat Rev Cancer. 2009;9:400–414. - PMC - PubMed
    1. Bagby GC, Meyers G. Bone marrow failure as a risk factor for clonal evolution: prospects for leukemia prevention. Hematology Am Soc Hematol Educ Program. 2007;2007:40–46. - PubMed
    1. Barroca V, Mouthon MA, Lewandowski D, Brunet de la Grange P, Gauthier LR, Pflumio F, Boussin FD, Arwert F, Riou L, Allemand I, et al. Impaired functionality and homing of Fancg-deficient hematopoietic stem cells. Hum Mol Genet. 2011 - PubMed
    1. Bellodi C, Kopmar N, Ruggero D. Deregulation of oncogene-induced senescence and p53 translational control in X-linked dyskeratosis congenita. EMBO J. 2010;29:1865–1876. - PMC - PubMed
    1. Berns K, Hijmans EM, Mullenders J, Brummelkamp TR, Velds A, Heimerikx M, Kerkhoven RM, Madiredjo M, Nijkamp W, Weigelt B, et al. A large-scale RNAi screen in human cells identifies new components of the p53 pathway. Nature. 2004;428:431–437. - PubMed

Publication types

MeSH terms

Substances