. 2012 Jun 10;15(7):998-1006.
doi: 10.1038/nn.3129.

Calcium-channel number critically influences synaptic strength and plasticity at the active zone

Affiliations

Calcium-channel number critically influences synaptic strength and plasticity at the active zone

Jiansong Sheng et al. Nat Neurosci. .

Abstract

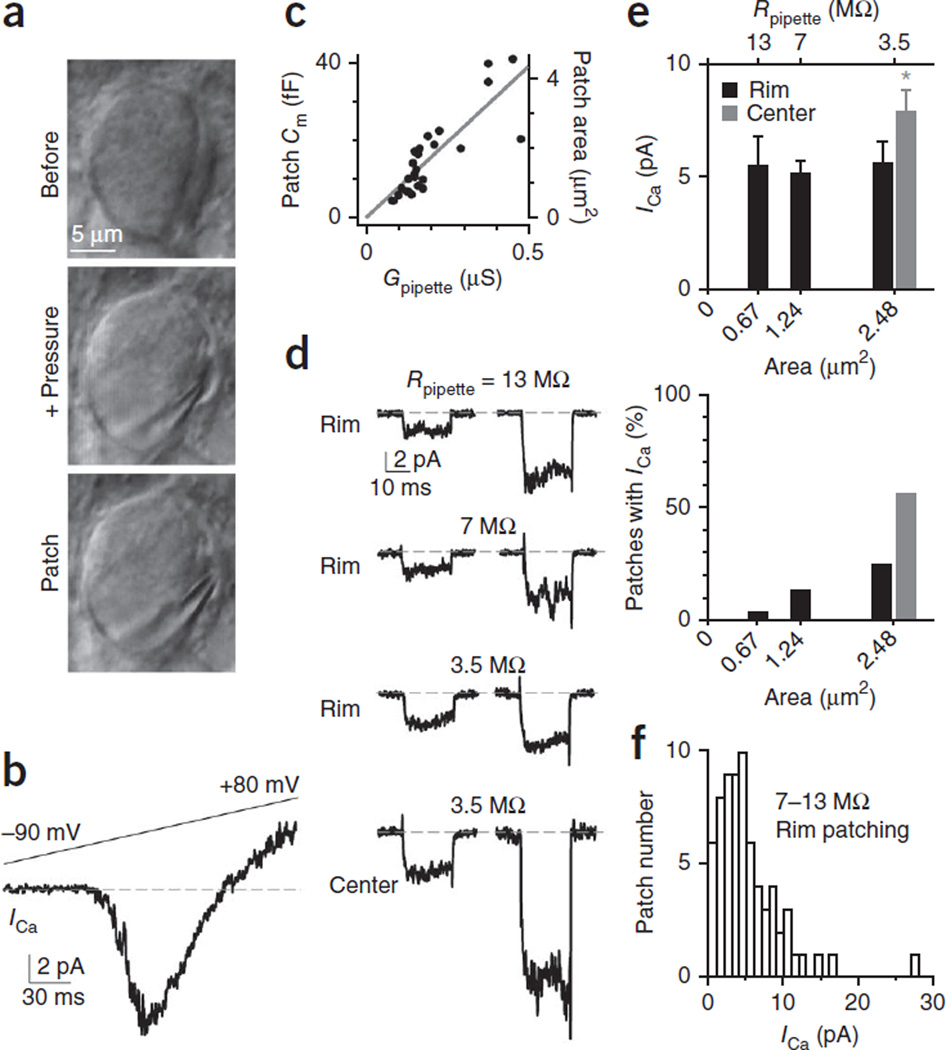
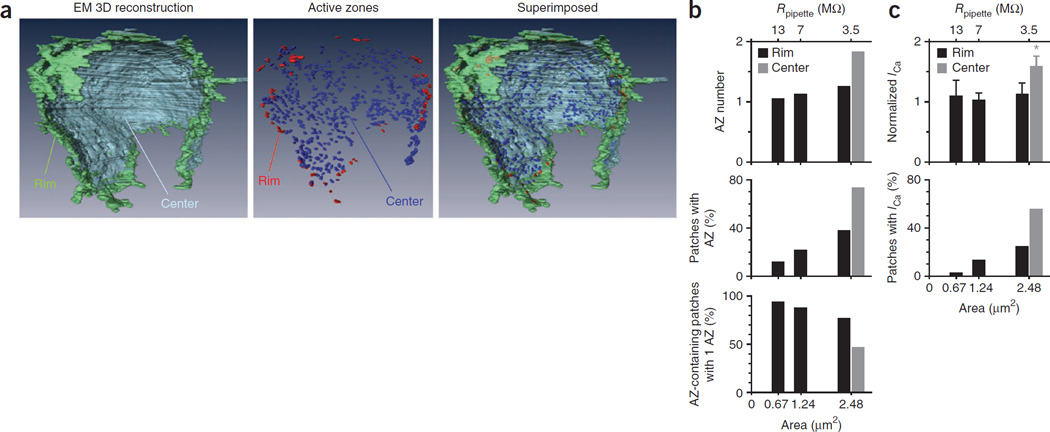
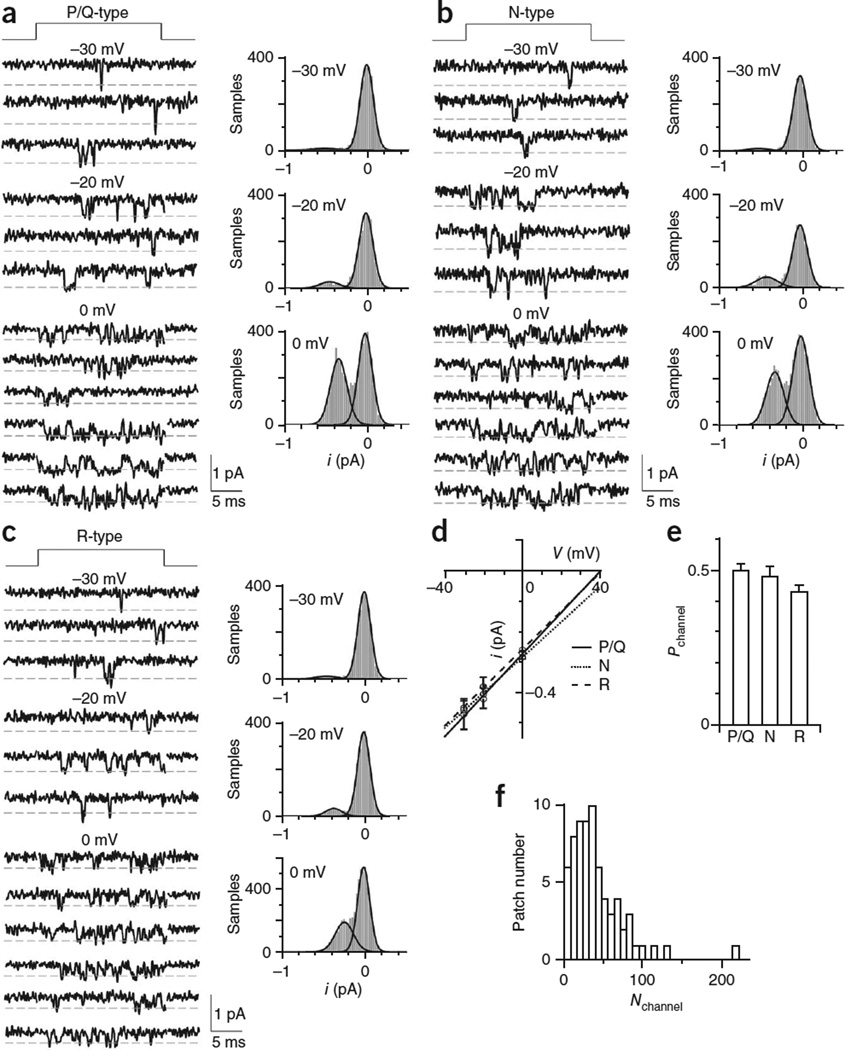
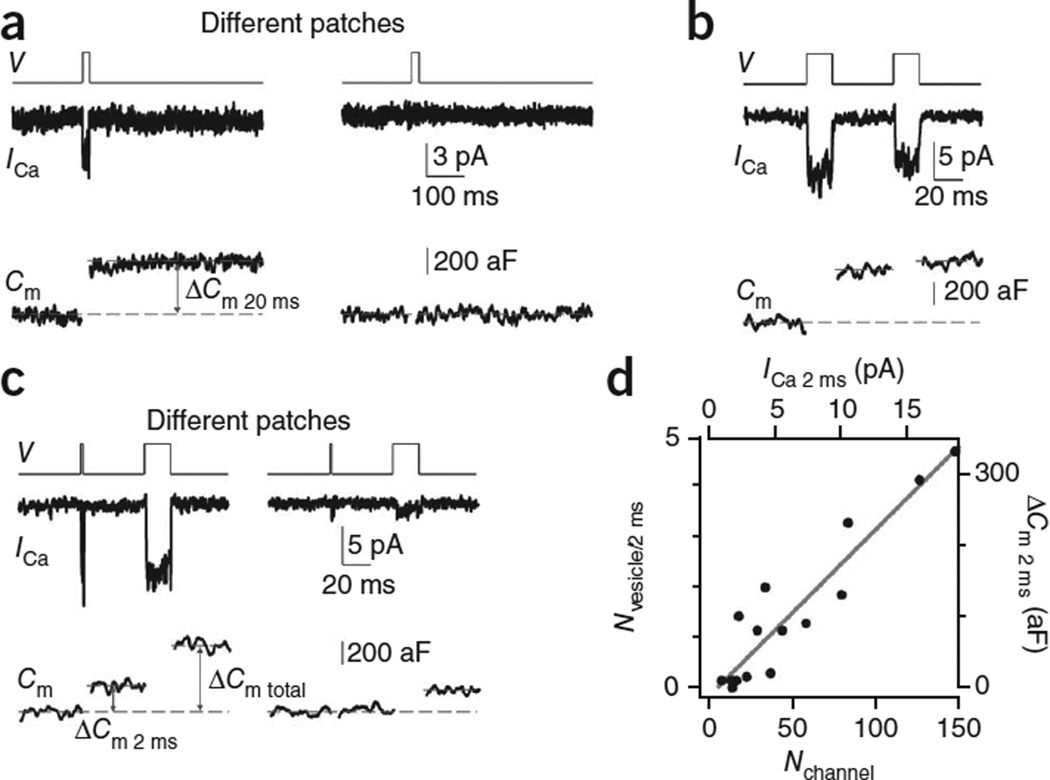
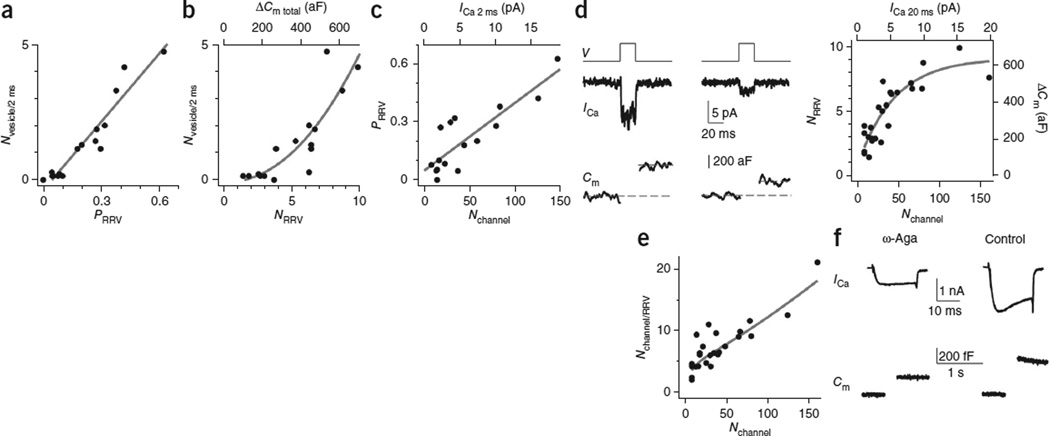
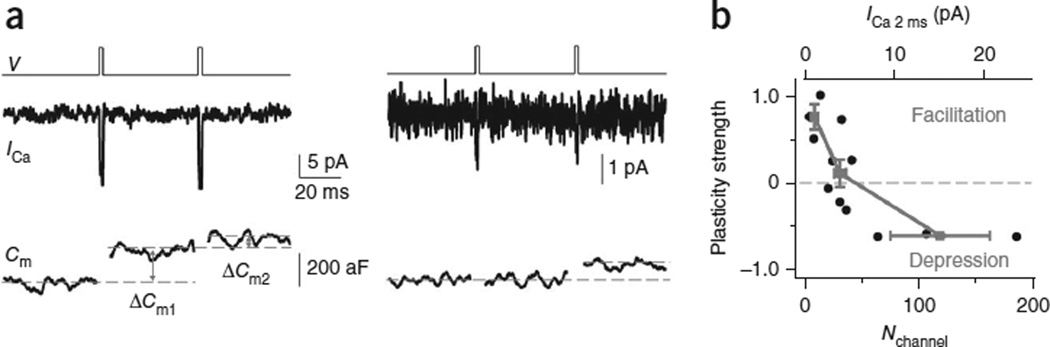
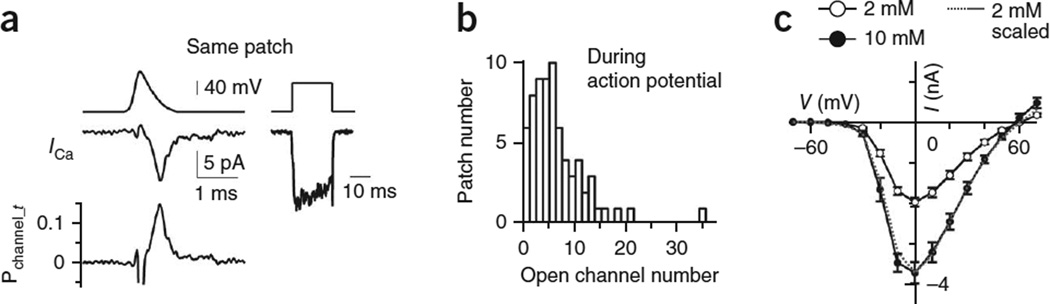
How synaptic-vesicle release is controlled at the basic release structure, the active zone, is poorly understood. By performing cell-attached current and capacitance recordings predominantly at single active zones in rat calyces, we found that single active zones contained 5-218 (mean, 42) calcium channels and 1-10 (mean, 5) readily releasable vesicles (RRVs) and released 0-5 vesicles during a 2-ms depolarization. Large variation in the number of calcium channels caused wide variation in release strength (measured during a 2-ms depolarization) by regulating the RRV release probability (P(RRV)) and the RRV number. Consequently, an action potential opened ∼1-35 (mean, ∼7) channels, resulting in different release probabilities at different active zones. As the number of calcium-channels determined P(RRV), it critically influenced whether subsequent release would be facilitated or depressed. Regulating calcium channel density at active zones may thus be a major mechanism to yield synapses with different release properties and plasticity. These findings may explain large differences reported at synapses regarding release strength (release of 0, 1 or multiple vesicles), P(RRV), short-term plasticity, calcium transients and the requisite calcium-channel number for triggering release.


Figures

Figure 1
Figure 1
Cell-attached patch recording of calcium currents at the calyx release face. (a) Differential infrared contrast (DIC) image of a calyx before (top) and after pressure application (middle) via a pipette that partially separated the calyx from the postsynaptic neuron, and after the cell-attached patch at the calyx release face (bottom, same pipette as in the middle). (b) Sampled current response to a ramp voltage from −90 to +80 mV at a cell-attached patch. Dashed line indicates the baseline. (c) Patch Cm and patch area plotted versus the pipette conductance (Gpipette = 1/resistance). The slope of the linear fit was 78 fF µS−1. The specific Cm was 9 fF µ m−2. (d) Sampled ICa induced by a 20-ms depolarization (from −90 to 0 mV) at the rim region (applies if not mentioned) with pipette resistance (Rpipette) of ~13 MΩ, 7 MΩ or 3.5 MΩ and at the central region with ~3.5 MΩ pipettes. All traces were low-pass-filtered at 2 kHz. Each trace was from a different patch. Dashed line indicates the baseline. (e) ICa amplitude (top, mean ± s.e.m.) and percentage (bottom) of patches exhibiting ICa at the calyx rim and central region (>2 µm deeper) are plotted versus the patch mean membrane area or pipette resistance (Rpipette). Top, rim patching: 13 MΩ, n = 12 patches; 7 MΩ, n = 57 patches; 3.5 MΩ, n = 22 patches. Top, central patching: 3.5 MΩ, n = 20. Bottom, rim patching: 13 MΩ, 12/353 patches; 7 MΩ, 57/425 patches; 3.5 MΩ, 22/88 patches. Bottom, central patching: 3.5 MΩn = 20/36 patches. (f) Patch ICa amplitude distribution from 6–8 (n = 57) and 12–14 MΩ (n = 12) pipettes. Patches with 3–4 MΩ (n = 22) pipettes were not included.
Figure 2
Figure 2
Active-zone density at the calyx release face matches patch electrophysiology. (a) A calyx three-dimentionally reconstructed with electron microscopy (EM; data from ref. 27) showing rim and center of the calyx release face (left), active zones at the rim and central region (middle; each spot represents an active zone) and the two images superimposed (right). The calyx vertical length is ~18 µm. (b) The mean active zone (AZ) number and percentage of patches containing one or more active zone, and the percentage of patching one active zone in patches containing one or more active zones plotted versus the patch membrane area of 13 MΩ, 7 MΩ and 3.5 MΩ pipettes. Data were obtained from simulation with the rim (0.20 active zone µm−2) or central (0.56 active zone µm−2) active-zone density measured from EM data in a. (c) Normalized ICa amplitude (mean ± s.e.m.) and percentage of patches exhibiting IC at the calyx rim and central region (>2 µm deeper) plotted versus the patch mean membrane area or pipette resistance (Rpipette; 13 MΩ, n = 12; 7 MΩ, n = 57; 3.5 MΩ, n = 22). These plots are the same as those in Figure 1e, except that ICa amplitudes were normalized to the mean ICa obtained with 13-MΩ pipettes for comparison with data in b. We multiplied the normalized value by 1.1 so that the normalized ICa amplitude obtained by the 13-MΩ pipettes was the same as the predicted active-zone number of the corresponding pipette in b.
Figure 3
Figure 3
Single calcium-channel conductance and probability of a channel being open (‘open probability’) at the release face. (a–c) Left, sampled single P/Q-type (a), N-type (b) and R-type (c) channel current at indicated voltages (the time of depolarization is shown at the top). Right, all-point histogram of the corresponding traces shown on the left. Curves are Gaussian fits of the data. All traces were low-pass-filtered at 2 kHz. (d) The single-channel i/V curve (mean ± s.e.m.) for P/Q-type (n = 6–11 patches for each data point), N-type (n = 3–6) and R-type (n = 3–7) channels. (e) Pchannel (mean ± s.e.m.) for P/Q-type, N-type and R-type channels 0 mV. (f) Distribution of the patch Nchannel, derived from data in Figure 1f, where ICa was converted to Nchannel using equation (1).
Figure 4
Figure 4
The impact of the calcium-channel number on release strength. (a) ICa (middle) and Cm (lower) induced by a 20 ms depolarization (upper, V) from two patches showing a detectable (left) or undetectable (right) ICa. Dashed lines show how we measured ΔCm. Traces were low-pass–filtered at 1 kHz. The tail current was not as clear as in Figure 1 owing to the higher noise and lower-frequency filtering. (b) Sampled ICa and Cm induced by a pair of 20-ms depolarizations (interval, 50 ms). (c) Sampled ICa and Cm induced by a 2-ms depolarization followed 50 ms later by a 20-ms depolarization from two patches with large (left) and small (right) ICa. (d) Nvesicles/2 msCm 2 ms/70 aF) versus Nchannel (calculated from ICa 2 ms using equation (1)). ΔCm 2 ms and ICa 2 ms are also plotted. The line is a linear fit of data.
Figure 5
Figure 5
Impact of calcium-channel number on the release probability and the number of RRVs. (a) Nvesicle/2 ms plotted versus PRRV ( = ΔCm 2 msCm total). The line is a linear fit of data from 16 patches like those shown in Figure 4c. (b) Nvesicle/2 ms plotted versus NRRVCm total/70 aF). ΔCm totalCm induced by 2-ms and 20-ms depolarization) is also shown. The curve is an exponential fit of data (n = 16 patches). (c) PRRV plotted versus Nchannel (n = 16 patches). ICa 2 ms used to derive Nchannel (with equation (1)) is also shown. (d) Left, sampled ICa and Cm induced by a 20-ms depolarization from two patches with different ICa values. Right, NRRV plotted versus Nchannel (n = 26). ΔCm (right) and ICa 20 ms (upper) used to calculate NRRV and Nchannel are also shown. ΔCm included ΔCm total (for example, Fig. 4c, n = 16) and ΔCm 20 ms (for example, left, n = 10) when the 20-ms depolarization was applied alone. The fitted curve (exponential function) shows that NRRV approaches saturation. Dashed lines show how we measured ΔCm. Traces were low-pass–filtered at 1 kHz. (e) Nchannel/RRV plotted versus Nchannel (n = 26, Nchannel/RRV was derived from d, right). The curve was derived from the fitted curve in d, right. (f) Sampled whole-cell ICa and ΔCm induced by a 20-ms depolarization from two calyces, one in the presence of ω-agatoxin-IVA (ω-Aga; 200 nM, bath, left) and the other in control (right). [Ca2+]o = 2 mM.
Figure 6
Figure 6
The impact of Nchannel on paired-pulse plasticity and the open channel number during an action potential. (a) ICa and Cm induced by a pair of 2-ms depolarization at 50-ms interval from two patches with large (left) and small (right) ICa (different vertical scales). Dashed lines show how we measured ΔCm. Traces were low-pass-filtered at 1 kHz. (b) Paired-pulse strength plotted versus Nchannel (or ICa 2 ms, top). The paired-pulse strength was calculated as (ΔCm2 - ΔCm1)/(ΔCm2 + ΔCm1), where ΔCm1 and ΔCm2 are the ΔCm induced by the first and the second 2-ms depolarization. We did not use paired-pulse ratio because ΔCm1 was 0 in some patches. Data were also divided into three groups based on ICa 2 ms (≤1.7 pA, 2.6 – 5.2 pA, ≥8.1 pA). Their average values (±s.e.m.) are shown (solid squares). The dashed line indicates zero paired-pulse strength, above which is facilitation and below which is depression.
Figure 7
Figure 7
The open calcium-channel number during an action potential. (a) Left, sampled ICa (middle) and Pchannel_t (lower, calculated from equation (2)) during an action potential waveform stimulus (top). Right, ICa (bottom) induced by a 20-ms depolarization at 5 s after the action potential waveform stimulus (same patch as on the left). (b) Open Nchannel distribution during an action potential, derived from data in Figure 3f (c) The calcium channel I/V curve (mean ± s.e.m.) obtained from whole-cell recordings at 2 mM (n = 5 calyces) and 10 mM (n = 5 calyces) extracellular calcium. The curve at 2 mM was also scaled to that at 10 mM to show similar I/V relation in these two conditions.

Comment in

References

    1. Murthy VN, Sejnowski TJ, Stevens CF. Heterogeneous release properties of visualized individual hippocampal synapses. Neuron. 1997;18:599–612. - PubMed
    1. Dobrunz LE, Stevens CF. Heterogeneity of release probability, facilitation, and depletion at central synapses. Neuron. 1997;18:995–1008. - PubMed
    1. Xu-Friedman MA, Harris KM, Regehr WG. Three-dimensional comparison of ultrastructural characteristics at depressing and facilitating synapses onto cerebellar Purkinje cells. J. Neurosci. 2001;21:6666–6672. - PMC - PubMed
    1. Wadiche JI, Jahr CE. Multivesicular release at climbing fiber-Purkinje cell synapses. Neuron. 2001;32:301–313. - PubMed
    1. Zucker RS, Regehr WG. Short-term synaptic plasticity. Annu. Rev. Physiol. 2002;64:355–405. - PubMed

Publication types

Substances