. 2012 Jun 10;15(7):988-97.
doi: 10.1038/nn.3137.

Release probability of hippocampal glutamatergic terminals scales with the size of the active zone

Affiliations

Release probability of hippocampal glutamatergic terminals scales with the size of the active zone

Noemi Holderith et al. Nat Neurosci. .

Erratum in

Abstract

Cortical synapses have structural, molecular and functional heterogeneity; our knowledge regarding the relationship between their ultrastructural and functional parameters is still fragmented. Here we asked how the neurotransmitter release probability and presynaptic [Ca(2+)] transients relate to the ultrastructure of rat hippocampal glutamatergic axon terminals. Two-photon Ca(2+) imaging-derived optical quantal analysis and correlated electron microscopic reconstructions revealed a tight correlation between the release probability and the active-zone area. Peak amplitude of [Ca(2+)] transients in single boutons also positively correlated with the active-zone area. Freeze-fracture immunogold labeling revealed that the voltage-gated calcium channel subunit Cav2.1 and the presynaptic protein Rim1/2 are confined to the active zone and their numbers scale linearly with the active-zone area. Gold particles labeling Cav2.1 were nonrandomly distributed in the active zones. Our results demonstrate that the numbers of several active-zone proteins, including presynaptic calcium channels, as well as the number of docked vesicles and the release probability, scale linearly with the active-zone area.


Figures
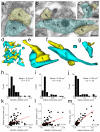
Figure 1
Figure 1
Morphological diversity of glutamatergic axon terminals in the CA3 region of the rat hippocampus. (a-c) Electron micrographs show synaptic contacts of axon collaterals (b, blue) of CA3 pyramidal cells and their postsynaptic spines (s, yellow). Terminals differ in their size, active zone (demarcated by arrowheads, same length as the corresponding PSD) area and the number and the size of the postsynaptic spines. (d) 3D reconstruction of a randomly chosen volume in the stratum oriens. Axon terminals are shown in blue and postsynaptic spines in yellow. (e-g) Higher magnification of three terminals shown in panel d, demonstrating large variability in their size and their postsynaptic spines. (h-j) Distributions of measured parameters in the total reconstructed population of terminals in n = 1 animal. (k-l) Bouton volume shows a weak, but significant correlation with the active zone area (p = 0.0023, n = 68 boutons), while no significant correlation was found with the volume of the individual postsynaptic spines (l, p = 0.081, n = 83 spines). (m) Spine volume and corresponding PSD area are tightly correlated (p < 0.0001, n = 83 spines and PSDs). Scale bars represent 0.2 μm (a-c) and sides of the cubes are 0.2 μm (d) and 0.1 μm (e-g).
Figure 2
Figure 2
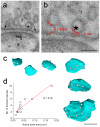
The number of the docked vesicles correlates linearly with the size of the active zone. (a) An electron microscopic image of a synaptic contact between a CA3 pyramidal cell spine (s) and axon terminal (t) in the str. oriens taken from a 20 nm thick electron microscopic section. The postsynaptic density (PSD) is clearly visible and arrows demarcate the active zone. One of the vesicles (*) is closely apposed to the presynaptic membrane. (b) Higher magnification view of the active zone region showing that a gap between the presynaptic- and vesicle membranes can not be resolved, the distance between the middle of the 2 membranes is <5 nm. Vesicles with such a small distance from the active zone plasma membrane are considered to be docked. (c) 3D reconstructions of active zones (light blue) from serial 20 nm thick electron microscopic sections (number of sections used for reconstruction ranged 11 – 22). White spheres correspond to docked vesicles. If a vesicle appeared on consecutive sections in the same position, was considered to be cut in half and was counted as a single vesicle. (d) Active zone area shows a tight, positive correlation with the number of the docked vesicles (n = 15 active zones in n = 1 animal). Scale bars represent: 50 nm (a-b), 200 nm (c)
Figure 3
Figure 3
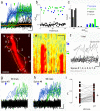
Determining the release probability of axon terminals with optical quantal analysis. (a) Changes in fluorescent intensity measured with line scans in a representative spine head of a CA3 pyramidal cell basal dendrite as a consequence of Ca2+ influx through NMDA receptors. A pair of synaptic responses were evoked by extracellular stimulation (100 ms inter-stimulus interval, the time of the stimuli are indicated by the arrowheads) of local axon collaterals in the str. oriens. Successes for the first and second stimuli are colored in blue and green, respectively. A double event is shown in light blue, whereas failures are shown in black (throughout the figure). Thick traces represent averages. The amplitude values were determined by averaging within a 40 ms window starting 50 ms after the stimuli. (b) Amplitudes of fluorescent responses plotted against time. The peak amplitudes of successes and the fluorescence intensities of failures measured over the same time window were stable (same data as in a). (c) Histograms of response amplitudes demonstrate that failures can be clearly distinguished from successes (same data as in a-b). (d) A two-photon image of a basal dendritic segment with multiple spines. The line indicates the path of the focal spot in line scanning mode. White lines correspond to the segments from where data were collected with a reduced, constant scanning speed. Numbers correspond to individual spines throughout panels d-h. (e) Pseudo-colored representation of the line scans across spine heads and the dendritic shaft vs. scanning time (450 ms). Arrowheads indicate the stimulations. Fluorescence increased rapidly in spine #3 and #9 after the first and the second stimulations, respectively. (f) The same data as in panel e is plotted here in a different way. Fluorescent traces in two dendritic shafts (light grey) and in nine spines (7 did not (black) and two (grey) displayed rapid [Ca2+] transients) are shown. (g-h) 90 superimposed response traces to paired stimulations in spines #3 and #9 demonstrate differences in release probability (PR1st: 0.021 for #3 and 0.1 for #9). (i) Summary graph showing the PR1st and PR2nd of individual spines (black dots; n = 43, n = 14 animals). Means and standard deviations are shown in grey. Note that few synapses had zero PR1st. Red symbols represent electron microscopically analyzed synapses (n = 14). On average, the synapses showed an increase in release probability (paired pulse facilitation). Scale bars represent 50 ms and 0.1 G/GMAX (a, f, g, h), 2 μm (d), 2 μm and 50 ms (e).
Figure 4
Figure 4
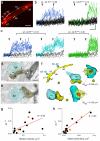
Post hoc ultrastructural analysis of synapses following two-photon imaging. (a) A two-photon image of a CA3 pyramidal cell basal dendritic segment with multiple spines. Two out of seven spines (s2 and s4) displayed [Ca2+] transients in response to extracellular stimulations. (b) Multiple responses to paired extracellular stimulations in s4. Successes for the 1st and 2nd stimuli are separated for clarity. (c) Same as in panel b for spine #2. At higher release probability, there is an increased chance that release occurs for both stimuli (light blue traces) (d-e) Electron micrographs showing presynaptic axon terminals (b2 and b4, pseudo-colored in blue) that established synapses onto the imaged spines (s2, s4, active zones are marked with arrowheads). (f) 3D reconstruction of the whole dendritic segment (yellow) and two axon terminals (b2 and b4 blue, upper left). Enlarged 3D view of the terminals (b2, b4) and the corresponding spines (s2, s4) from 2 different perspectives; on the left the boutons are semitransparent, same direction as the electron microscopic images, on the right the spines are semitransparent and the reconstructions are rotated to achieve an en face view of the active zones (orange). Note the differences in the size of the active zones and the PR1st. Apposing arrows indicate the positions of the electron microscopic sections from which images are shown in panels d-e. (g, h) Bouton volume shows a weak (g, p = 0.038, n = 14 synapses from 6 animals) whereas the active zone area displays a tight and significant (p < 0.0001) positive correlation (h) with the PR1st. Orange dots indicate b2 and b4. Scale bars represent 2 μm (a), 50 ms and 0.1 G/GMAX (b, c), 0.2 μm (d-e), sides of the scale cubes 0.5 μm (f upper left) 0.1 μm (rest of f).
Figure 5
Figure 5
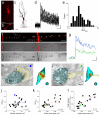
Measurement of volume averaged [Ca2+] transients in CA3 pyramidal cell local axon terminals. (a) Two-photon image of a CA3 pyramidal cell filled with Alexa594 (red) and Fluo5F. (b) Higher magnification view of two boutons. White lines indicate the position of the line scans. (c) Neurolucida reconstruction of the cell shown in panel a. The majority of the axon (red) is truncated for clarity. Boxed area, enlarged in panel f, showing the scanned axon collateral segment. (d) Individual [Ca2+] transients in 25 axon terminals (shown in panel f) of the pyramidal cell. (e) Distribution of the peak amplitudes measured in 4 cells. (f) The two-photon image (upper panel) is superimposed (middle panel) on the transmitted light microscopic image (lower panel) following aldehyde fixation and visualization of the intracellular biocytin with diaminobenzidine. (g) [Ca2+] transients from two boutons are shown (b3, b7). (h-i) Electron microscopic images (left) and 3D reconstructions (right) of two boutons (b3: blue, b7: green) that established excitatory synapses on pyramidal cell spines (yellow, arrowheads demarcate the PSDs). (j) Peak amplitude of the [Ca2+] transients does not correlate with the bouton volume (p = 0.3, n = 27 boutons, n = 4 cells, n = 4 animals). (k) The peak [Ca2+] shows a significant (p < 0.001) positive linear correlation with the active zone area. (l) Total fluxed calcium, calculated from the peak [Ca2+] transients and the volume of the boutons, correlates tightly (p < 0.001) with the active zone area. Blue and green circles represent the two boutons shown in panels h and i, respectively. Grey circles represent the remaining boutons from the string shown in f. Scale bars represent: 50 μm (a, c), 2 μm (b), 50 ms, 0.05 G/GMAX (d, g), 10 μm (f), 0.2 μm (h, i), sides of the cubes: 0.2 μm (h, i)
Figure 6
Figure 6
The Cav2.1 subunit is confined to the active zone of presynaptic axon terminals in the stratum oriens of the hippocampal CA3 area. (a, b) SDS-digested freeze-fracture replica-labeling of the Cav2.1 subunit on the P-face of axon terminals (t) in an adult (a) and a P16 rat (b). Gold particles are enriched in putative active zones of the terminals indicated by the loose cluster of intramembrane particles. (c) The active zone of a presynaptic axon terminal is co-labeled for the Cav2.1 subunit (10 nm gold) and Rim1/2 (15 nm gold) in an adult rat. (d) Gold particles labeling the Cav2.1 subunit (10 nm gold) are concentrated on the P-face of a presynaptic active zone of an excitatory synapse facing the E-face of the postsynaptic membrane enriched in AMPA receptors (15 nm gold). (e) Two Cav2.1 antibodies, one raised in a rabbit (Rb) and another one in a guinea pig (Gp) against different epitopes, label the same presynaptic active zone. (e inset) A high magnification image of the active zone shown in the boxed area in e. (f, g) active zones identified by Rim1/2 immunolabeling (15 nm gold) are co-labeled for the Cav2.1 subunit (10 nm gold) in a Cav2.1+/− mouse (f), but small gold particles labeling the Cav2.1 subunit could not be found in Cav2.1−/− mice (g). Scale bars: 200 nm (a, e), 100 nm (b-d, e inset, f, g).
Figure 7
Figure 7
The number of Cav2.1 subunits and Rim1/2 proteins correlates with the active zone area. (a, b) SDS-FRL labeling of SNAP-25 in a large (a) and a small (b) active zone. (c) Correlation of the number of gold particles labeling SNAP-25 with the active zone area (n = 32 in rat#2). (d) Density of gold particles within presynaptic active zones (mean ± SD = 23.5 ± 30.3, n = 32) and in the surrounding extrasynaptic axonal plasma membranes (mean ± SD = 24.3 ± 13.4, n = 32), in comparison with the background labeling calculated on E-face plasma membranes (mean ± SD = 4.1 ± 10.6, n = 40; psynaptic < 0.01, pextrasynaptic < 0.01). (e, f) SDS-FRL labeling of the Cav2.1 subunit in a large (e) and a small (f) active zone. (g) Correlation of the number of gold particles labeling the Cav2.1 subunit with the active zone area in two rats (rat#1: black open circles, n = 34 active zones; rat#2: red open circles, n = 49 active zones). (h) Density of gold particles labeling the Cav2.1 subunit within presynaptic active zones (mean ± SD = 395.8 ± 154.8, n = 34 in rat#1) and in the surrounding extrasynaptic axonal plasma membrane (mean ± SD = 1.6 ± 2.4, n = 32 in rat#1) in comparison with the background labeling calculated on E-face plasma membranes (mean ± SD = 0.6 ± 2.3, n = 39; psynaptic < 0.01, pextrasynaptic = 0.73). (i, j) SDS-FRL labeling of Rim1/2 in a large (i) and a small (j) active zone. (k) Correlation of the number gold particles labeling Rim1/2 with the active zone area (rat#1: black open circles, n = 32 active zones; rat#2: red open circles, n = 32 active zones). (l) Density of gold particles labeling the Rim1/2 within the presynaptic active zone (mean ± SD = 374.2 ± 110, n = 32 in rat#2) and in the surrounding extrasynaptic axonal plasma membrane (mean ± SD = 6.5 ± 5.4, n = 32 in rat#2), in comparison with the background labeling calculated on E-face plasma membranes (mean ± SD = 1.7 ± 3.3, n = 40; psynaptic < 0.01, p extrasynaptic = 0.025). Scale bars: 200 nm.
Figure 8
Figure 8
Non-random distribution of the Cav2.1 subunits within the active zones. (a-c) Examples of different gold particle distributions within a large (a) and two small (b and c) active zones. (a1) SDS-FRL replica image showing the distribution of gold particles in a large active zone (0.182 μm2). (a2) The same active zone area is covered with a mesh (10 nm). The positions of the 47 gold particles are shown in red. (a3) Cumulative probability distributions of the inter-gold distances of the experimental data (red) and the mean (black) ± SD (grey) of 50 random distributions. R16 (orange) is an individual random distribution (shown in a4). The original gold particle distribution was significantly different (p < 0.01) from all of the 50 random distributions. (a4) Visualization of a random distribution within the active zone. (b1-b4) Same as a1-a4, but for a small synapse (0.025 μm2) that contained only 15 gold particles. (b4) Visualization of two random distributions, one that gave an inter-‘gold’ distance distribution that was significantly different (yellow) and another one that was not different (green) from the data. (c1-c4) Same as a1-a4, but showing a small active zone (0.024 μm2, containing 11 gold particles) in which the inter-gold distance distribution was rarely different (4 out of 50) from random distributions. (d) Percentage of the simulations in which the experimentally determined inter-gold distance distributions were different from random inter-gold distance distributions in individual active zones, plotted as a function of the active zone area (n = 34 active zones, rat #1). The three active zones shown in panels a-c are indicated by the three colored symbols. Note that for large synapses, there is a larger proportion of the active zones in which the distribution of Cav2.1 channels significantly differ from random distribution.

Comment in

References

    1. Schikorski T, Stevens CF. Quantitative ultrastructural analysis of hippocampal excitatory synapses. J. Neurosci. 1997;17:5858–5867. - PMC - PubMed
    1. Shepherd GM, Harris KM. Three-dimensional structure and composition of CA3-CA1 axons in rat hippocampal slices: implications for presynaptic connectivity and compartmentalization. J. Neurosci. 1998;18:8300–8310. - PMC - PubMed
    1. Atwood HL, Karunanithi S. Diversification of synaptic strength: presynaptic elements. Nat. Rev. Neurosci. 2002;3:497–516. - PubMed
    1. Takumi Y, Ramirez-Leon V, Laake P, Rinvik E, Ottersen OP. Different modes of expression of AMPA and NMDA receptors in hippocampal synapses. Nat. Neurosci. 1999;2:618–624. - PubMed
    1. Racca C, Stephenson FA, Streit P, Roberts JD, Somogyi P. NMDA receptor content of synapses in stratum radiatum of the hippocampal CA1 area. J. Neurosci. 2000;20:2512–2522. - PMC - PubMed

Publication types

Substances