. 2012 Jul;18(7):1052-9.
doi: 10.1038/nm.2795.

Profiling of residual breast cancers after neoadjuvant chemotherapy identifies DUSP4 deficiency as a mechanism of drug resistance

Affiliations

Profiling of residual breast cancers after neoadjuvant chemotherapy identifies DUSP4 deficiency as a mechanism of drug resistance

Justin M Balko et al. Nat Med. 2012 Jul.

Abstract

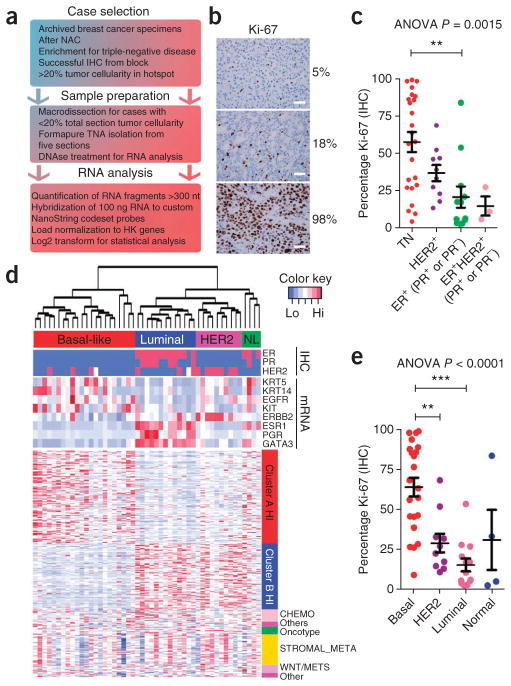
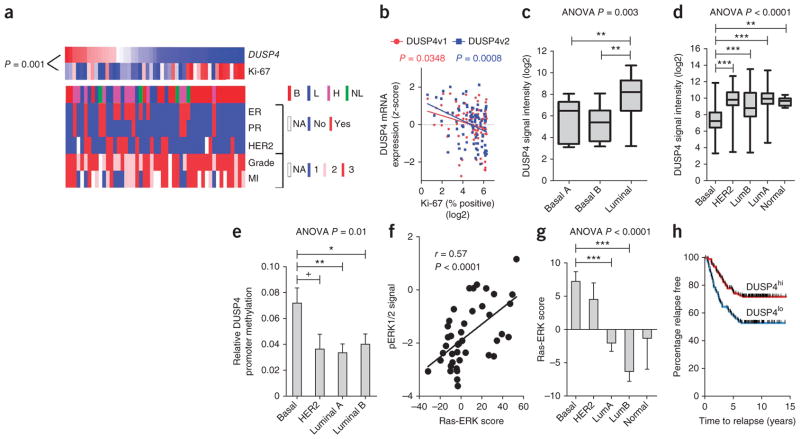
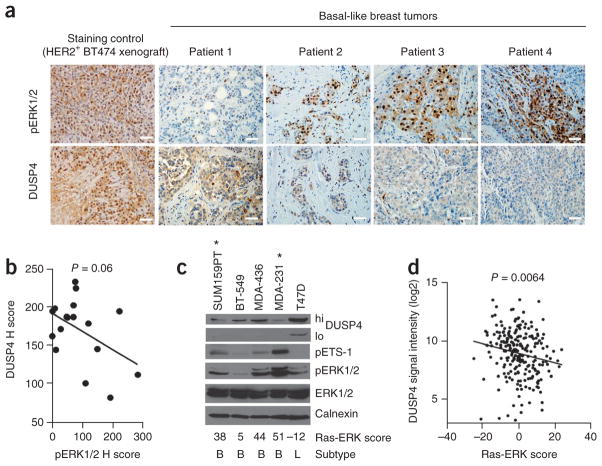
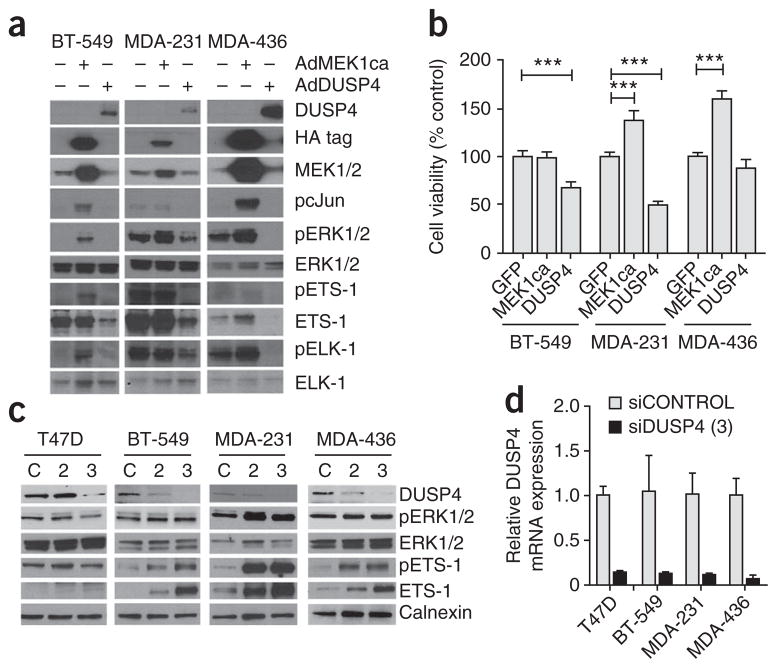
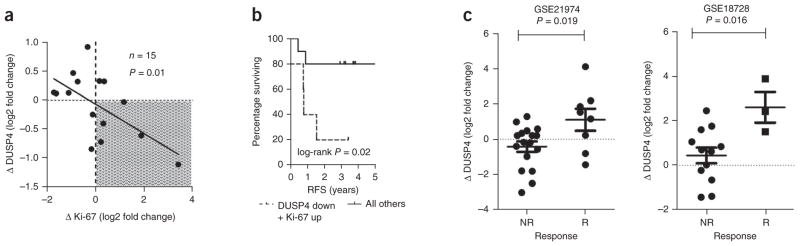
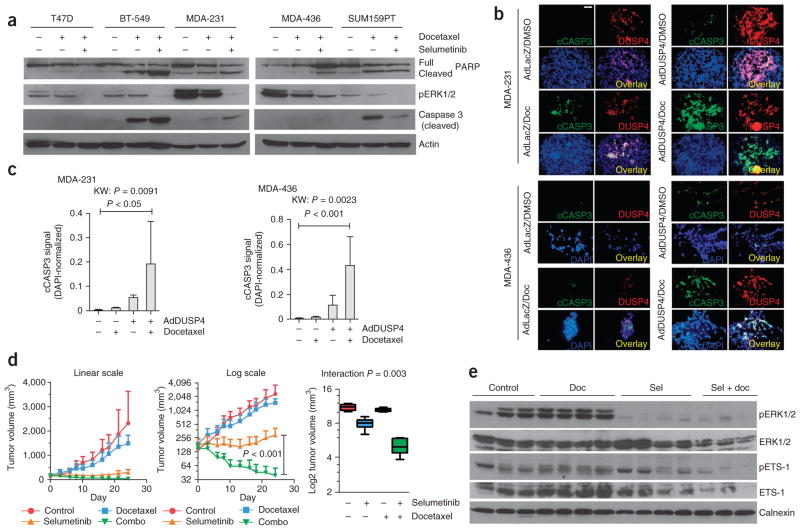
Neoadjuvant chemotherapy (NAC) induces a pathological complete response (pCR) in ~30% of patients with breast cancer. However, many patients have residual cancer after chemotherapy, which correlates with a higher risk of metastatic recurrence and poorer outcome than those who achieve a pCR. We hypothesized that molecular profiling of tumors after NAC would identify genes associated with drug resistance. Digital transcript counting was used to profile surgically resected breast cancers after NAC. Low concentrations of dual specificity protein phosphatase 4 (DUSP4), an ERK phosphatase, correlated with high post-NAC tumor cell proliferation and with basal-like breast cancer (BLBC) status. BLBC had higher DUSP4 promoter methylation and gene expression patterns of Ras-ERK pathway activation relative to other breast cancer subtypes. DUSP4 overexpression increased chemotherapy-induced apoptosis, whereas DUSP4 depletion dampened the response to chemotherapy. Reduced DUSP4 expression in primary tumors after NAC was associated with treatment-refractory high Ki-67 scores and shorter recurrence-free survival. Finally, inhibition of mitogen-activated protein kinase kinase (MEK) synergized with docetaxel treatment in BLBC xenografts. Thus, DUSP4 downregulation activates the Ras-ERK pathway in BLBC, resulting in an attenuated response to anti-cancer chemotherapy.


Conflict of interest statement

COMPETING FINANCIAL INTERESTS

The authors declare competing financial interests: details are available in the online version of the paper.

Figures

Figure 1
Figure 1
Ki-67–associated gene expression in chemotherapy-refractory breast cancers. (a) Scheme for the analysis of gene expression patterns in tumor-sparse FFPE tissues. HK genes, housekeeper genes. (b) Representative IHC of breast cancers after NAC with low, intermediate and high Ki-67 scores. Scale bars, 50 μm. (c) Association of pretreatment receptor status with Ki-67 score after chemotherapy. P = 0.0015 by analysis of variance (ANOVA) followed by Bonferroni post-hoc t test correction. **P < 0.01. TN, triple negative. Data are mean ± s.e.m. (d) Heatmap depicting the gene expression patterns in 49 tumors after NAC assayed by NanoString digital RNA transcript counting. Clinical (HER2, ER, PR) and molecular parameters are annotated for the samples (x axis), and gene signature or metagene membership is annotated for the genes (y axis). Red indicates high expression, and blue indicates low expression. NL, normal-like (e) Ki-67 score after NAC is plotted according to molecular subtype. P < 0.0001 by ANOVA followed by Bonferroni post-hoc t test correction, **P < 0.01, ***P < 0.001.
Figure 2
Figure 2
DUSP4 expression is deficient in BLBC and associates with Ras-ERK pathway activation. (a) Heatmap of the z-score–normalized DUSP4 mRNA transcript counts and Ki-67 scores (shown in Fig. 1c,d) (blue, low transcript counts; red, high transcript counts). The P value shown was calculated by Spearman’s trend test. B, basal-like; L, luminal; H, HER2; MI, mitotic index; NA, not applicable. (b) Association of Ki-67 score and z-score–normalized digital transcript counts for the two known variants of DUSP4, NM_001394 (DUSP4v1) and NM_057158 (DUSP4v2), assayed by NanoString in 89 primary TNBCs treated with NAC. The P values shown were calculated by Pearson’s trend test. (c) Association of molecular subtype (as previously reported) with DUSP4 gene expression (Affymetrix probe set 204014_at) in the ICBP-50 panel of breast cancer cell lines. P = 0.003 by ANOVA followed by Bonferroni post-hoc t test correction. **P < 0.01. (d) Association of molecular subtype and DUSP4 gene expression (204014 _at) in 230 breast tumors from the MAQC-II study. P <0.0001 by ANOVA followed by Bonferroni post-hoc t test correction. **P < 0.01, ***P < 0.001. LumA, luminal A; LumB, luminal B. (e) Association of DUSP4 promoter methylation data with reported molecular subtype in 138 annotated breast tumors. P = 0.01 by ANOVA followed by Bonferroni post-hoc t test correction. +P < 0.1, *P < 0.05, **P < 0.01. (f) Association of the Ras-ERK pathway score (Online Methods) with pERK1/2 signal, as measured by RPPA in 42 of 50 cell lines in the ICBP-50 panel. The P value shown was calculated using Pearson’s trend test. (g) Association of the Ras-ERK pathway score for 230 breast tumors of patients in the MAQC-II study with molecular subtype, as determined by PAM50 analysis. P < 0.0001 by ANOVA followed by Bonferroni post-hoc t test correction.***P < 0.001. (h) Kaplan-Meier analysis of 286 breast tumors (Gene Expression Omnibus accession GSE2034) dichotomized at the median DUSP4 (204014_at) expression. Data in e and g are mean ± s.e.m.
Figure 3
Figure 3
DUSP4 expression is inversely associated with Ras-ERK pathway activation. (a) Four representative BLBC sections stained by IHC for pERK1/2 and DUSP4. A HER2 gene-amplified BT-474 xenograft (pERK1/2hi, DUSP4hi) was included as a control. Scale bars, 50 μm. (b) Association of DUSP4 and pERK1/2 H scores (nuclear and cytoplasmic; see Online Methods for an explanation of H scores). The P value shown was calculated by Pearson’s trend test. (c) Immunoblot analysis of breast cancer cell lines harvested at subconfluence under normal growth conditions. The Ras-ERK score from Figure 2e is noted below. B, basal-like; L, luminal. Asterisks indicate cell lines with a known activating Ras and/or Raf mutation. (d) Association of the Ras-ERK pathway score and DUSP4 gene expression (204014_at). The P value shown was calculated by Pearson’s trend test.
Figure 4
Figure 4
DUSP4 regulates MAPK signaling and cell viability. (a) Immunoblot analysis for MAPK pathway activation after adenoviral transduction with GFP, constitutively active MEK1 (AdMEK1ca), or DUSP4 (AdDUSP4). HA, hemagglutinin. (b) Sulfarhodamine B (SRB) viability analysis of the cells in a 72 h after transduction. Student’s t test, ***P < 0.001. (c) Immunoblot analysis of breast cancer cell lines transiently transfected for 72 h with one of two sequences of siRNA targeting DUSP4 (siDUSP4, 2 or 3) or a nontargeting siRNA control (siCONTROL, C). (d) Quantitative RT-PCR analysis of DUSP4 mRNA expression, normalized to glyceraldehyde 3-phosphate dehydrogenase (GAPDH), 48 h after siRNA transfection with the siDUSP4 construct 3 described in c). Data in b and d are mean ± s.d.
Figure 5
Figure 5
Reduction of DUSP4 expression after NAC correlates with enhanced tumor Ki-67 score and shorter RFS. (a) Association of DUSP4 gene expression and Ki-67 score in 15 breast tumors (paired diagnostic biopsies and surgical specimens after NAC). The P value shown was calculated by Pearson’s trend test. (b) Kaplan-Meier survival analysis of the population from the thatched area in a (loss of DUSP4 (DUSP down) and gain of Ki-67 score (Ki-67 up)) compared to all other tumors. (c) Association of the change in DUSP4 gene expression from paired breast tumors before and after NAC with response to NAC in two published studies,. A two-tailed t test was used to test for differences between patients who had a substantial tumor response (R) to NAC and those that did not (NR).
Figure 6
Figure 6
Pharmacological or genetic inhibition of MEK improves chemotherapy-induced apoptosis in vitro and in vivo. (a) Immunoblot analysis of breast cancer cell lines treated for 6 h with docetaxel or DMSO in normal growth medium, followed by drug washout and treatment with DMSO or selumetinib for 72 h. (b) Immunofluorescence for cleaved caspase 3 and DUSP4 in MDA-231 and MDA-436 cells transduced with adenovirus encoding DUSP4 (AdDUSP4) or LacZ (AdLacZ, control) followed by 24 h of docetaxel (Doc) or DMSO treatment. DUSP4 is shown in red, cleaved caspase 3 (cCASP3) is shown in green, and DAPI is shown in blue. The overlay (yellow) is shown in the lower right quadrant of each group. Scale bar, 50 μm. (c) Quantification of the immunofluorescence in b. FITC (cleaved caspase 3) signals were normalized to DAPI and are shown as mean ± s.d. (n = 5). The Kruskal-Wallis (nonparametric ANOVA equivalent; KW) test was used to test for differences among the groups, with a Dunn’s post-test to compare individual groups. (d) Tumor growth curves of MDA-231 xenografts randomized to treatment with selumetinib, docetaxel, the combination of both (combo) or vehicle control (n = 9 per arm). The results are shown on the linear scale (left) and the log2 scale (center) to visualize the differences in smaller tumors. Boxplot of final tumor volumes (day 24, right). The treatment interaction was tested by two-way ANOVA. Data are mean ± range. (e) Immunoblot analysis of xenografts harvested after 3 d of treatment, 1 h after the last dose of selumetinib (Sel).

References

    1. Levina V, Marrangoni AM, DeMarco R, Gorelik E, Lokshin AE. Drug-selected human lung cancer stem cells: cytokine network, tumorigenic and metastatic properties. PLoS ONE. 2008;3:e3077. - PMC - PubMed
    1. Morel AP, et al. Generation of breast cancer stem cells through epithelial-mesenchymal transition. PLoS ONE. 2008;3:e2888. - PMC - PubMed
    1. Creighton CJ, et al. Residual breast cancers after conventional therapy display mesenchymal as well as tumor-initiating features. Proc Natl Acad Sci USA. 2009;106:13820–13825. - PMC - PubMed
    1. Calcagno AM, et al. Prolonged drug selection of breast cancer cells and enrichment of cancer stem cell characteristics. J Natl Cancer Inst. 2010;102:1637–1652. - PMC - PubMed
    1. Geiss GK, et al. Direct multiplexed measurement of gene expression with color-coded probe pairs. Nat Biotechnol. 2008;26:317–325. - PubMed

Publication types

MeSH terms

Substances