. 2012 Sep;26(9):3901-15.
doi: 10.1096/fj.12-208975. Epub 2012 Jun 8.

In vivo evidence for a novel pathway of vitamin D₃ metabolism initiated by P450scc and modified by CYP27B1

Affiliations

In vivo evidence for a novel pathway of vitamin D₃ metabolism initiated by P450scc and modified by CYP27B1

Andrzej T Slominski et al. FASEB J. 2012 Sep.

Abstract

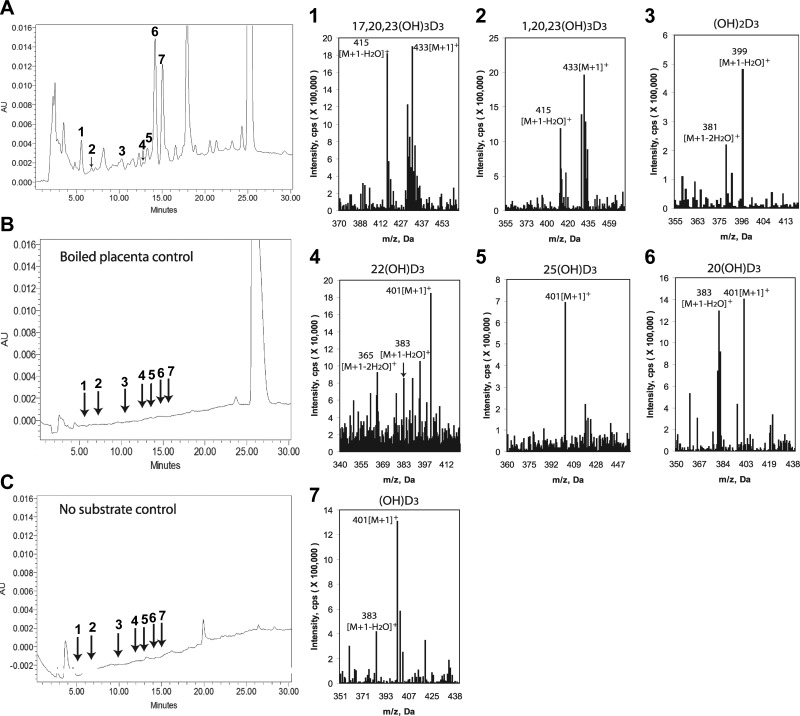
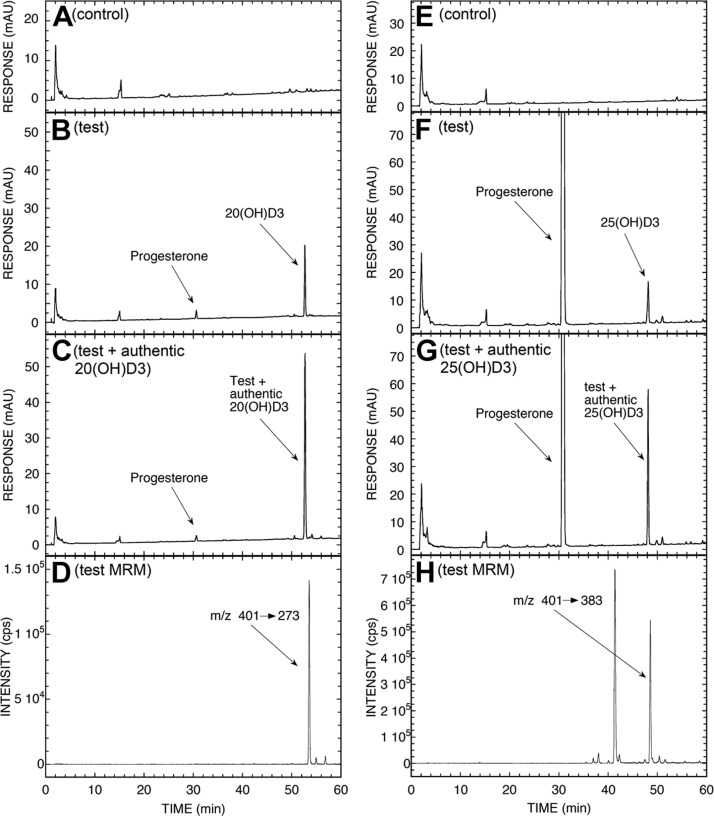
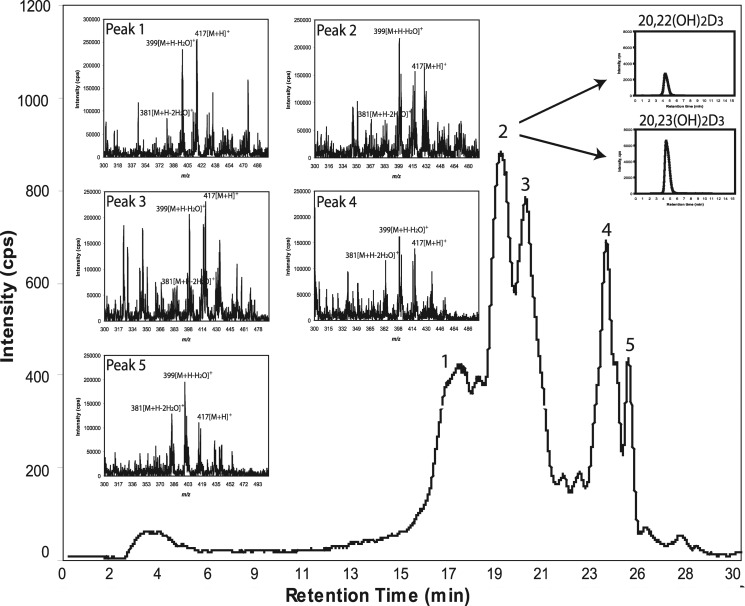
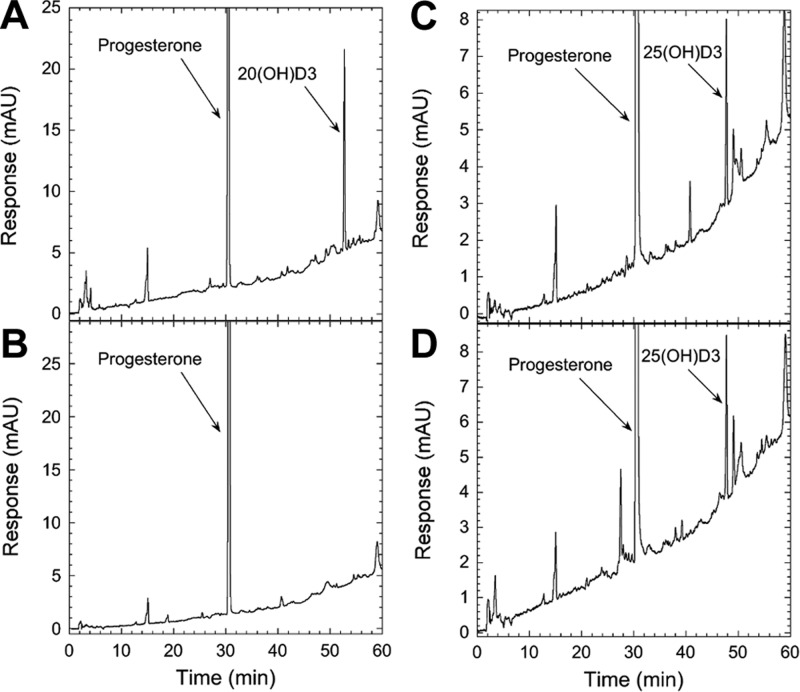
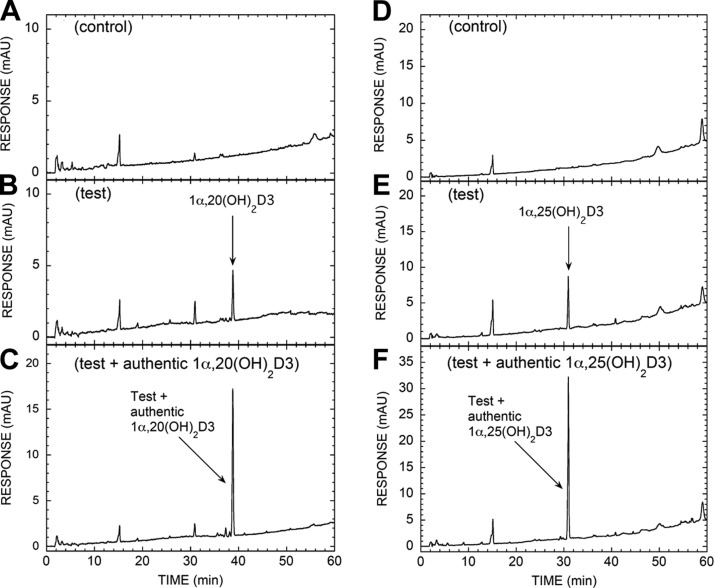
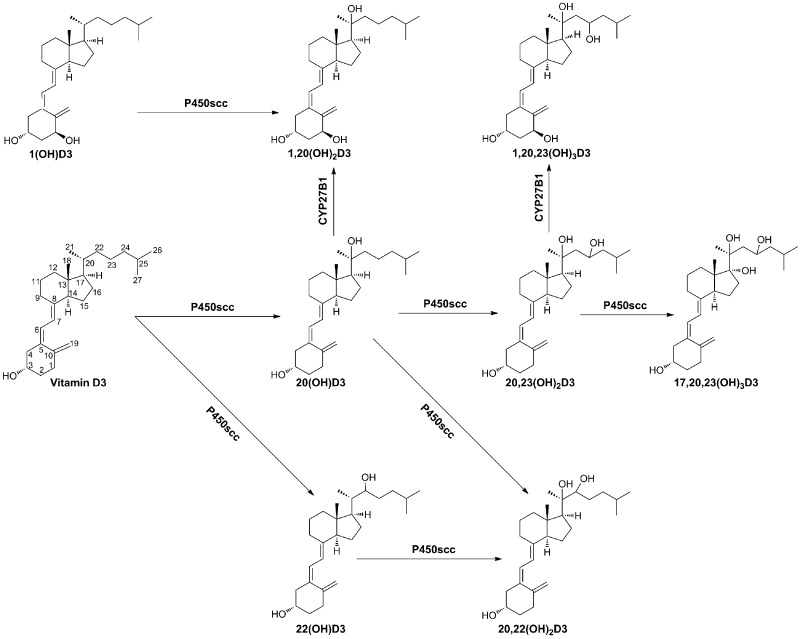
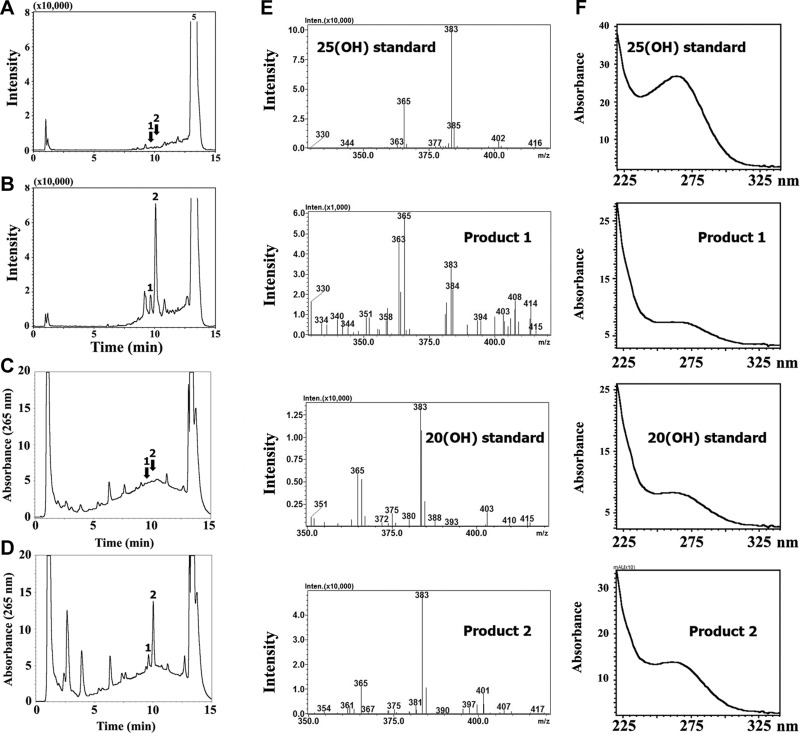
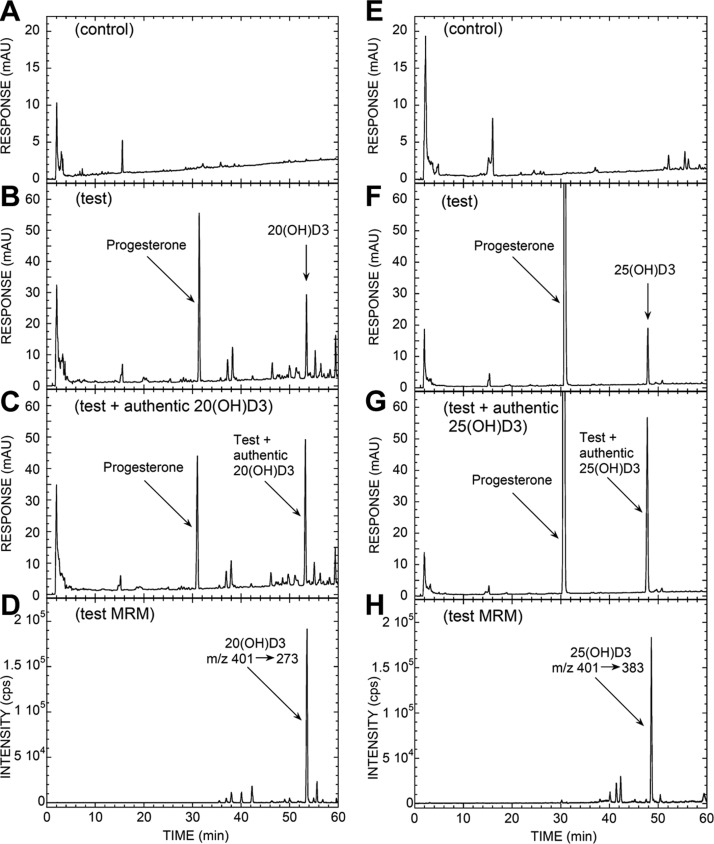
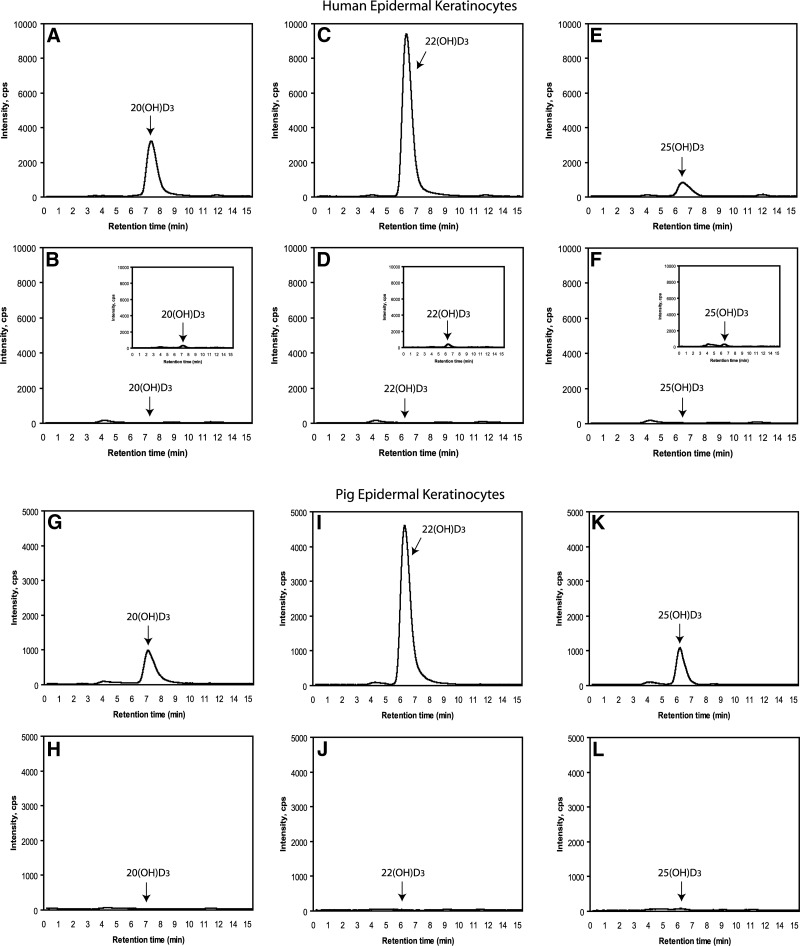
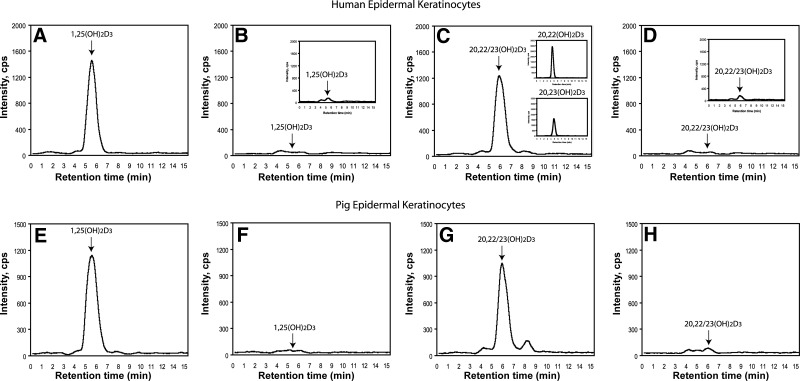
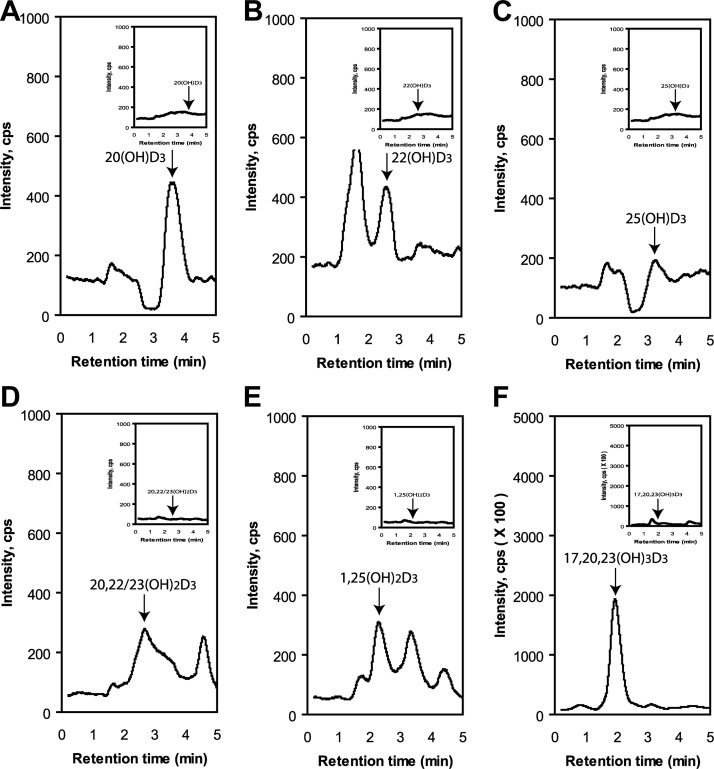
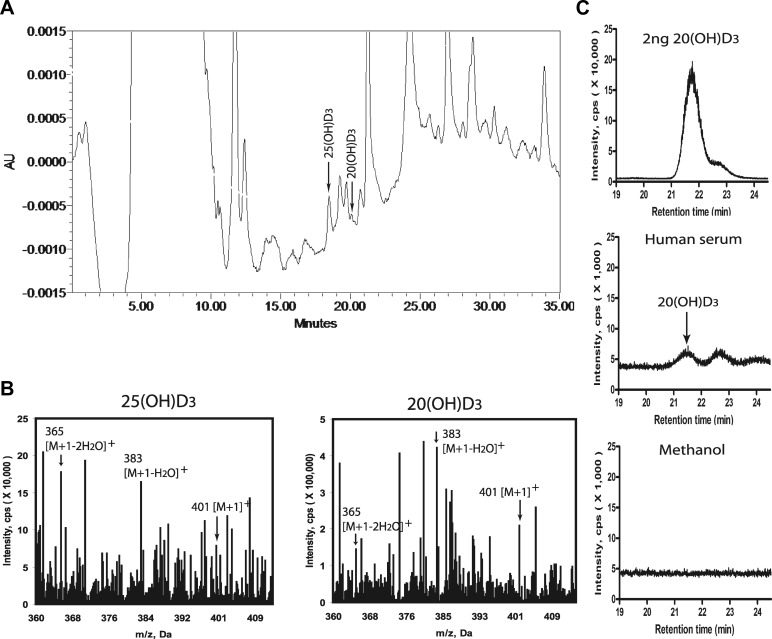
We define previously unrecognized in vivo pathways of vitamin D(3) (D3) metabolism generating novel D3-hydroxyderivatives different from 25-hydroxyvitamin D(3) [25(OH)D3] and 1,25(OH)(2)D3. Their novel products include 20-hydroxyvitamin D(3) [20(OH)D3], 22(OH)D3, 20,23(OH)(2)D3, 20,22(OH)(2)D3, 1,20(OH)(2)D3, 1,20,23(OH)(3)D3, and 17,20,23(OH)(3)D3 and were produced by placenta, adrenal glands, and epidermal keratinocytes. We detected the predominant metabolite [20(OH)D3] in human serum with a relative concentration ∼20 times lower than 25(OH)D3. Use of inhibitors and studies performed with isolated mitochondria and purified enzymes demonstrated involvement of the steroidogenic enzyme cytochrome P450scc (CYP11A1) as well as CYP27B1 (1α-hydroxylase). In placenta and adrenal glands with high CYP11A1 expression, the predominant pathway was D3 → 20(OH)D3 → 20,23(OH)(2)D3 → 17,20,23(OH)(3)D3 with further 1α-hydroxylation, and minor pathways were D3 → 25(OH)D3 → 1,25(OH)(2)D3 and D3 → 22(OH)D3 → 20,22(OH)(2)D3. In epidermal keratinocytes, we observed higher proportions of 22(OH)D3 and 20,22(OH)(2)D3. We also detected endogenous production of 20(OH)D3, 22(OH) D3, 20,23(OH)(2)D3, 20,22(OH)(2)D3, and 17,20,23(OH)(3)D3 by immortalized human keratinocytes. Thus, we provide in vivo evidence for novel pathways of D3 metabolism initiated by CYP11A1, with the product profile showing organ/cell type specificity and being modified by CYP27B1 activity. These findings define the pathway intermediates as natural products/endogenous bioregulators and break the current dogma that vitamin D is solely activated through the sequence D3 → 25(OH)D3 → 1,25(OH)(2)D3.


Figures

Figure 1.
Figure 1.
Detection of novel D3 hydroxyderivatives in human placenta incubated ex utero (A) that were absent in negative controls comprising boiled placenta incubated with vitamin D substrate (B) or placenta incubated without the substrate (C). Peaks with RTs corresponding to the synthetic standards were numbered as follows and submitted for LC/MS: 1) 17,20,23(OH)3D3; 2) 1,20,23(OH)3) 20,23(OH)2D3, 1,20(OH)2D3, and 1,25(OH)2D3; 4) 22(OH)D3; 5) 25(OH)D3; 6) 20(OH)D3. Other major peaks were analyzed, of which only peak 7 shows mass spectrum of monohydroxyvitamin D3 and is marked as (OH)D3 because its structure is unknown. Right panels show mass spectra of peaks 1–7.
Figure 2.
Figure 2.
LC-MS/MS analysis of 20(OH)D3 (A–D) and 25(OH)D3 (E–H) produced by placental mitochondria and partially purified by TLC. Mitochondria were incubated with 200 μM D3 for 4 h and analyzed by TLC and HPLC as described in Materials and Methods. A) Chromatogram of control reaction with NADP and isocitrate omitted. B) Test reaction. C) Extract of test reaction spiked with authentic 20(OH)D3. D) Analysis via LC-MS/MS, used in the MRM mode, of the test reaction following the parent to product transition m/z 401 → 273. E) Chromatogram of control reaction with NADP and isocitrate omitted. F) Test reaction. G) Extract of test reaction spiked with authentic 25(OH)D3. H) Analysis via LC-MS/MS, used in MRM mode, of test reaction following parent to product transition m/z 401 → 383.
Figure 3.
Figure 3.
LC-MS/MS identification of dihydroxyderivatives of D3 produced by placental fragments using the MRM transition (m/z 417→381). Insets: total ion scan for each peak. Peaks with RTs of the corresponding standards were numbered as follows: 1) 1,25(OH)2D3; 2) 20,23(OH)2D3 + 20,22(OH)2D3; 3) 1,20(OH)2D3. Peaks 4 and 5 represent unknown compounds. Peak 2 was separated with a gradient of acetonitrile in water to collect fractions with RTs corresponding to 20,23(OH)2D3 or 20,22(OH)2D3 standards. These fractions were analyzed separately by LC-MS/MS in MRM mode, as shown in insets.
Figure 4.
Figure 4.
22R-hydroxycholesterol inhibits production of 20(OH)D3 but not of 25(OH)D3 by placental mitochondria. Placental mitochondria were incubated with 200 μM D3 for 4 h at 37°C; products were partially purified by TLC and analyzed by RP-HPLC. A) Test reaction showing HPLC chromatogram of the 20(OH)D3 TLC zone products. B) 20(OH)D3 TLC zone for reaction carried out in the presence of 100 μM 22R-hydroxycholesterol. C) Test reaction showing HPLC chromatogram of 25(OH)D3 TLC zone products. D) 25(OH)D3 TLC zone for reaction carried out in the presence of 100 μM 22R-hydroxycholesterol.
Figure 5.
Figure 5.
Placental mitochondria metabolize 20(OH)D3 to 1,20(OH)2D3, with the expected transformation of 25(OH)D3 to 1,25(OH)2D3 serving as a positive control. Placental mitochondria were incubated with 60 μM 20(OH)D3 (A–C) or 150 μM 25(OH)D3 (D–F) for 4 h at 37°C; products were partially purified by TLC and analyzed by RP-HPLC, as described in Materials and Methods. A) HPLC chromatogram of 1α,20(OH)2D3 TLC zone for control reaction with NADP and isocitrate omitted, B) Test reaction showing HPLC chromatogram of 1α,20(OH)2D3 TLC zone products. C) Extract of test reaction spiked with authentic 1α,20(OH)2D3. D) HPLC chromatogram of 1α,25(OH)2D3 TLC zone for control reaction with NADP and isocitrate omitted. E) Test reaction showing HPLC chromatogram of 1α,25(OH)2D3 TLC zone products. F) Extract of test reaction spiked with authentic 1α,25(OH)2D3.
Scheme 1.
Scheme 1.
Proposed novel in vivo pathways of D3 metabolism initiated by cytochrome P450scc and modified by CYP27B1.
Figure 6.
Figure 6.
Rat adrenal glands transform D3 to 20(OH)D3 with markedly lower production of 25(OH)D3. A–D) Boiled (A, C) or viable fragments of adrenal glands (B, D) were incubated with D3, and products of the metabolism were analyzed both by LC-MS in the SIM mode for ions with m/z 383 corresponding to [M+1−H2O]+ of monohydroxyvitamin D3 (A, B), and UV analysis (C, D). Peaks 1 and 2 had RT 9.6 min and 10.03 min, corresponding to the 25(OH)D3 and 20(OH)D3 standards, respectively. E, F) Mass (E) and UV spectra (F) of the corresponding peaks and standards that were identical.
Figure 7.
Figure 7.
LC-MS analysis of 20(OH)D3 (A–D) and 25(OH)D3 (E–H) produced by bovine adrenal mitochondria. Mitochondria were incubated with 200 mM D3 for 4 h, and products were separated by TLC prior to HPLC analysis, as described in Materials and Methods. A) Chromatogram of control reaction with NADP and isocitrate omitted. B) Test reaction. C) Extract of test reaction spiked with authentic 20(OH)D3. D) Analysis via LC-MS/MS, used in the MRM mode, of the test reaction following the parent-to-product transition m/z 401 → 273. E) Chromatogram of control reaction with NADP and isocitrate omitted. F) Test reaction. G) Extract of test reaction spiked with authentic 25(OH)D3. H) Analysis via LC-MS/MS, used in the MRM mode, of the test reaction following the parent to product transition 401 → 383.
Figure 8.
Figure 8.
Production of 20(OH)D3 (A, B, G, H), 22(OH)D3 (C, D, I, J), and 25(OH)D3 (E, F, K, L) by human HaCaT keratinocytes (A–F) and epidermal keratinocytes isolated from pig skin (G–L) incubated with 50 μM D3. After extraction of cell suspensions with dichloromethane, the products were separated by HPLC. Peaks with RTs corresponding to the standards were collected and were then subjected to LC-MS/MS with an ESI source using MRM for the transition m/z 401 → 383 (see Materials and Methods). A, C, E, G, I, K) Experimental incubations. B, D, F, H, J, L) Negative controls incubated without D3. Insets: cells extracted immediately after addition of D3 (time 0).
Figure 9.
Figure 9.
Production of 20,23(OH)2D3 and of 20,22(OH)2D3 (C, D, G, H) in comparison to 1,25(OH)2D3 (A, B, E, F) by human HaCaT keratinocytes (A–D) and epidermal keratinocytes isolated from pig skin (E–H). The HPLC fractions with RT corresponding to a mixture of 20,22(OH)2D3 and 20,23(OH)2D3 and to 1,25(OH)2D3 were further separated from each other and analyzed by LC-MS/MS by ESI with MRM for the transition m/z 417 → 399. A, C, E, G) Experimental incubations. B, D, F, H) Negative controls incubated without D3. Insets: LC-MS/MS in MRM mode of fractions with RT corresponding to 20,22(OH)2D3 and 20,23(OH)2D3 standards, after their separation by HPLC using an acetonotrile/water gradient (C); cells extracted immediately after addition of D3 (time 0; B, D).
Figure 10.
Figure 10.
LC-MS/MS detection of endogenously produced 20(OH)D3 (A); 22(OH)D3 (B, C); 25(OH)D3, 20,22/23(OH)2D3 (D); 1,25(OH)2D3 (E); and 17,20,23(OH)3D3 (F). The HPLC fractions with RTs corresponding to each hydroxyvitamin D3 (see Supplemental Fig. S1) were analyzed by LC-MS/MS by ESI with MRM for the transition of m/z = 401 [M+1]+ → 383 [M+1−H2O]+ for monohydroxyvitamin D3, m/z = 417 [M+1]+ → 399 [M+1−H2O]+ for dihydroxyvitamin D3, and SIM for m/z = 415 [M+1−H2O]+ for trihydroxyvitamin D3. Insets: methanol control.
Figure 11.
Figure 11.
Detection of 20(OH)D3 in human serum. A) HPLC chromatogram of the serum extract. B) MS analyses of the peak corresponding to the RT of 25(OH)D3 and a minor peak corresponding to 20(OH)D3. Values for m/z 401, 383, and 365 correspond to the [M+1]+, [M+1−H2O]+, and [M+1−2H2O]+ of monohydroxyvitamin D3. C) LC-MS analysis of the peak corresponding to 20(OH)D3 in the SIM mode demonstrated m/z = 383 with an identical RT to 20(OH)D3 that was absent in the negative control (solvent run after the experimental sample).

Similar articles

Cited by

References

    1. Holick M. F., Tian X. Q., Allen M. (1995) Evolutionary importance for the membrane enhancement of the production of vitamin D3 in the skin of poikilothermic animals. Proc. Natl. Acad. Sci. U. S. A. 92, 3124–3126 - PMC - PubMed
    1. Bikle D. D. (2011) Vitamin D metabolism and function in the skin. Mol. Cell. Endocr. 347, 80–89 - PMC - PubMed
    1. Holick M. F. (2003) Vitamin D: A millennium perspective. J. Cell. Biochem. 88, 296–307 - PubMed
    1. Holick M. F. (2007) Vitamin D deficiency. N. Engl. J. Med. 357, 266–281 - PubMed
    1. Plum L. A., DeLuca H. F. (2010) Vitamin D, disease and therapeutic opportunities. Nat. Rev. Drug Discov. 9, 941–955 - PubMed

Publication types

Substances