

Comparing regional infant death rates: the influence of preterm births <24 weeks of gestation
- PMID: 22684158
- PMCID: PMC3582045
- DOI: 10.1136/fetalneonatal-2011-301359
Comparing regional infant death rates: the influence of preterm births <24 weeks of gestation
Abstract
Objective: To investigate regional variation in the registration of preterm births <24 weeks of gestation and the impact on infant death rates for English Primary Care Trusts (PCTs).
Design: Cohort study.
Setting: England.
Participants: All registered births (1 January 2005-31 December 2008) by gestational age and PCT (147 trusts) linked to infant deaths (up to 1 year of life). Late-fetal deaths at 22 and 23 weeks gestation (1 January 2005-31 December 2006).
Main outcome measures: Extremely preterm (<24 weeks) birth rate per 1000 live births and percentage of births registered as live born by PCT. Infant death rate and rank of mortality for (1) all live births and (2) live births over 24 weeks gestation by PCT.
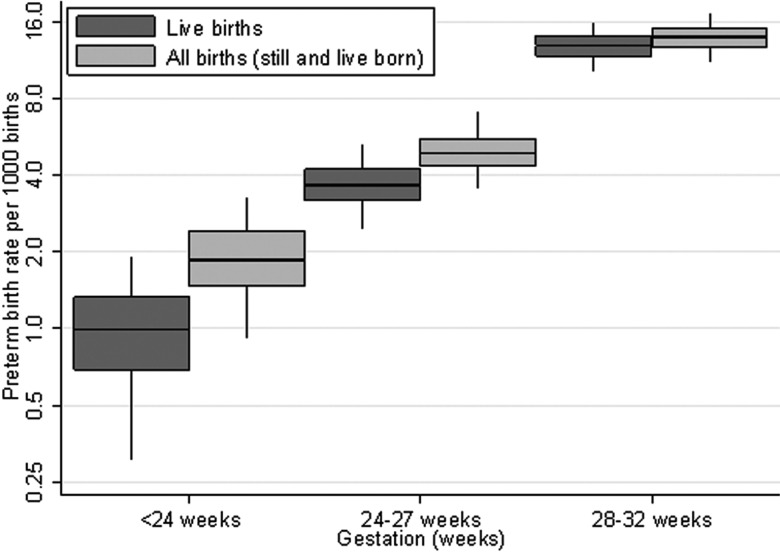
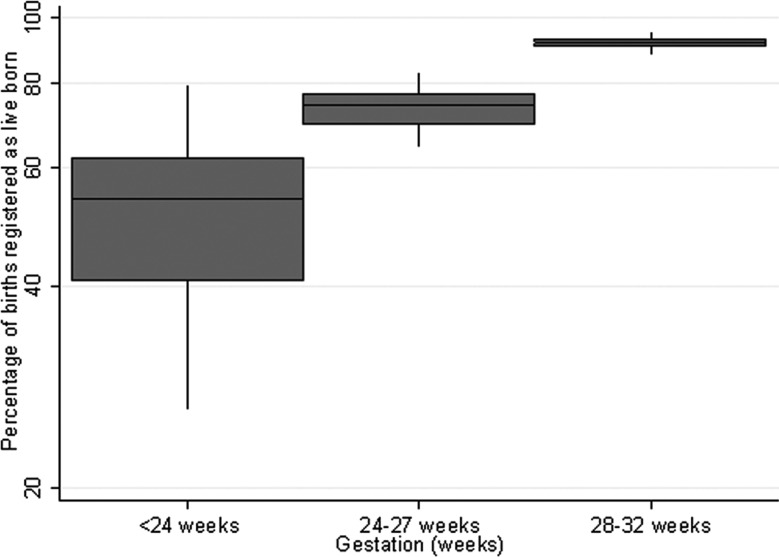
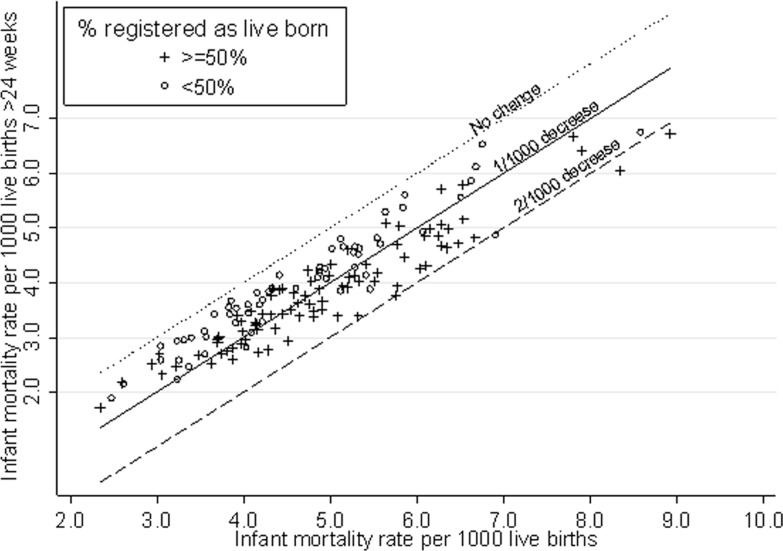
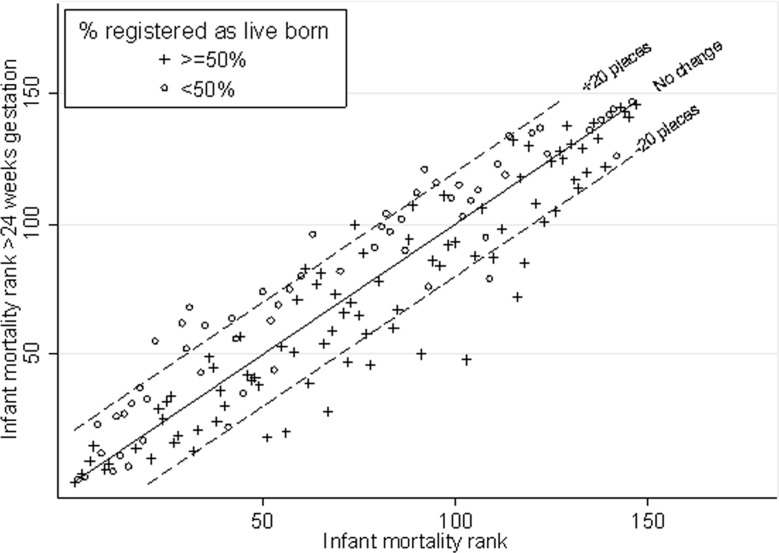
Results: Wide between-PCT variation existed in extremely preterm birth (<24 weeks) rates (per 1000 births) (90% central range (0.31, 1.91)) and percentages of births <24 weeks of gestation registered as live born (median 52.6%, 90% central range (26.3%, 79.5%)). Consequently, the percentage of infant deaths arising from these births varied (90% central range (6.7%, 31.9%)). Excluding births <24 weeks, led to significant changes in infant mortality rankings of PCTs, with a median worsening of 12 places for PCTs with low rates of live born preterm births <24 weeks of gestation compared with a median improvement of four ranks for those with higher live birth registration rates.
Conclusions: Infant death rates in PCTs in England are influenced by variation in the registration of births where viability is uncertain. It is vital that this variation is minimised before infant mortality is used as indicator for monitoring health and performance and targeting interventions.
Conflict of interest statement
Figures
Comment in
-
Benchmarking in neonatal intensive care: obstetrical and neonatal practices and registration policies may influence outcome data.Arch Dis Child Fetal Neonatal Ed. 2013 Mar;98(2):F96-7. doi: 10.1136/archdischild-2012-301880. Epub 2012 Nov 9. Arch Dis Child Fetal Neonatal Ed. 2013. PMID: 23144008 No abstract available.
References
-
- EURO-PERISTAT project with SCPE & Eurocat & Euroneostat. European Perinatal Health Report, 2008
-
- OECD Health data Statistics and indicators. Paris, 2010
-
- Draper ES. Evaluating and comparing neonatal outcomes. Arch Dis Child Fetal Neonatal Ed 2010;95:F158–9 - PubMed
-
- Kramer MS, Platt RW, Yang H, et al. Registration artifacts in international comparisons of infant mortality. Paediatr Perinat Epidemiol 2002;16:16–22 - PubMed
Publication types
MeSH terms
Grants and funding
LinkOut - more resources
Full Text Sources