. 2012 Jun 10;14(7):659-65.
doi: 10.1038/ncb2521.

The H19 lincRNA is a developmental reservoir of miR-675 that suppresses growth and Igf1r

Affiliations

The H19 lincRNA is a developmental reservoir of miR-675 that suppresses growth and Igf1r

Andrew Keniry et al. Nat Cell Biol. .

Abstract

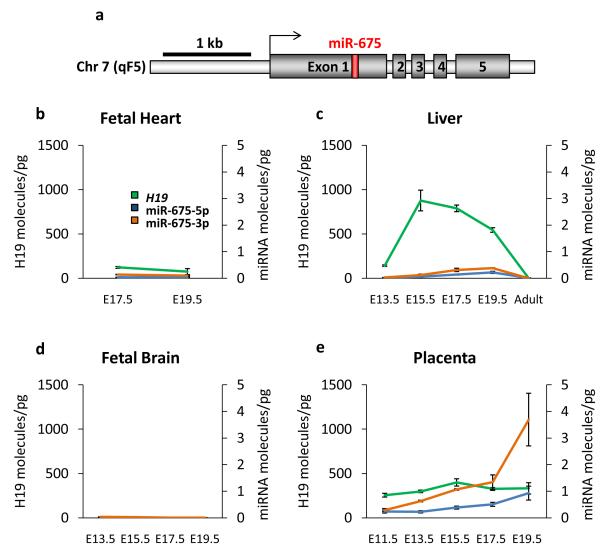
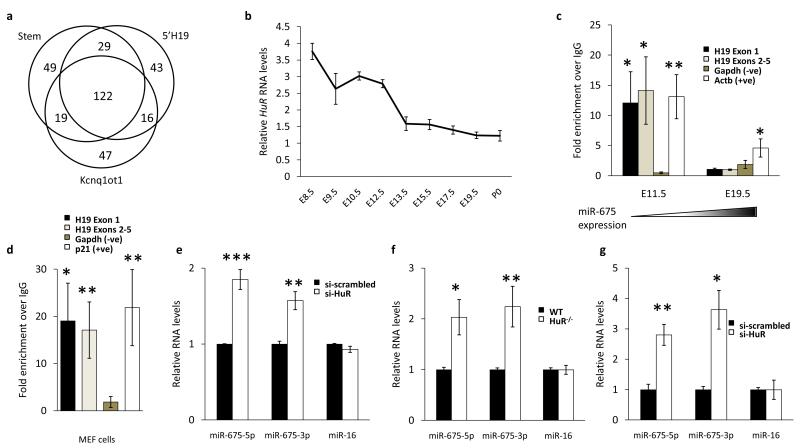
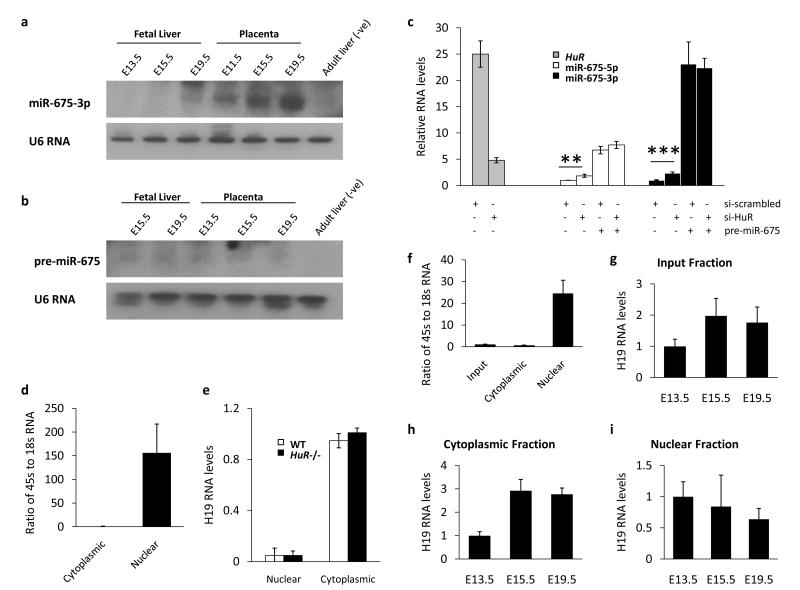
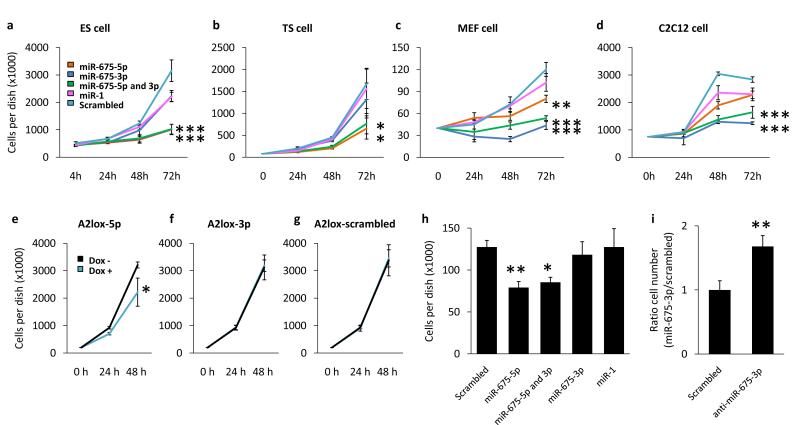
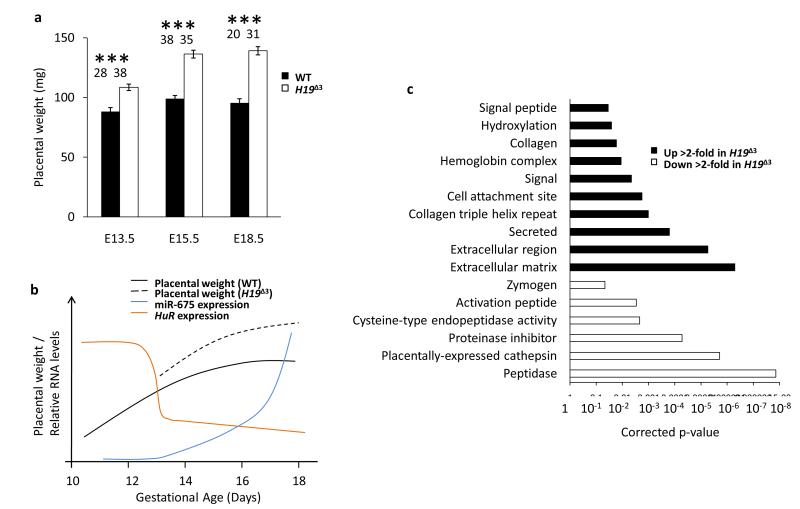
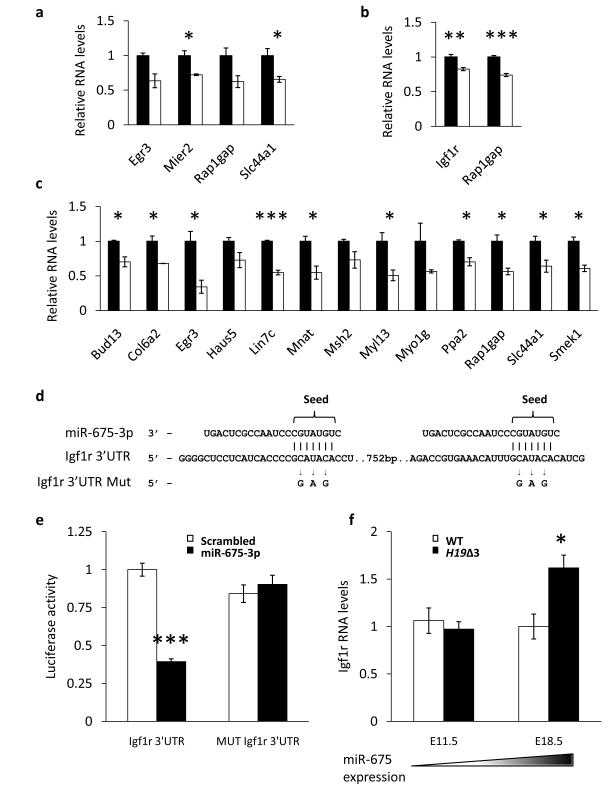
The H19 large intergenic non-coding RNA (lincRNA) is one of the most highly abundant and conserved transcripts in mammalian development, being expressed in both embryonic and extra-embryonic cell lineages, yet its physiological function is unknown. Here we show that miR-675, a microRNA (miRNA) embedded in H19's first exon, is expressed exclusively in the placenta from the gestational time point when placental growth normally ceases, and placentas that lack H19 continue to grow. Overexpression of miR-675 in a range of embryonic and extra-embryonic cell lines results in their reduced proliferation; targets of the miRNA are upregulated in the H19 null placenta, including the growth-promoting insulin-like growth factor 1 receptor (Igf1r) gene. Moreover, the excision of miR-675 from H19 is dynamically regulated by the stress-response RNA-binding protein HuR. These results suggest that H19's main physiological role is in limiting growth of the placenta before birth, by regulated processing of miR-675. The controlled release of miR-675 from H19 may also allow rapid inhibition of cell proliferation in response to cellular stress or oncogenic signals.


Figures

Figure 1
Figure 1
miR-675 is expressed in the late gestation placenta but suppressed in the embryo. (a) Schematic representation of the H19 transcriptional unit with miR-675 shown in red embedded within H19 exon 1. The black arrow indicates the transcriptional start site. (b,c,d,e) Expression determined by qRT-PCR for miR-675-5p (blue), miR-675-3p (orange) and H19 (green) in fetal heart (b), liver (c), fetal brain (d) and placenta (e). Expression levels are expressed as the number of molecules per picogram of total RNA with H19 levels on the left y-axis and miR-675 levels on the right. n ≥ 3. Error bars indicate the s.e.m.
Figure 2
Figure 2
HuR binds to full length H19 and inhibits processing of miR-675. (a) Venn diagram indicating the numbers of proteins that were identified by RNA affinity assay (see methods) as binding to H19 in the region of the miR-675 stem loop (Stem) and to control segments including H19 upstream of the stem loop (5′ H19) and of the Kcnq1ot1 RNA (Kcnq1ot1). (b) Microarray data from a published study of transcription during placental development were reanalysed and the kinetics of HuR expression are shown from E8.5 until birth (P0). Note that HuR expression is inverse to that of miR-675 during placental development. Data is from at least 2 biological and two technical replicates. (c) RNA immunoprecipitation with an antibody to HuR indicates binding to H19 in the placenta at a gestational timepoint when miR-675 is suppressed (E11.5) but not when it is expressed (E19.5). The enrichment of RNA over a random IgG control is shown following normalisation to the 18s RNA. Levels of Actb and Gapdh are included as positive and negative controls respectively. n=9. (d) RNA immunoprecipitation with an antibody to HuR indicates binding to H19 in MEF cells. The enrichment of RNA over a random IgG control is again shown following normalisation to the 18s RNA. Levels of p21 and Gapdh are included as positive and negative controls respectively. n = 11. (e, g) The expression of miR-675-5p, miR-675-3p or miR-16 in MEF cells (e) and C2C12 cells (g) following treatment with either an siRNA against HuR (si-HuR) or a non-targeting scrambled control (si-scrambled) as determined by qRT-PCR. n = 4. (f) The expression of miR-675-5p, miR-675-3p or miR-16 in MEF cells that genetically lack HuR (HuR-/-). n = 5. All error bars indicate the s.e.m. p-values were determined by Student’s t-test. * p < 0.05, ** p < 0.01, *** p < 0.001.
Figure 3
Figure 3
Evidence that HuR inhibits miR-675 at the Drosha processing step. (a, b) Northern blots using probes specific to either miR-675-3p (a) or pre-miR-675 (miRBase accession MI0004123) (b), against total RNA from fetal liver and placenta. Total RNA from adult liver is included as a negative control. (a) The expression pattern here agrees with the qRT-PCR results from Fig. 1e. (b) The image shown was exposed for 72 hours and shows the very low abundance of pre-miR-675 in these tissues. Full scans are shown in Supplementary Fig S8. (c) Expression of HuR, miR-675-5p and miR-675-3p following transfection of synthetic pre-miR-675 and either an siRNA against HuR (si-HuR) or a scrambled control (si-scrambled) in MEF cells, showing that HuR has no effect on Dicer processing of pre-miR-675. n = 3. Statistical significance was determined by Student’s t-test. ** P < 0.01, *** P < 0.001. (d, e) H19 expression in nuclear and cytoplasmic cell fractions from both wild type (WT) and HuR null (HuR-/-) MEF cells, measured by qRT-PCR. To assess the quality of fractionation the nuclear 45s transcript and the cytoplasmic 18s transcript were measured (d). H19 expression was measured in the different fractions (e). n = 6. (f, g, h, i) Nuclear and cytoplasmic fractionation of placental tissue was performed from different developmental time points. Quality of fractionation was assessed by measuring the 45s and 18s transcripts by qRT-PCR (f). H19 expression was measured in the input (g), cytoplasmic (h) and nuclear (i) fractions. n = 3. All error bars show the s.e.m.
Figure 4
Figure 4
miR-675 overexpression decreases the proliferation rate of a number of cultured cell lines. (a,b,c,d) Cell lines were transfected with miRNA mimics of either miR-675-5p (orange), miR-675-3p (dark blue), both miR-675 species in combination (green), miR-1 (pink) or a scrambled control (light blue) and cell numbers were counted at timepoints post transfection. This procedure was performed in ES (a), TS (b), MEF (c) and C2C12 (d) cells. (e,f,g) Using the A2lox-cre system (see methods) ES cell lines were created which upon the addition of doxycycline selectively express miR-675-5p (A2lox-5p) (e), miR-675-3p (A2lox-3p) (f) or a non-targeting scrambled control (A2lox-scrambled) (g). Cell numbers were counted at timepoints following the addition of doxycycline to the growth media (dox+, blue line) or in the absence of doxycycline (dox−, black line). n = 4. p-values were determined by two-way ANOVA followed by post hoc Tukey’s Test. (h) G401 cells were treated with the indicated miRNA mimics and cell numbers were counted 72 hours post transfection. n = 4. p-values were determined by Student’s t-test. (i) C2C12 cells were treated with either an inhibitor of miR-675-3p or a scrambled control. miR-675 expression was induced by differentiation and the cells counted following 96 hours of differentiation. n = 9. p-values were determined by Student’s t-test. All error bars indicate the s.e.m. * p < 0.05, ** p < 0.01, *** p < 0.001.
Figure 5
Figure 5
The phenotype and transcriptome of the H19Δ3 placenta implies that miR-675 is a negative growth regulator in this tissue. (a) Placental weight was measured for homozygous H19Δ3 crosses and compared to wild type revealing an overgrowth phenotype for the knockout that is more severe in the placenta than the embryo. The number of placentas measured for each data point is indicated above each bar. Error bars indicate the s.e.m. p-values were determined by Student’s t-test. ** p < 0.01, *** p < 0.001. (b) Representation based on real data showing the correlation of mir-675 (blue) and HuR (orange) expression in the placenta with the developmental weight of that organ (black). The weight of the H19Δ3 placenta is also indicated (slotted line). At E13.5 there is a rapid drop in HuR expression concomitant with the induction of miR-675. At approximately E15.5 the wild type placenta ceases to increase in mass, however this does not occur in the H19Δ3 placenta. (c) Enriched gene ontology terms in RNA-seq data from the labyrinth layer of a day E18.5 wild type and H19Δ3 placenta. Categories for genes upregulated (black) and downregulated (white) in the H19Δ3 placenta are shown.
Figure 6
Figure 6
Identification of miR-675 targets. (a, b, c) Expression of predicted miR-675 targets, detected by qRT-PCR, following the co-transfection of both miR-675 species mimics or a scrambled control in C2C12 (a), ES (b) and MEF (c) cells. n = 3. Note that only targets which were affected by miR-675 transfection are shown. (d) Schematic representation of miR-675-3p binding to two potential sites in the Igf1r 3′UTR. The bases mutated to make the mutant Igf1r 3′UTR are indicated. (e) Effect of miR-675-3p transfection on the expression of a Renilla luciferase reporter fused to either the wild type or mutant Igf1r 3′UTR. (f) Igf1r expression, determined by qRT-PCR, in the labyrinth layer of wild type and H19Δ3 placentas at either E11.5 or E18.5. Endogenous miR-675 expression in the placenta is indicated by the shaded triangle. n = 4. All error bars indicate the s.e.m. p-values were determined by Student’s t-test. * p < 0.05, *** p < 0.001.

References

    1. Brannan CI, Dees EC, Ingram RS, Tilghman SM. The product of the H19 gene may function as an RNA. Mol Cell Biol. 1990;10:28–36. - PMC - PubMed
    1. Seidl CI, Stricker SH, Barlow DP. The imprinted Air ncRNA is an atypical RNAPII transcript that evades splicing and escapes nuclear export. Embo J. 2006;25:3565–3575. - PMC - PubMed
    1. Bartolomei MS. Genomic imprinting: employing and avoiding epigenetic processes. Genes Dev. 2009;23:2124–2133. - PMC - PubMed
    1. Gabory A, Jammes H, Dandolo L. The H19 locus: role of an imprinted non-coding RNA in growth and development. Bioessays. 2010;32:473–480. - PubMed
    1. Hao Y, Crenshaw T, Moulton T, Newcomb E, Tycko B. Tumour-suppressor activity of H19 RNA. Nature. 1993;365:764–767. - PubMed

Publication types

MeSH terms