. 2012 Sep;40(16):7985-8000.
doi: 10.1093/nar/gks502. Epub 2012 Jun 7.

Engineering domain fusion chimeras from I-OnuI family LAGLIDADG homing endonucleases

Affiliations

Engineering domain fusion chimeras from I-OnuI family LAGLIDADG homing endonucleases

Sarah Baxter et al. Nucleic Acids Res. 2012 Sep.

Abstract

Although engineered LAGLIDADG homing endonucleases (LHEs) are finding increasing applications in biotechnology, their generation remains a challenging, industrial-scale process. As new single-chain LAGLIDADG nuclease scaffolds are identified, however, an alternative paradigm is emerging: identification of an LHE scaffold whose native cleavage site is a close match to a desired target sequence, followed by small-scale engineering to modestly refine recognition specificity. The application of this paradigm could be accelerated if methods were available for fusing N- and C-terminal domains from newly identified LHEs into chimeric enzymes with hybrid cleavage sites. Here we have analyzed the structural requirements for fusion of domains extracted from six single-chain I-OnuI family LHEs, spanning 40-70% amino acid identity. Our analyses demonstrate that both the LAGLIDADG helical interface residues and the linker peptide composition have important effects on the stability and activity of chimeric enzymes. Using a simple domain fusion method in which linker peptide residues predicted to contact their respective domains are retained, and in which limited variation is introduced into the LAGLIDADG helix and nearby interface residues, catalytically active enzymes were recoverable for ≈ 70% of domain chimeras. This method will be useful for creating large numbers of chimeric LHEs for genome engineering applications.


Figures

Figure 1.
Figure 1.
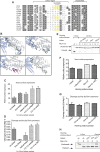
Comparison of Onu-Ltr and Ltr-Onu in vitro stability and activity. (A) Overlaid crystal structures of the LAGLIDADG helices of I-OnuI (blue) and I-LtrI (gray), which form the majority of the interface between the NTDs and CTDs. Residues are indicated by both name and corresponding sequence number. An alignment of the amino acid sequences illustrates their high level of conservation. (B) Comparison of enzyme expression levels in the flow-cytometric yeast surface display assay. Expression levels are quantified by intensity of fluorescent FITC signal (anti-Myc-FITC antibody bound to the C-terminal Myc epitope tag). Each bar represents the ratio of median FITC signal from ‘expressing’ versus ‘non-expressing’ cell populations. (C) Thermal denaturation was monitored by CD as an alternative measure for comparison of overall protein stability. See the ‘Materials and Methods’ section for details of data collection and calculations. (D) Comparison of DNA cleavage activity measured by the flow-cytometric yeast surface display assay. Activity is quantified by loss of A647 signal upon cleavage of a tethered, fluorescently-labeled DNA target substrate. Each bar represents the ratio of A647 signal from cells in the presence of calcium (no cleavage) to cells in the presence of magnesium (allows cleavage) minus one [(Ca/Mg) − 1]. A height of zero represents no detectable cleavage activity. The unrelated I-AniI DNA target site was used as the negative control. Cleavage reactions were incubated for 30 min at 37°C. Data represents five to seven separate experiments; in each individual experiment, all enzymes’ signals were normalized to the I-OnuI signal. (E) DNA cleavage activity measured by the in vitro gel cleavage assay. A647-labeled DNA target substrate was incubated with surface-released yeast protein in the presence of calcium (no cleavage) or magnesium (allows cleavage) and visualized on an acrylamide gel. Each homing endonuclease was assayed against the I-OnuI, I-LtrI, Ltr-Onu, Onu-Ltr, and I-AniI target sequences to detect any off-target activity. Cleavage reactions were incubated for 1 h at 37°C. (Compilation of three separate gels, run in parallel).
Figure 2.
Figure 2.
In vivo activity of Onu-Ltr compared to native enzymes. (A) Plasmids containing I-OnuI, I-LtrI and Onu-Ltr with an N-terminal BFP tag were transfected into HEK293T cells containing the corresponding Traffic Light Reporter target plasmid. Enzyme expression is quantified by coexpressed BFP fluorescence. Low, medium and high levels of expressed enzyme are gated by BFP fluorescence to determine relative rates of NHEJ and HR. (B–E) In vivo activity of Onu-Ltr in the NHEJ vs HR Traffic Light Reporter assay. Cleavage of a target site plasmid can be repaired by either NHEJ or HR, and relative levels of each repair pathway can be simultaneously visualized using this reporter assay. (B) Mutagenic NHEJ events leading to +3 frameshifts are detected by mCherry fluorescence. mCherry-positive events represent ∼33% of total mutagenic NHEJ events. (C) In vivo cleavage specificity. Mutagenic NHEJ (detected by mCherry fluorescence) was measured for each enzyme against the related I-OnuI, I-LtrI, and chimeric DNA target sites. (D) Repair of a cleaved target site by the HR pathway (in the presence of a cotransfected GFP donor template) is detected by fluorescence of a correctly reconstituted GFP sequence. (E) Ratio of HR events (% GFP positive cells) to mutagenic NHEJ events resulting in +3 frameshifts (% mCherry positive cells).
Figure 3.
Figure 3.
Linker peptide variations. Analysis of Ltr-Onu expression and activity with various linker strategies. (A) Alignment of the highly variable linker peptide sequences from 14 characterized I-OnuI homologs. Brackets indicate the linker peptide sequence and the position of the second LAGLIDADG helix. Residues replaced by the ‘SGT’ or ‘NGN’ flexible linkers are highlighted in yellow. (B) Models of the Ltr-Onu chimera illustrating the various linkers tested. Top left: Superposition of native I-OnuI (blue) and I-LtrI (gray) linkers, top view. A small portion of the I-OnuI linker is missing from the structure due to disorder in the crystal. Top right: Superposition of native I-OnuI (blue) and I-LtrI (gray) linkers, side view. Bottom left: Artificial helical linker (magenta), originally designed for use with wild-type I-OnuI. Bottom right: Half-and-half linker with ‘SGT’ residues highlighted yellow. (C) Comparison of expression levels in the flow-cytometric yeast surface display assay. Expression levels were quantified by intensity of fluorescent APC signal (antibody staining of a C-terminal Myc epitope tag). Each bar represents the ratio of median APC signal from the ‘expressing’ versus ‘non-expressing’ cell populations. (D) Comparison of DNA cleavage activity measured by the flow-cytometric yeast surface display assay. Activity is quantified by loss of A647 signal upon cleavage of a fluorescently-labeled DNA target substrate. Each bar represents the ratio of A647 signal from cells in the presence of calcium (no cleavage) to cells in the presence of magnesium (allows cleavage) minus one [(Ca/Mg) − 1]. A height of zero represents no detectable cleavage activity. Reactions were incubated at 37°C for 30 min. (E) Effect of linker variation on catalytic activity, as measured by the in vitro gel cleavage assay. A647-labeled target substrate was incubated (for 30 min at 37°C) with surface-released yeast protein in the presence of calcium (no cleavage) or magnesium (allows cleavage) and visualized on an acrylamide gel. (F–H) Comparison of the expression and cleavage activity of I-OnuI and Onu-Ltr with the ‘SGT’ linker, as measured by the flow-cytometric yeast surface display assay and the in vitro cleavage assay (as described above in parts C–E).
Figure 4.
Figure 4.
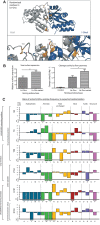
Variation of DNA-distal LAGLIDADG residues. Ltr-Onu variants were selected for increased expression and cleavage activity from a library with six randomized interface residues. (A) Randomized residues (colored orange) were chosen in three separate locations: the DNA-distal end of the LAGLIDADG helices (bottom middle), and in loops on either side of the central helices (bottom left and bottom right). (B) Left: Yeast surface expression is increased in the sorted Ltr-Onu library, as measured by FITC staining of the C-terminal Myc epitope tag. Each bar represents the ratio of median FITC signal from the ‘expressing’ versus ‘non-expressing’ cell populations. Right: Activity is quantified by loss of A647 signal upon cleavage of a fluorescently-labeled DNA target substrate. Each bar represents the ratio of A647 signal from cells in the presence of calcium (no cleavage) to cells in the presence of magnesium (allows cleavage) minus one [(Ca/Mg) − 1], as described in Figure 1. Asterisk indicates P < 0.05. (C) Approximately 150 clones from the sorted Ltr-Onu library were sequenced. Post-selection variation at each randomized position is represented by fold increase or decrease over the expected frequency (given complete randomization). Fold increase/decrease is presented along a log (2) axis. Residues that were not detected are scaled below the broken line. Selected residues are divided into groups with biochemically similar sidechains (hydrophobic, aromatic, polar uncharged, basic, acidic, structural).
Figure 5.
Figure 5.
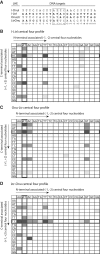
Specificity of I-LtrI, Onu-Ltr and Ltr-Onu chimeras against C4 target variants. (A) The 22-bp DNA recognition sequences for the Onu-Ltr and Ltr-Onu chimeras and their parental enzymes. The target sites are divided into a ‘minus half’ and a ‘plus half’, which are contacted by the NTDs and CTDs of the enzyme, respectively. The numbering scheme is indicated below the target sites, with the C4 base pairs boxed. (B) The catalytic activity of I-LtrI was analyzed in the flow-cytometric yeast surface display DNA cleavage assay against all potential 264 C4 target nucleotides. Nucleotides at positions −1 and −2 (interacting with the N terminal domain) are listed on the x-axis, with nucleotides at positions +1 and +2 (interacting with the CTD) listed on the y-axis. Boxes containing the native central 4 nt for each domain are outlined in bold. Cleavage activity against each nucleotide combination is illustrated as a heat-map: white represents no measurable catalytic activity, with a Ca/Mg ratio of < 1.1 in the cleavage assay. Light grey, grey, and black represent low, medium and high levels of cleavage activity. (C–D) Catalytic activity of Onu-Ltr (C) and Ltr-Onu (D) against all 264 potential C4 target nucleotides.
Figure 6.
Figure 6.
Domain fusion chimera and common interface chimera screens. NTDs and CTDs from I-OnuI, I-LtrI, I-GpiI, I-GzeI, I-PanMI and I-SscMI were combinatorially fused using the ‘SGT’ linker. Chimeras were generated with an interface composed of entirely native residues (fusion chimeras), and with a set of common interfacial residues originating from I-OnuI (common interface chimeras). (A) Catalytic activity of the fusion chimeras as measured by the in vitro DNA cleavage assay. Enzymes are expressed on the surface of yeast, released with DTT, and incubated with A647-labeled DNA target substrate. Cleavage products are then visualized on an acrylamide gel. This figure is a compilation of five separate gels. (B) Amino acid sequence alignment of LHEs used in this study. Similarities and identities are highlighted in gray, and ‘common interface’ residues are highlighted in yellow. The first highlighted residue, N6 in I-OnuI, was grafted only in the alternative common interface, using the solutions from the Ltr-Onu variant sort (Figure 4). Threonine, the most highly selected residue at this position, was substituted. (C) I-OnuI structure with common interface residues colored yellow. The additional residues included in the alternative common interface are colored orange. (D) Catalytic activity of the common interface chimeras as measured by the in vitro DNA cleavage assay. (E) Vector graphs showing expression, binding and cleavage activity for all chimeras. NTDs are listed along the vertical axis and CTDs along the horizontal axis, and are organized by percent identity to I-OnuI. The blue line pointing upwards represents expression of the chimera on the surface of yeast. The green line pointing down left represents DNA-binding activity, measured by detection of fluorescently-labeled DNA target substrate bound to surface-expressed enzyme in the presence of calcium (allows for DNA binding, but not cleavage). The orange line pointing down right represents DNA cleavage activity, quantified from the in vitro cleavage assay (acrylamide gel). For expression and binding, the length of each line is proportional to the expression and binding of wild-type I-OnuI, holding I-OnuI as the maximum. For cleavage activity, the length of each line is determined as the ratio of cleaved versus uncleaved target in the acrylamide gel. 50% cleavage of the DNA target substrate (after 1 h at 37°C) is set as maximum activity, so chimeras cleaving 50% or more of their target are given a ratio of 1. Chimeras with any detectable level of cleavage activity, as determined by a visible cleaved target band in the gel, are highlighted with a grey background.

Similar articles

Cited by

References

    1. Certo MT, Ryu BY, Annis JE, Garibov M, Jarjour J, Rawlings DJ, Scharenberg AM. Tracking genome engineering outcome at individual DNA breakpoints. Nat. Methods. 2011;8:671–676. - PMC - PubMed
    1. Branzei D, Foiani M. Regulation of DNA repair throughout the cell cycle. Nat. Rev. Mol. Cell Biol. 2008;9:297–308. - PubMed
    1. Ciccia A, Elledge SJ. The DNA damage response: making it safe to play with knives. Mol. Cell. 2010;40:179–204. - PMC - PubMed
    1. Karran P. DNA double strand break repair in mammalian cells. Curr. Opin. Genet. Dev. 2000;10:144–150. - PubMed
    1. McCammon JM, Amacher SL. Using zinc finger nucleases for efficient and heritable gene disruption in zebrafish. Methods Mol. Biol. 2010;649:281–298. - PubMed

Publication types