. 2012 Dec;33(3):559-72.
doi: 10.1007/s10827-012-0401-0. Epub 2012 Jun 10.

Integrate-and-fire vs Poisson models of LGN input to V1 cortex: noisier inputs reduce orientation selectivity

Affiliations

Integrate-and-fire vs Poisson models of LGN input to V1 cortex: noisier inputs reduce orientation selectivity

I-Chun Lin et al. J Comput Neurosci. 2012 Dec.

Abstract

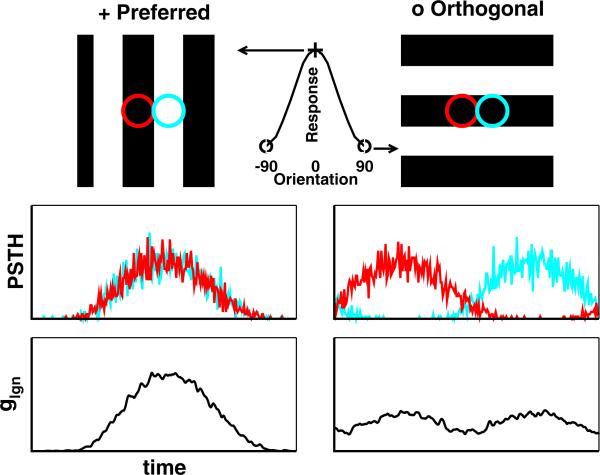
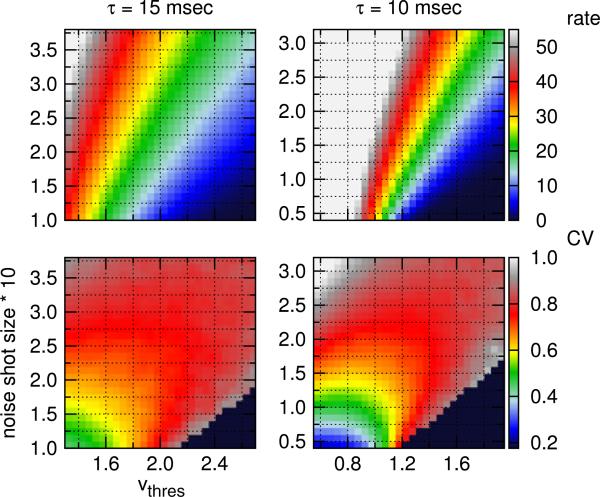
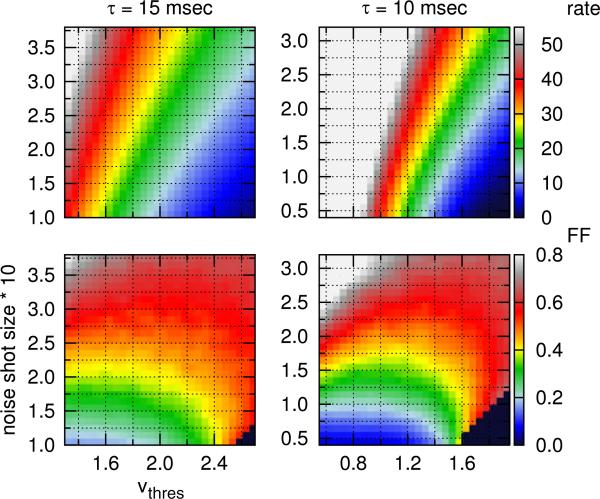
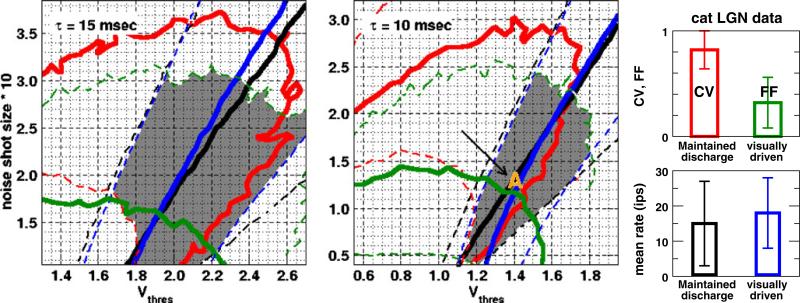
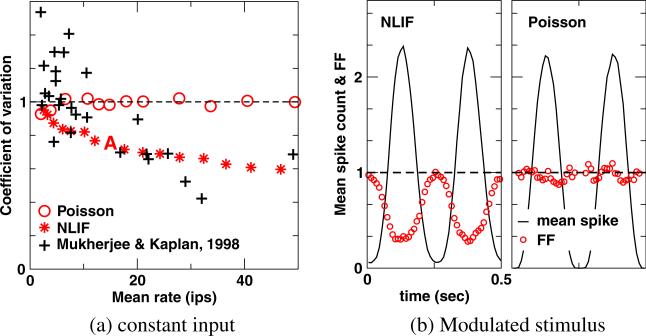
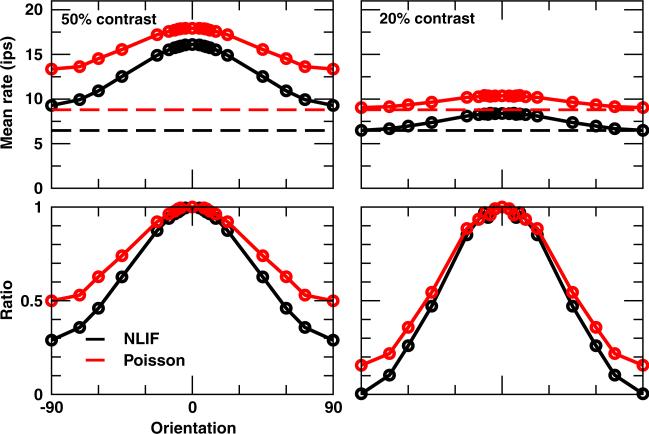
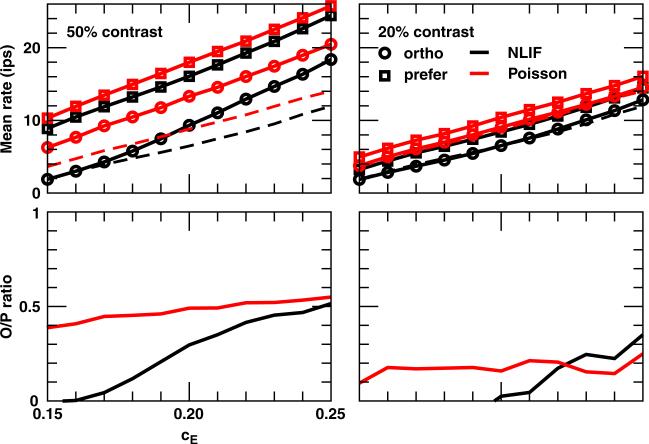
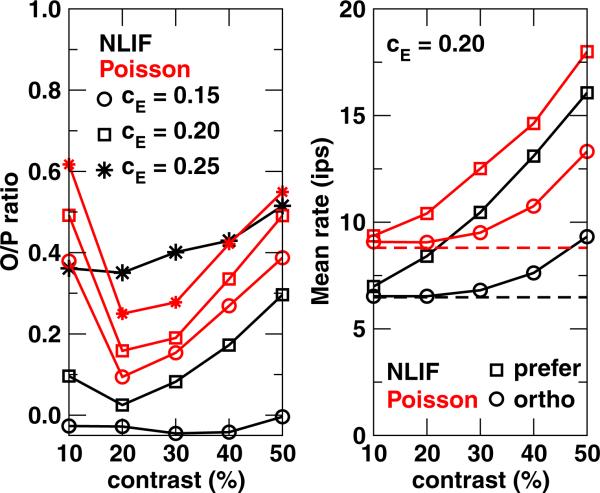
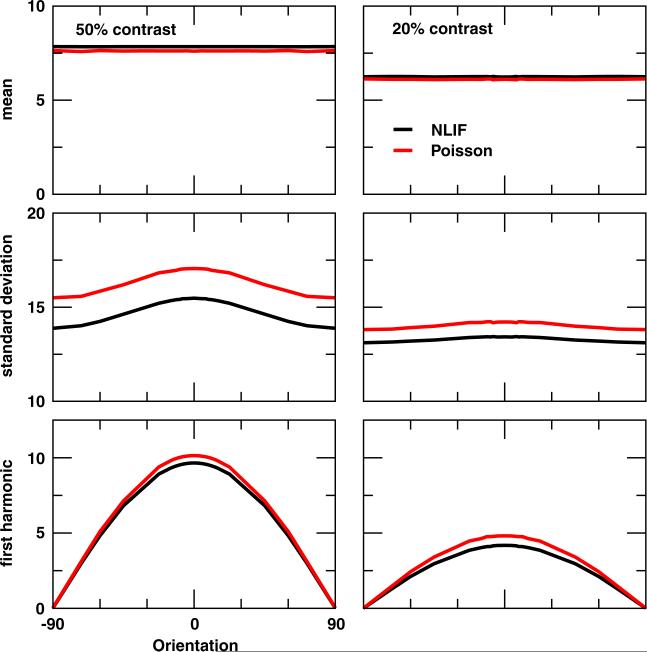
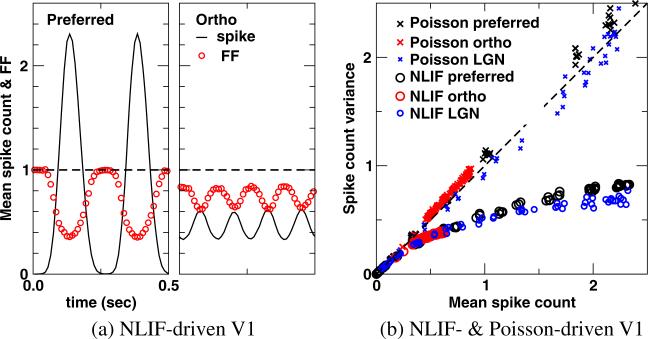
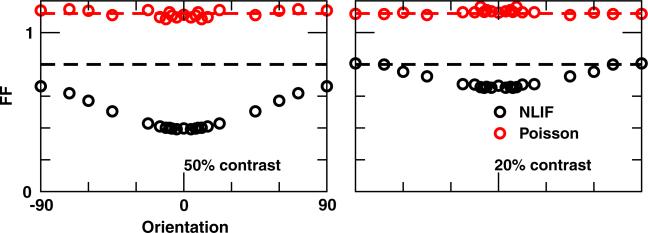
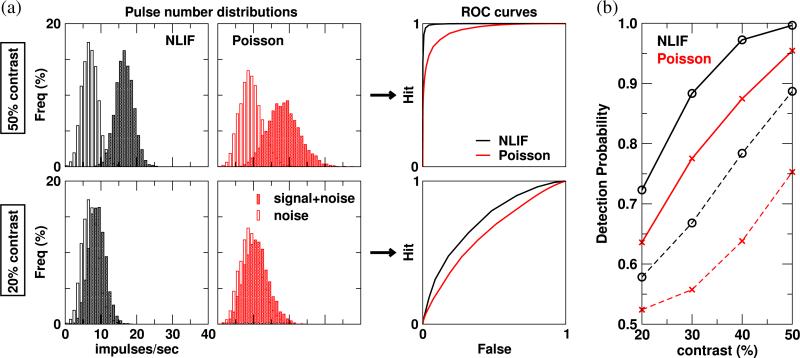
One of the reasons the visual cortex has attracted the interest of computational neuroscience is that it has well-defined inputs. The lateral geniculate nucleus (LGN) of the thalamus is the source of visual signals to the primary visual cortex (V1). Most large-scale cortical network models approximate the spike trains of LGN neurons as simple Poisson point processes. However, many studies have shown that neurons in the early visual pathway are capable of spiking with high temporal precision and their discharges are not Poisson-like. To gain an understanding of how response variability in the LGN influences the behavior of V1, we study response properties of model V1 neurons that receive purely feedforward inputs from LGN cells modeled either as noisy leaky integrate-and-fire (NLIF) neurons or as inhomogeneous Poisson processes. We first demonstrate that the NLIF model is capable of reproducing many experimentally observed statistical properties of LGN neurons. Then we show that a V1 model in which the LGN input to a V1 neuron is modeled as a group of NLIF neurons produces higher orientation selectivity than the one with Poisson LGN input. The second result implies that statistical characteristics of LGN spike trains are important for V1's function. We conclude that physiologically motivated models of V1 need to include more realistic LGN spike trains that are less noisy than inhomogeneous Poisson processes.


Figures

Fig. 1
Fig. 1
A feedforward model of a V1 cell. (Top) Receptive fields and (Middle) PSTHs of the ON- (red) and OFF-center (cyan) LGN afferents. (Bottom) The summed LGN synaptic input to the V1 cell, glgn
Fig. 2
Fig. 2
(Top) Mean rate in ips and (Bottom) CV in the maintained discharge of an LGN neuron, described by the NLIF formalism. The stimulus is a constant input, I0 = 100. Cells that fire less than 2 ips are excluded from the CV analysis (black region)
Fig. 3
Fig. 3
(Top) Mean rate in ips and (Bottom) Fano factor (FF) in the visually-driven discharge of an LGN neuron, described by the NLIF equation. Neurons are driven by a sinusoidally modulated stimulus at 50% contrast. Cells that fire less than 2 ips are excluded from the FF analysis (black region)
Fig. 4
Fig. 4
Choice of model parameters is constrained within one standard deviation from the population averages of experimental data. (Right) Population averages of mean rates and variability in the maintained (Mukherjee and Kaplan 1998) and visually-driven (Kara et al. 2000) discharges of cat LGN neurons. Error bars are standard deviations. (Left, Middle) Isolines of Figs. 2 and 3, whose values correspond to population averages (solid) and one standard deviation from the population averages (dashed) of experimental data, are drawn here as a contour map. Black and red are the mean rate and CV in the maintained discharge; blue and green are the mean rate and Fano factor in the visually-driven discharge. The gray shaded area is the possible parameter space under these constraints, and the parameter set used in subsequent cortical studies is marked by A (in orange)
Fig. 5
Fig. 5
Inverse relationships between (a) the mean rate and CV in the LGN maintained discharge and between (b) the mean spike count and Fano factor (FF) in the visually-driven discharge of a LGN neuron at 50% contrast. Each point in (b) plots the mean spike count and FF in a 50 ms window versus the time of the center of that counting window
Fig. 6
Fig. 6
Orientation tuning curves of a V1 neuron at 50% and 20% contrasts for cE = 0.20. (Top) Mean rate at each orientation. (Bottom) Ratio between mean rates (background rate subtracted) at each orientation and the preferred. Dashed lines indicate background rates
Fig. 7
Fig. 7
(Top) Mean rates and (Bottom) O/P ratios of a V1 cell in response to the orthogonal and preferred stimuli at 50% and 20% contrasts as a function of the LGN–V1 synaptic coefficient cE. Dashed lines indicate background rates
Fig. 8
Fig. 8
(Left) O/P ratios and (Right) mean rates of a V1 neuron in response to the orthogonal and preferred stimuli as a function of stimulus contrast for cE = 0.15, 0.20, and 0.25. For mean rates, only data for cE = 0.20 is plotted as an example
Fig. 9
Fig. 9
Orientation tuning curves of the LGN synaptic input glgn to a V1 cell at 50% and 20% contrasts for cE = 0.20. (Top) Mean glgn averaged across time and trials and (Middle) the corresponding standard deviation. (Bottom) First harmonic of the trial-averaged glgn
Fig. 10
Fig. 10
(a) The inverse relationship between the mean spike count and Fano factor (FF) and (b) the spike count variance versus the mean spike count in the stimulus-driven discharge of a V1 neuron at 50% contrast for cE = 0.20. Each point represents the value in a given 50 ms counting window
Fig. 11
Fig. 11
Fano factor (FF) in the stimulus-driven discharge of a V1 neuron as a function of stimulus orientations at 50% and 20% contrasts for cE = 0.20. FF of spontaneous activities are marked by dashed lines. Spikes are counted in 250 ms windows
Fig. 12
Fig. 12
(a) Pulse number distributions and ROC curves generated from a model V1 neuron's responses to blank (noise) and the preferred stimulus at 50% and 20% contrasts (signal+noise); cE = 0.20. (b) Detection probability as a function of stimulus contrast ranging from 20% to 50% for a model V1 neuron (solid) and its LGN afferents (dashed)

References

    1. Alitto HJ, Moore BD, 4th, Rathbun DL, Usrey WM. A comparison of visual responses in the lateral geniculate nucleus of alert and anaesthetized macaque monkeys. 1. Journal of Physiology. 2011;589:87–99. - PMC - PubMed
    1. Alitto HJ, Usrey WM. Influence of contrast on orientation and temporal frequency tuning in ferret primary visual cortex. Journal of Neurophysiology. 2004;91:2797–2808. - PubMed
    1. Alonso J-M, Usrey WM, Reid RC. Rules of connectivity between geniculate cells and simple cells in cat primary visual cortex. Journal of Neuroscience. 2001;21:4002–4015. - PMC - PubMed
    1. Andolina IM, Jones HE, Wang W, Sillito AM. Corticothalamic feedback enhances stimulus response precision in the visual system. Proceedings of the National Academy of Sciences. 2007;104:1685–1690. - PMC - PubMed
    1. Ben-Yishai R, Bar-Or RL, Sompolinsky H. Theory of orientation tuning in visual cortex. Proceedings of the National Academy of Sciences. 1995;92:3844–3848. - PMC - PubMed

Publication types

LinkOut - more resources