. 2012 Oct;40(18):e139.
doi: 10.1093/nar/gks542. Epub 2012 Jun 8.

FunciSNP: an R/bioconductor tool integrating functional non-coding data sets with genetic association studies to identify candidate regulatory SNPs

Affiliations

FunciSNP: an R/bioconductor tool integrating functional non-coding data sets with genetic association studies to identify candidate regulatory SNPs

Simon G Coetzee et al. Nucleic Acids Res. 2012 Oct.

Abstract

Single nucleotide polymorphisms (SNPs) are increasingly used to tag genetic loci associated with phenotypes such as risk of complex diseases. Technically, this is done genome-wide without prior restriction or knowledge of biological feasibility in scans referred to as genome-wide association studies (GWAS). Depending on the linkage disequilibrium (LD) structure at a particular locus, such tagSNPs may be surrogates for many thousands of other SNPs, and it is difficult to distinguish those that may play a functional role in the phenotype from those simply genetically linked. Because a large proportion of tagSNPs have been identified within non-coding regions of the genome, distinguishing functional from non-functional SNPs has been an even greater challenge. A strategy was recently proposed that prioritizes surrogate SNPs based on non-coding chromatin and epigenomic mapping techniques that have become feasible with the advent of massively parallel sequencing. Here, we introduce an R/Bioconductor software package that enables the identification of candidate functional SNPs by integrating information from tagSNP locations, lists of linked SNPs from the 1000 genomes project and locations of chromatin features which may have functional significance.

Availability: FunciSNP is available from Bioconductor (bioconductor.org).


Figures
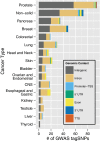
Figure 1.
Figure 1.
Summary of all known GWAS SNPs across a number of different cancer types. GWAS SNPs were annotated using known genomic features supplied by HOMER (version 3.9) (10), using build hg19 as reference. GWAS SNPs were extracted from the UCSC Genome table browser, track name ‘gwasCatalog’ with a P-value cut-off of 9e−06 (1).
Figure 2.
Figure 2.
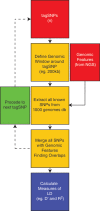
Schematic flowchart to describe FunciSNP. Purple boxes represent process before integration with biofeature. Red boxes represent information after integration with biofeature.
Figure 3.
Figure 3.
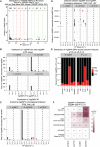
(A) Distribution of R2 values of all YAFSNPs. Each marked bin contains the total number of YAFSNPs. The sum of all the counts would total the number of correlated SNPs. (B) Distribution of R2 values of all YAFSNPs divided by the tagSNP and by its genomic location. (C) Histogram distribution of R2 value for all 1kgSNP extracted and overlaps PolII. R2 values are determined by its association to the tagSNP. (D) Scatter plot of the R2 and distance to tagSNP for all 1kgSNP extracted and overlap PollI. (E) Stacked bar chart summarizing all correlated SNPs for each of the identified genomic features: exon, intron, 5UTR, 3UTR, promoter, lincRNA or in gene desert. R2 cut-off at 0.5. This plot is most informative if used with a rsq value. (F) Heatmap of the number of 1kgSNPs by relationship between tagSNP and biofeature. Total number of YAFSNPs is listed within each quadrant to represent the number of potential candidate functional SNPs overlapping a biofeature (y-axis) which are in LD to the original tagSNP (x-axis).
Figure 4.
Figure 4.
FunciSNP results viewed in UCSC genome browser. Tracks are ordered in the following manner: known GWAS hits, dbSNP135, FunciSNP result, biofeatures, refseq genes and known lincRNA. TagSNP is highlighted in the FunciSNP result track and each YAFSNP is color coded to reflect the number of biofeatures which it overlaps. The color ranges from blue (low number of biofeature overlap) to red (high number of overlap). Each YAFSNP is highlighted by its known rsID and the calculated R2 value. The results are saved in a UCSC genome session: http://goo.gl/xrZPD.

References

    1. Hindorff LA, Sethupathy P, Junkins HA, Ramos EM, Mehta JP, Collins FS, Manolio TA. Potential etiologic and functional implications of genome-wide association loci for human diseases and traits. Proc. Natl Acad. Sci. USA. 2009;106:9362–9367. - PMC - PubMed
    1. Consortium TGP. A map of human genome variation from population-scale sequencing. Nature. 2010;467:1061–1073. - PMC - PubMed
    1. Freedman ML, Monteiro AN, Gayther SA, Coetzee GA, Risch A, Plass C, Casey G, De Biasi M, Carlson C, Duggan D, et al. Principles for the post-GWAS functional characterization of cancer risk loci. Nat. Genet. 2011;43:513–518. - PMC - PubMed
    1. Wang X, Prins BP, Sober S, Laan M, Snieder H. Beyond genome-wide association studies: new strategies for identifying genetic determinants of hypertension. Curr. Hypertens. Rep. 2011;13:442–451. - PMC - PubMed
    1. Coetzee GA, Jia L, Frenkel B, Henderson BE, Tanay A, Haiman CA, Freedman ML. A systematic approach to understand the functional consequences of non-protein coding risk regions. Cell Cycle. 2010;9:47–51. - PMC - PubMed

Publication types