. 2012 Aug 15;520(12):2697-711.
doi: 10.1002/cne.23067.

Electron tomographic analysis of synaptic ultrastructure

Affiliations

Electron tomographic analysis of synaptic ultrastructure

Alain C Burette et al. J Comp Neurol. .

Abstract

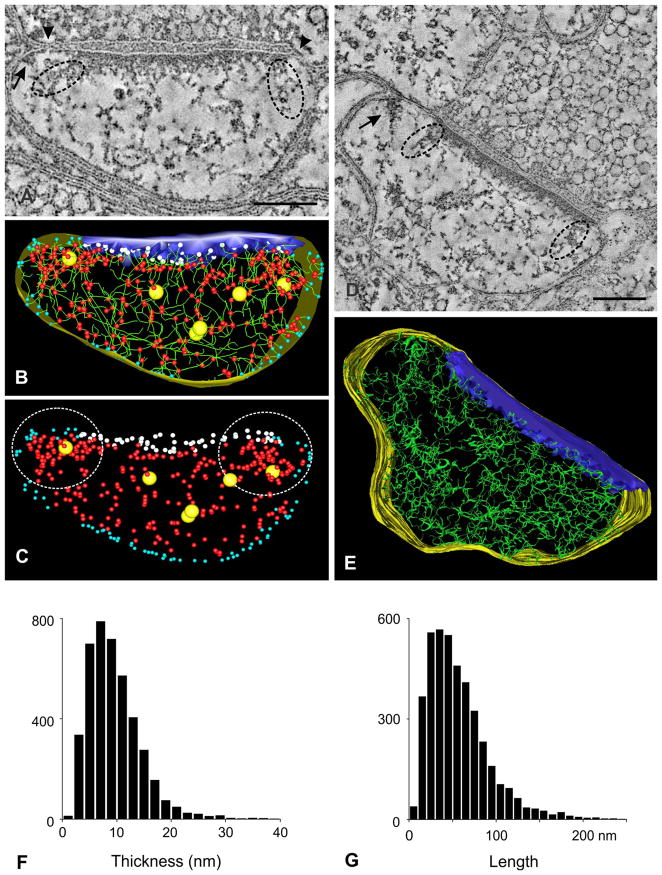
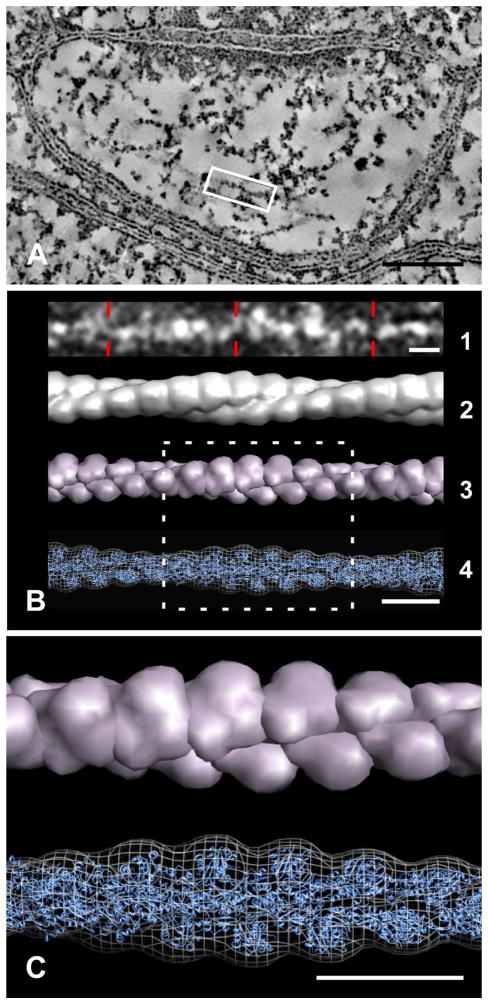
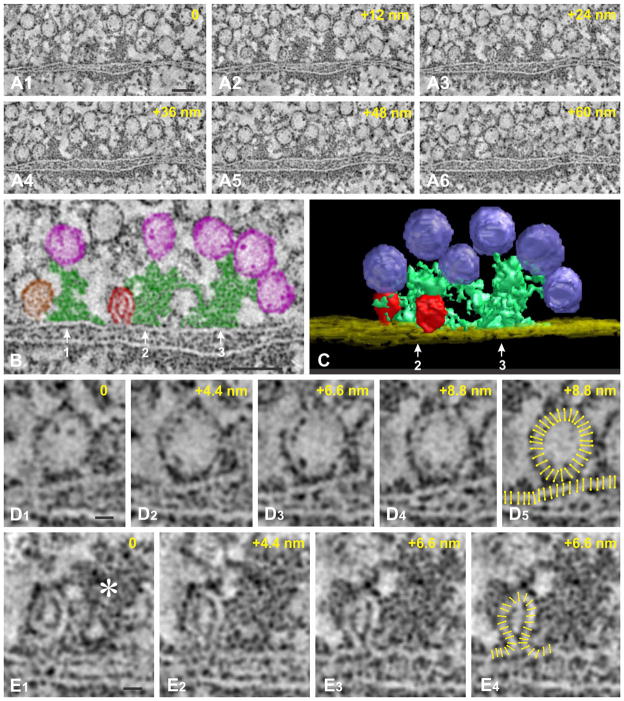
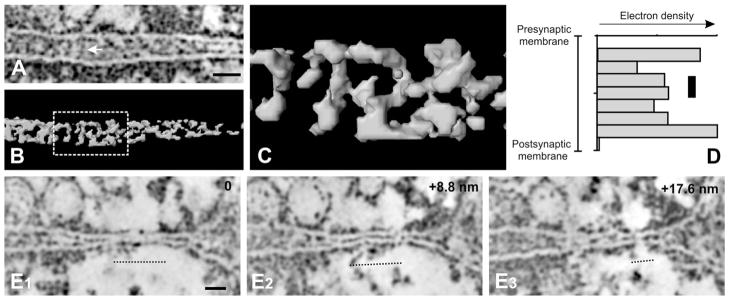
Synaptic function depends on interactions among sets of proteins that assemble into complex supramolecular machines. Molecular biology, electrophysiology, and live-cell imaging studies have provided tantalizing glimpses into the inner workings of the synapse, but fundamental questions remain regarding the functional organization of these "nano-machines." Electron tomography reveals the internal structure of synapses in three dimensions with exceptional spatial resolution. Here we report results from an electron tomographic study of axospinous synapses in neocortex and hippocampus of the adult rat, based on aldehyde-fixed material stabilized with tannic acid in lieu of postfixation with osmium tetroxide. Our results provide a new window into the structural basis of excitatory synaptic processing in the mammalian brain.


Figures

Figure 1
Figure 1
TEM images illustrate the influence of two different protocols on ultrastructure. A: Axospinous synapse (stratum radiatum of CA1 hippocampus) from material postfixed with OsO4 according to standard protocol (osmicated [OS]). B: Axospinous synapse (stratum radiatum of CA1 hippocampus) from nonosmicated (NON-OS) material, prepared according to the technique used for tomography. The smooth, clearly defined membranes and internal organelles revealed with OsO4 are more aesthetic and easier to understand than the high-contrast image on the right, but many ultrastructural details are better defined with our osmium-free protocol. Scale bar =100 nm in A,B.
Figure 2
Figure 2
Electron tomography of an axospinous synapse in cerebral cortex (layer II–III of S1 from rat R2869; see Materials and Methods). The subsequent figures are from this synapse, except as noted. A: A raw TEM image of the field used to generate the tomographic stack. The general impression of fuzziness reflects the relatively thick (~120-nm) section and high (400-KV) accelerating voltage used for image acquisition. Small black dots are 10-nm colloidal gold particles applied to the section surface, used as fiducial markers. A dual-axis tilt series of images from this synapse was collected and processed for electron tomographic reconstruction (see Materials and Methods). B: A representative ultrathin virtual tomographic section. Inset (enlargement of boxed region) shows the plasma membrane more clearly; the external surfaces of the lipid bilayer are lined with electron-dense particles. C: A projection of 11 tomographic slices using ImageJ (W.S. Rasband, ImageJ, National Institutes of Health, Bethesda, MD, http://rsb.info.nih.gov/ij/1997-2011). Red, presynaptic terminal; green, postsynaptic spine; yellow, astrocytic process. Scale bar =250 nm in A–C; 25 nm in inset in B.
Figure 3
Figure 3
Presynaptic vesicles. A: Connections made by synaptic vesicles. Two examples of direct membrane appositions between vesicles are circled; these appositions are commonly seen within vesicle clusters. Blue arrow points to a short filament connecting two adjacent vesicles; black arrows point to a longer filament that connects a vesicle to the nonsynaptic plasma membrane. B1B5: A Z-series showing several presynaptic vesicles; one of these (#2) exhibits a clathrin coat. Note that each section contains distinct fine detail, documenting the excellent z-axis resolution of the tomogram. The 3D projection in inset (B5) includes seven sections through the center of vesicle #1. C: A manual reconstruction of an 88-nm-thick slice through the terminal, generated with IMOD software (Kremer et al., 1996), from a stack of forty 2.2-nm-thick virtual sections, illustrating the overall arrangement of vesicles within the terminal. Pink spheres are presynaptic vesicles within the cytoplasm; purple spheres are vesicles associated with presynaptic dense projections (shown as large green spheres); blue sphere is a docked vesicle; and red spheres are vesicles fusing with the plasma membrane (see Fig. 6 for further details). Short bridges between neighboring vesicles are shown in blue; bridges connecting vesicles with the plasma membrane are in white. Scale bar =50 nm in A,B4 (applies to B1–B4), B5.
Figure 4
Figure 4
Postsynaptic spine. A: A tomographic slice through the center of the synapse. Arrowheads at both ends of the synaptic specialization point to a short zone of close contact between pre- and postsynaptic membranes. Filaments emerging from the postsynaptic density extend into the spine cytoplasm. A dense accumulation of filaments contacts the lateral edge of the PSD (dashed ovals); this accumulation is also associated with an accumulation of electron-dense material lateral to the PSD (arrow at left). The network of internal filaments, manually reconstructed by using IMOD, is shown below. B: Filaments (green lines) exhibit numerous branch points (small red spheres) and a few complex electron-dense junctions (large yellow spheres). Points of contact between filaments and the nonsynaptic plasma membrane are coded as blue circles; contacts with the PSD (indigo) are coded as white circles. C: Filaments, plasma membrane, and PSD have been removed to emphasize the organization of branching. Branch points are denser near the membrane, especially in a zone close to the edges of the PSD (white dotted circles). D: Tomographic slice of a large axospinous synapse in the stratum radiatum of CA1 hippocampus (from rat R2869, see Materials and Methods); dashed ovals surround accumulations of filaments at the lateral edge of the PSD, and arrow points to accumulations of filaments contacting the plasma membrane lateral to the PSD. E: Semiautomated reconstruction of filaments in the spine shown in D, using the “auto-skeleton” tool in Amira (Visage Imaging). F: Histogram shows filament thickness (analyzing all 4,164 filaments at least 20 nm long from both spines). G: Histogram shows filament length (analyzing all 4,091 filaments that were at least 4 nm thick and not thicker than 20 nm). Scale bar =100 nm in A,D.
Figure 5
Figure 5
Relationship of filaments to F-actin. A: A de-noised virtual slice through the postsynaptic spine. A volume containing a long, straight filament is highlighted by the white box. B1: A projection of the filament density extracted from the boxed volume. The helical symmetry of the filament can be seen at a qualitative level; several putative actin-binding proteins are attached to the filament. To facilitate comparison with the known structure of F-actin, intensities were inverted so that electron density corresponds to bright intensity values. The extracted filament volume was subjected to a search for helical symmetry parameters, yielding values of 2.8 nm for helical rise, and −167.4 degrees for angular increment around the axes, very close to the canonical symmetry observed for in vitro actin filaments (2.7 nm and −166.7 degrees). B2: A surface representation of the extracted density after application of the deduced helical symmetry. The fact that individual subunits are discernible with sharp edges indicates that the helical symmetry is quite accurate; otherwise the subunits would blur into each other along the filament axis. B3: A low-resolution representation of an atomic model of a canonical actin filament obtained from high-resolution electron microscopy analysis (Fujii et al., 2010), adjusted for the difference in symmetry parameters. B4: The fit of this atomic model (blue cartoon representation) into the symmetrized, extracted filament density (white mesh representation of the surface shown in B2). C: Boxed region shown magnified. Fourier shell correlation analysis of the fit indicates that the symmetrized extracted density is equivalent to the atomic actin-filament model up to a resolution of ~4 nm (0.5 cutoff criterion). Scale bar =100 nm in A; 10 nm in B,C.
Figure 6
Figure 6
Presynaptic active zone. A1A6: A stack of six tomographic slices through depth illustrates the active zone and associated dense projections. B: Colorized enlargement of the slice shown in A3 illustrates vesicles in the immediate vicinity of the active zone. Three dense projections are shown in green. Vesicles in the cytoplasm that contact dense projections are shown in purple. A docked vesicle directly contacting the plasma membrane (left, brown) is also associated with a dense projection. A vesicle that has fused with the plasma membrane is seen in the center of the field (red). C: 3D reconstruction illustrates the relationship among dense projections (green), presynaptic vesicles (indigo), and vesicles fused with the plasma membrane (red). D1D5: z-series shows a docked vesicle. The region of contact between the docked vesicle and the plasma membrane comprises two separate membranes (symbolized by schematic yellow phospholipid bilayers in D5). E1E4: z-series shows an exocytotic profile. The fusing vesicle is attached to a dense projection (asterisk in E1) via small filaments. Scale bar =50 nm in A1 (applies to A1–A6), B; 10 nm in D1 (applies to D1–D5) and E1 (applies to E1–E3).
Figure 7
Figure 7
Synaptic cleft (all panels are from the same tomogram shown in Fig. 2). A: Detail from a tomographic slice, showing the synaptic cleft; note electron-dense “bridges” that span the cleft (white arrow points to an example). B: A 3D reconstruction of the dense material within the synaptic cleft. C: Enlargement of the boxed region in B. D: Histogram of electron density across the cleft. Measurements were taken from a series of rectangular boxes (6 × 6.6 nm) running from pre- to postsynaptic membranes, along the tangential length of the synapse. Pre- and postsynaptic membrane estimates reflect lowered electron densities over the clear center of each membrane; the (variable) cleft distance was partitioned into seven bins between the membranes. The lowest densitometric estimate (associated with the presynaptic membrane) was normalized to zero, and the highest value to 1 arbitrary unit. Highest electron densities were adjacent to the plasma membranes; the modest local maximum of density in the center of the cleft (marked with black rectangle) may correspond to the “intercellular plaque.” E1E3: Serial tomographic slices show details of a zone of membrane approximation (marked with dotted line) at one end of the synaptic cleft. Scale bar =25 nm in A; 20 nm in E1 (applies to E1–E3).
Figure 8
Figure 8
Postsynaptic density. A1,A2: High-magnification view of the postsynaptic specialization, showing two slices (6.6 nm apart). Just inside the postsynaptic membrane, the PSD forms a continuous strip; deeper into the cytoplasm it becomes spiky, breaking into a complex network of filamentous material. The PSD expands at points of contact with cytoplasmic filaments (dotted triangles). Note the dense material filling the synaptic cleft. White arrows point to constrictions between the pre- and postsynaptic membranes, just lateral to the edge of the PSD. B1B3: Densitometry (right) quantifies the spatial organization in zones 0–10, 10–20, and 20–30 nm from the plasma membrane (thick yellow lines on left); densities (measured at each nm tangentially along the synapse) are presented as moving averages of six bins. The amplitude increases, and spatial frequency decreases, with distance from the membrane. Scale bar =50 nm in A1 (applies to A1,A2) and B1 (applies to B1–B3).

References

    1. Alvarez VA, Sabatini BL. Anatomical and physiological plasticity of dendritic spines. Annu Rev Neurosci. 2007;30:79–97. - PubMed
    1. Amsterdam A, Schramm M. Rapid release of the zymogen granule protein by osmium tetroxide and its retention during fixation by glutaraldehyde. J Cell Biol. 1966;29:199–207. - PMC - PubMed
    1. Arthur CP, Dean C, Pagratis M, Chapman ER, Stowell MH. Loss of synaptotagmin IV results in a reduction in synaptic vesicles and a distortion of the Golgi structure in cultured hippocampal neurons. Neuroscience. 2010;167:135–142. - PMC - PubMed
    1. Berryman MA, Porter WR, Rodewald RD, Hubbard AL. Effects of tannic acid on antigenicity and membrane contrast in ultrastructural immunocytochemistry. J Histochem Cytochem. 1992;40:845–857. - PubMed
    1. Bloom FE, Aghajanian GK. Fine structural and cyto-chemical analysis of the staining of synaptic junctions with phosphotungstic acid. J Ultrastruct Res. 1968;22:361–375. - PubMed

Publication types

Substances