. 2012 Jun;24(6):2562-77.
doi: 10.1105/tpc.112.097394. Epub 2012 Jun 8.

DWARF AND LOW-TILLERING acts as a direct downstream target of a GSK3/SHAGGY-like kinase to mediate brassinosteroid responses in rice

Affiliations

DWARF AND LOW-TILLERING acts as a direct downstream target of a GSK3/SHAGGY-like kinase to mediate brassinosteroid responses in rice

Hongning Tong et al. Plant Cell. 2012 Jun.

Abstract

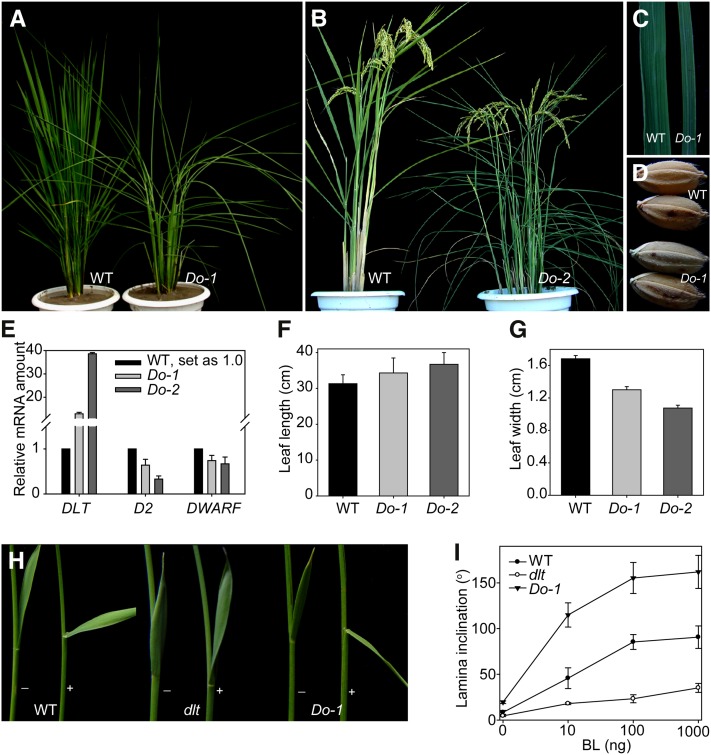
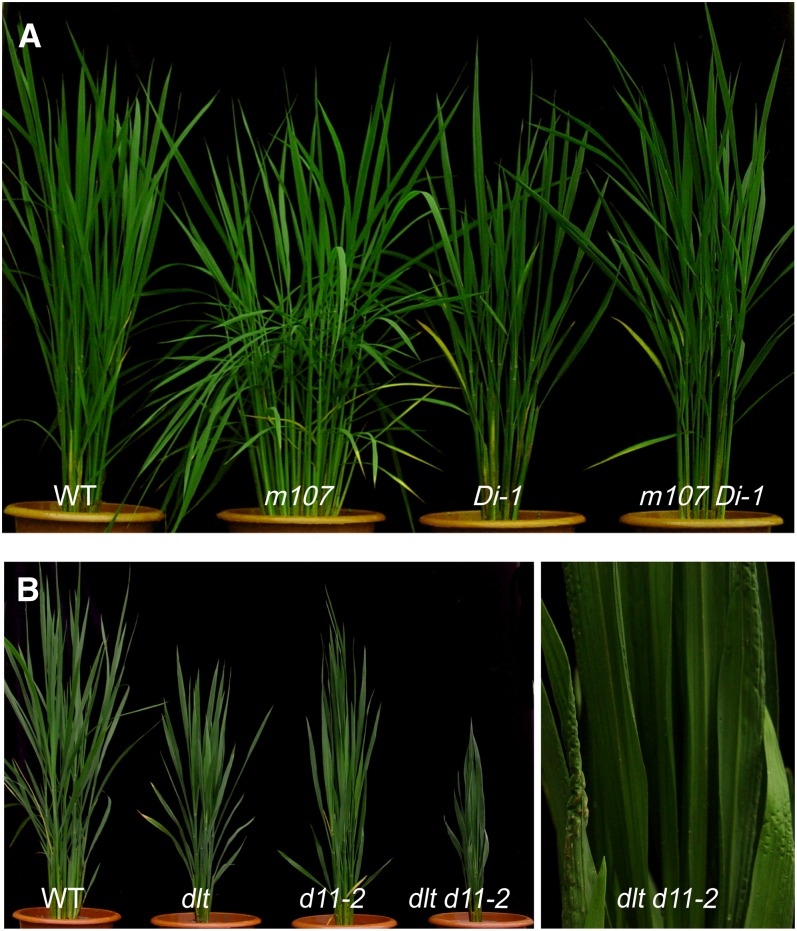
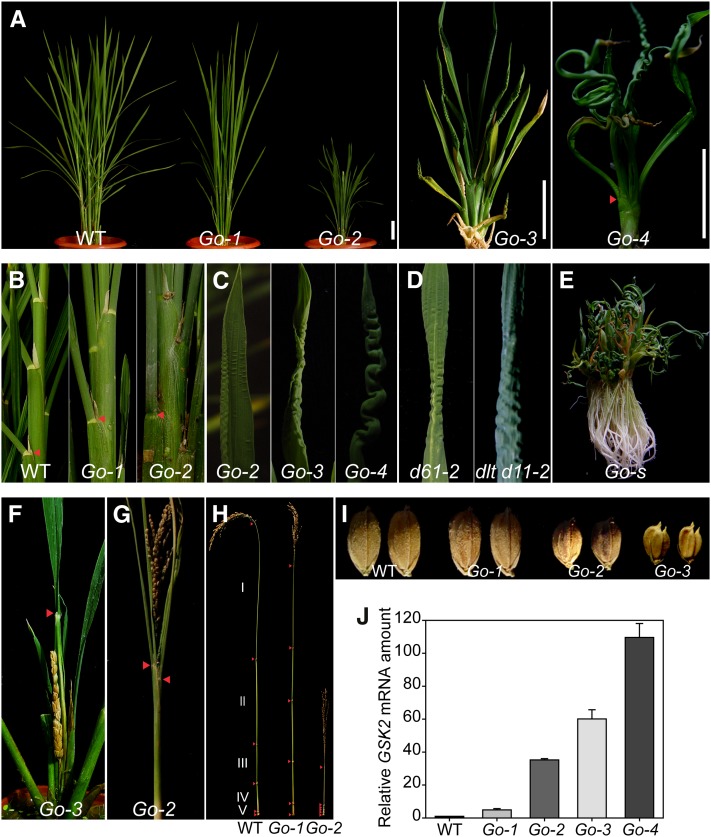
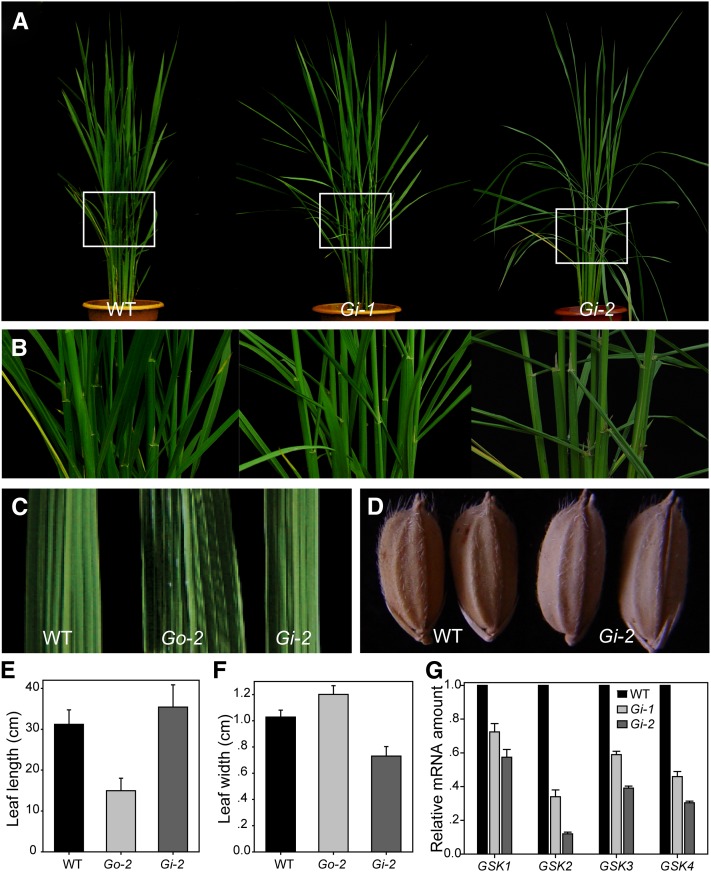
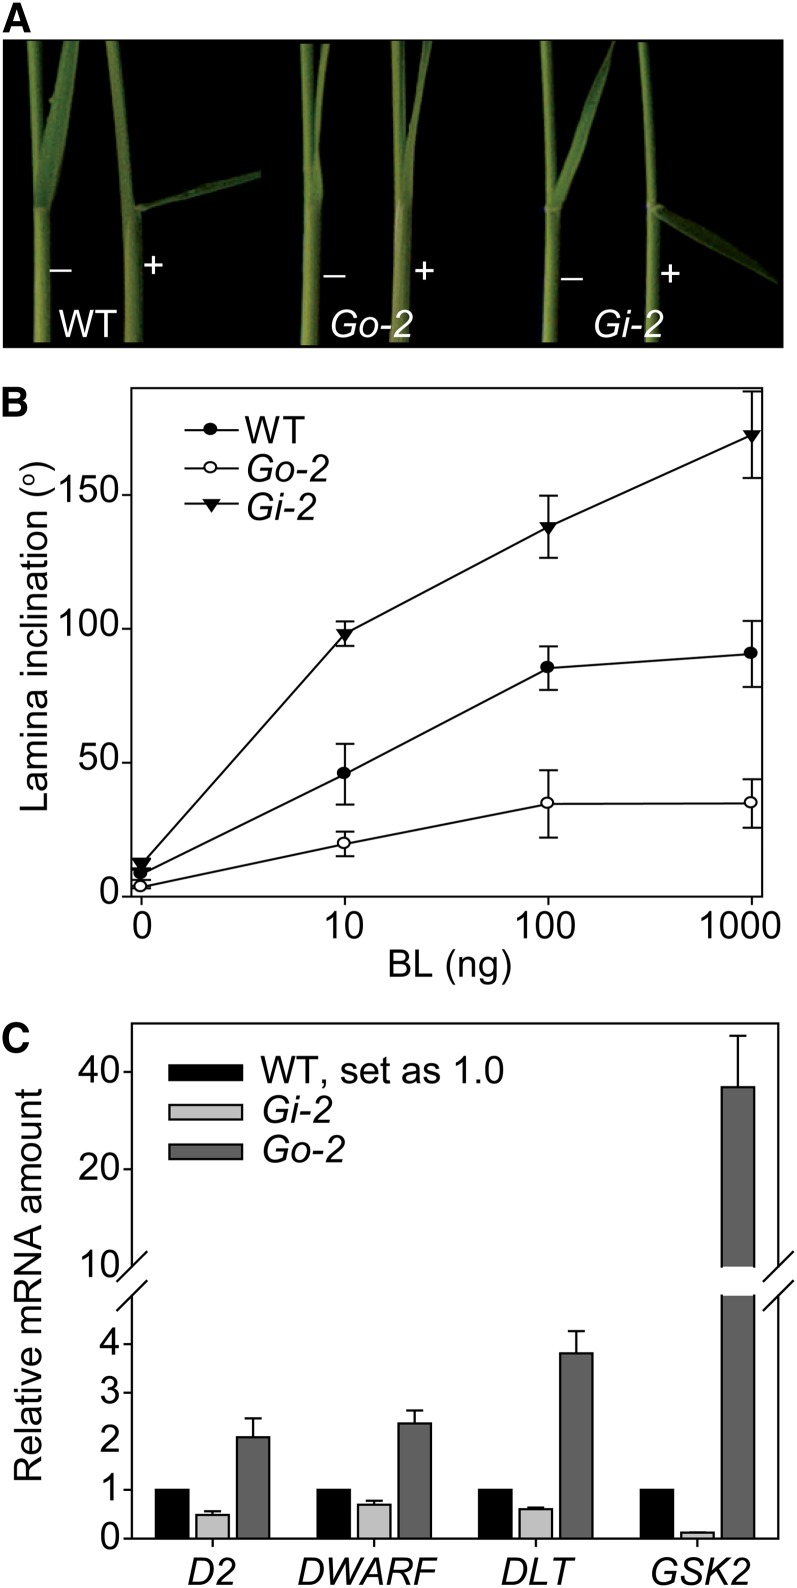
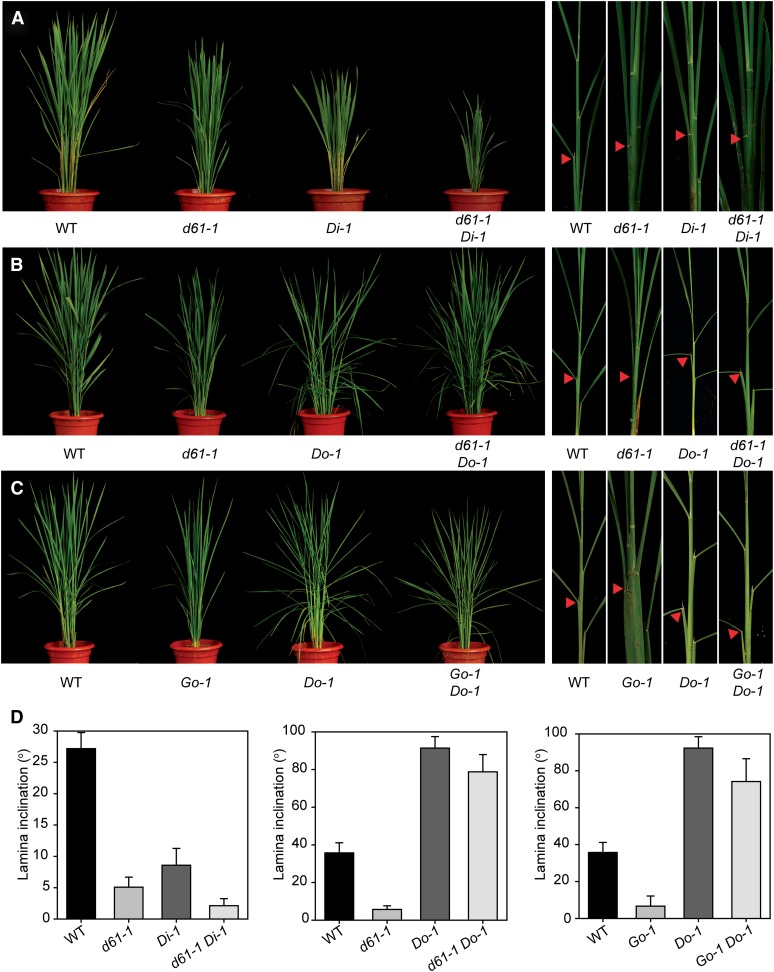
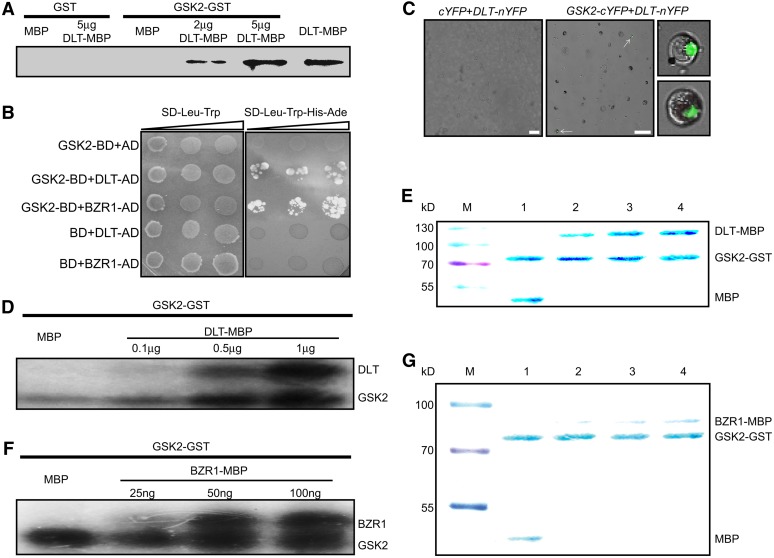
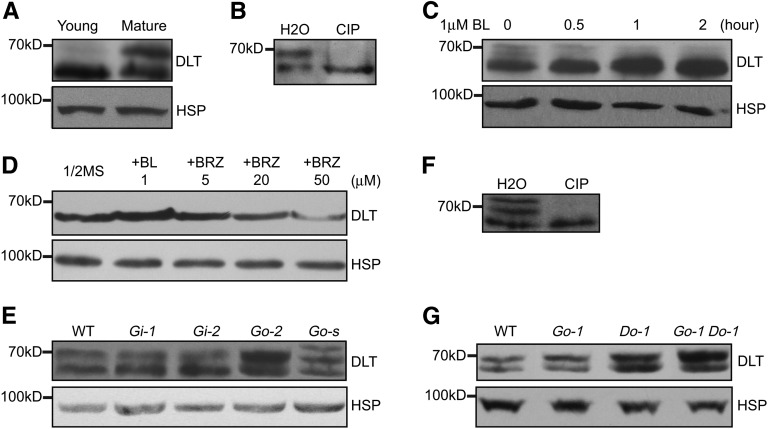
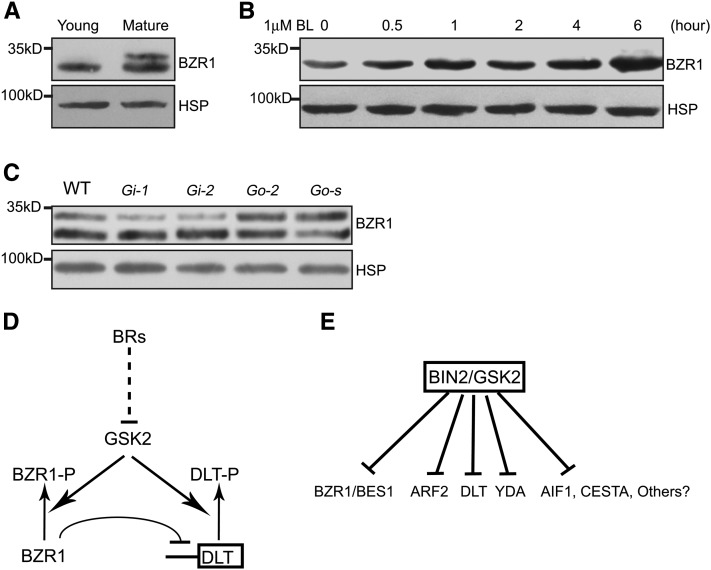
In Arabidopsis thaliana, the GSK3/SHAGGY-like kinase BRASSINOSTEROID-INSENSITIVE2 (BIN2) plays a critical role in the brassinosteroid (BR) signaling pathway by negatively regulating the activities of bri1-EMS-SUPPRESSOR1/BRASSINAZOLE-RESISTANT1 family transcription factors that regulate the expression of downstream BR-responsive genes. In this study, we analyzed the function of a rice (Oryza sativa) GSK3/SHAGGY-like kinase (GSK2), which is one of the orthologs of BIN2. Overexpression of GSK2 (Go) led to plants with typical BR loss-of-function phenotypes, and suppression of GSK2 resulted in enhanced BR signaling phenotypes. DWARF AND LOW-TILLERING (DLT) is a positive regulator that mediates several BR responses in rice. Suppression of DLT can enhance the phenotypes of BR receptor mutant d61-1, and overexpression of DLT obviously suppressed the BR loss-of-function phenotypes of both d61-1 and Go, suggesting that DLT functions downstream of GSK2 to modulate BR responses. Indeed, GSK2 can interact with DLT and phosphorylate DLT. Moreover, brassinolide treatment can induce the dephosphorylation of DLT, leading to the accumulation of dephosphorylated DLT protein. In GSK2 transgenic plants, the DLT phosphorylation level is dictated by the GSK2 level. These results demonstrate that DLT is a GSK2 substrate, further reinforcing that the BIN2/GSK2 kinase has multiple substrates that carry out various BR responses.


Figures

Figure 1.
Figure 1.
DLT Overexpression Plants (Do) Have Enhanced BR Signaling Phenotypes. (A) and (B) Gross morphology of typical Do at vegetative phase (A) and at reproductive phase (B). WT, wild-type. (C) Leaf width comparison between wild type and Do-1. (D) Seed morphology of wild type and Do-1. (E) qRT-PCR analysis of DLT, D2, and DWARF expression in Do compared with the wild type. Two-week-old seedlings were used for the analysis. (F) and (G) Quantification of flag leaf length (F) and width (G) in Do compared with the wild type. Bars indicate sd (n = 12). (H) BL sensitivity test of the wild type, dlt and Do-1 by lamina inclination experiments. The plus and minus symbols indicate with/without BL (100 ng). (I) Quantification of the data in (H). Results using a range of BL amounts are shown. Bars indicate sd (n = 12).
Figure 2.
Figure 2.
Knockdown of DLT Can Suppress the BR-Overdose Phenotype and Enhance the BR-Deficient Phenotype. (A) Morphology comparison of m107, Di-1, and m107 Di-1 double mutant with the wild type (WT). (B) Gross morphology of the wild type, dlt, d11-2, and dlt d11-2 double mutant. The right image highlights the wrinkled leaves of dlt d11-2.
Figure 3.
Figure 3.
Phenotypes of GSK2 Overexpression Plants (Go). (A) Gross morphology of GSK2-1 overexpression plants arranged according to their phenotype severities (Go-1 to Go-4). Arrowhead indicates lamina joint. WT, the wild type. Bars = 5 cm. (B) Close-up views of leaf angles of the wild type, Go-1, and Go-2. Arrowheads indicate lamina joints. (C) Close-up views of increasingly severe frizzled leaf phenotypes in Go-2, Go-3, and Go-4. (D) Frizzled leaf phenotype in d61-2 and dlt d11-2 mutants. (E) A GSK2-1 overexpression plant with severe phenotypes (Go-s). (F) A mature panicle enclosed in the flag leaf sheath. Arrowhead indicates the lamina joint of the flag leaf. (G) Erect leaves and panicle of Go-2 at harvesting time. Arrowheads indicate lamina joints. (H) Internode distribution of the wild type, Go-1, and Go-2. Arrowheads indicate nodes. (I) Seed morphology of the wild type and Go-1 to Go-3. (J) qRT-PCR analysis of GSK2 expression levels in different transgenic lines compared with the wild type. Flag leaves were used for the analysis.
Figure 4.
Figure 4.
Phenotypes of GSK2-RNAi Plants (Gi). (A) Gross morphology of two Gi lines compared with the wild type (WT). (B) Magnified lamina joint zones corresponding to the frames indicated in (A). (C) Comparison of leaf width of the wild type, Go-2, and Gi-2. (D) Seed morphology of the wild type and Gi-2. (E) and (F) Quantification of flag leaf length (E) and width (F) in Go-2 and Gi-2. Bars indicate sd (n = 10). (G) qRT-PCR analysis of expression levels of GSK2 and its three homologous genes in the wild type, Gi-1, and Gi-2. Flag leaves were used for the analysis. GSK1, Os01g10840; GSK3, Os05g11730; GSK4, Os06g35530.
Figure 5.
Figure 5.
Altered BR Sensitivity and BR-Related Gene Expression in Go-2 and Gi-2. (A) BL sensitivity test of the wild type (WT), Go-2, and Gi-2 by lamina inclination experiment. The plus and minus symbols indicate with/without BL (100 ng). (B) Quantification of the data shown in (A). Results using a range of BL amounts are shown. Bars indicate sd (n = 12). (C) qRT-PCR analysis of D2, DWARF, DLT, and GSK2 expression levels in Go-2 and Gi-2 compared with the wild type. Flag leaves were used for the analysis.
Figure 6.
Figure 6.
Genetic Analysis of DLT, BRI1, and GSK2. Phenotypic comparisons between different mutants or transgenic lines and their crosses. A representative tiller corresponding to each line is shown in the right panels in (A) to (C). Arrowheads indicate leaves at similar positions for angle comparisons and measurements in (D). (A) Morphology comparison of d61-1, Di-1, and d61-1 Di-1 double mutant with the wild type (WT). (B) Morphology comparison of d61-1, Do-1, and d61-1 Do-1 double mutant with the wild type. (C) Morphology comparison of Go-1, Do-1, and Go-1 Do-1 double mutant with the wild type. (D) Quantitative comparison of lamina inclination of different lines analyzed in (A) to (C). Angles of leaves at similar positions as indicated by arrowheads in (A) to (C) were measured. Bars indicate sd (n = 10).
Figure 7.
Figure 7.
GSK2 Can Interact with and Phosphorylate DLT and BZR1. (A) GST pull-down assay of DLT and GSK2 interaction. Five micrograms of GST or GSK2-GST coupled beads were used to pull down 5 μg MBP or the indicated amount of DLT-MBP protein. Anti-MBP antibody was used to detect output protein. (B) Yeast two-hybrid analysis of GSK2 and DLT as well as BZR1 interaction. Cotransformed yeast clones were serial diluted and then placed on SD dropout plates to detect reporter gene expression. (C) BiFC analysis of GSK2 and DLT interaction. Fluorescence can be observed only in cells cotransfected with GSK2-cYFP and DLT-nYFP plasmids. Arrows indicate cells with fluorescence, which are enlarged in the right panels. Bars = 50 μm. (D) and (F) In vitro phosphorylation analysis. GSK2-GST (0.5 μg) was used to phosphorylate 0.5 μg MBP or indicated amount of DLT-MBP (D) or BZR1-MBP (F) with [γ-32P]ATP. The bottom bands, labeled GSK2, represent GSK2 autophosphorylation signals. (E) and (G) Coomassie blue staining of proteins used for the phosphorylation analysis in (D) and (F). Lanes 1 to 4 of (E) and (G) correspond to the four lanes in (D) and (F), respectively. M, protein size marker.
Figure 8.
Figure 8.
Detection of DLT Protein Level and Form in Plants. DLT protein was detected by immunoblot with anti-DLT antibody. Rice HSP (∼90 kD) was used as the internal reference, which was detected on a duplicated filter using anti-HSP antibody, indicating equal loading of total proteins. (A) Differential expression pattern of DLT between young and mature leaves. Young, 4-d-old seedling leaves. Mature, fully expanded flag leaves. (B) Immunoprecipitated DLT protein from mature flag leaves was treated with CIP or water (H2O). (C) Induction of DLT protein accumulation by BL treatment. Four-day-old d2 seedlings were used for the treatment. (D) Effect of BRZ on DLT level. Two-week-old seedlings grown on 0.5× Murashige and Skoog medium supplemented with or without 1 μM BL or different concentrations of BRZ were sampled for the analysis. (E) Comparison of DLT protein level and form in the wild type (WT), Gi, and Go. Go-s represents a GSK2-1 overexpression line with severe phenotypes. Mature leaves were used for the analysis. (F) Immunoprecipitated DLT protein from Go-s was treated with CIP. Mature leaves were used for the analysis. (G) Comparison of DLT protein level and form in the wild type, Go-1, Do-1, and Go-1 Do-1. Mature leaves were used for the analysis.
Figure 9.
Figure 9.
BZR1 Has a Similar Accumulation Pattern as DLT in Rice. BZR1 protein was detected by immunoblotting with anti-Os BZR1 antibody. Rice HSP, which was detected with anti-HSP antibody, was used as the internal reference indicating equal loading of proteins. (A) Differential accumulation pattern of BZR1 between young and mature leaves. Young, 4-d-old seedling leaves. Mature, fully expanded flag leaves. (B) Induction of BZR1 protein accumulation by BL treatment in rice. Four-day-old d2 seedlings were used for the treatment. (C) Comparison of BZR1 protein level and form in the wild type (WT), Gi, and Go. Go-s represents a GSK2-1 overexpression line with severe phenotypes. Mature leaves were used for the analysis. (D) Proposed working model for GSK2, BZR1, and DLT. BR induces protein accumulation of BZR1 and DLT through repressing GSK2 activity. GSK2 inhibits both BZR1 and DLT by phosphorylation. BZR1 can bind to the DLT promoter to repress DLT transcription. (E) A hypothetical model of the BR signal magnification mechanism. Multiple substrates of BIN2/GSK2 may act redundantly, specifically, or competitively to mediate various BR responses.

References

    1. Bai M.Y., Zhang L.Y., Gampala S.S., Zhu S.W., Song W.Y., Chong K., Wang Z.Y. (2007). Functions of OsBZR1 and 14-3-3 proteins in brassinosteroid signaling in rice. Proc. Natl. Acad. Sci. USA 104: 13839–13844 - PMC - PubMed
    1. Bart R., Chern M., Park C.-J., Bartley L., Ronald P.C. (2006). A novel system for gene silencing using siRNAs in rice leaf and stem-derived protoplasts. Plant Methods 2: 13–21 - PMC - PubMed
    1. Bilgin D.D., DeLucia E.H., Clough S.J. (2009). A robust plant RNA isolation method suitable for Affymetrix GeneChip analysis and quantitative real-time RT-PCR. Nat. Protoc. 4: 333–340 - PubMed
    1. Choe S., Schmitz R.J., Fujioka S., Takatsuto S., Lee M.O., Yoshida S., Feldmann K.A., Tax F.E. (2002). Arabidopsis brassinosteroid-insensitive dwarf12 mutants are semidominant and defective in a glycogen synthase kinase 3beta-like kinase. Plant Physiol. 130: 1506–1515 - PMC - PubMed
    1. Clouse S.D. (2002). Brassinosteroid signal transduction: Clarifying the pathway from ligand perception to gene expression. Mol. Cell 10: 973–982 - PubMed

Publication types

MeSH terms