Integrative comparative analyses of transcript and metabolite profiles from pepper and tomato ripening and development stages uncovers species-specific patterns of network regulatory behavior
- PMID: 22685169
- PMCID: PMC3425208
- DOI: 10.1104/pp.112.199711
Integrative comparative analyses of transcript and metabolite profiles from pepper and tomato ripening and development stages uncovers species-specific patterns of network regulatory behavior
Abstract
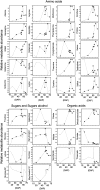
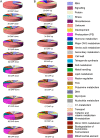
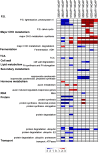
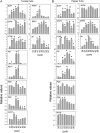
Integrative comparative analyses of transcript and metabolite levels from climacteric and nonclimacteric fruits can be employed to unravel the similarities and differences of the underlying regulatory processes. To this end, we conducted combined gas chromatography-mass spectrometry and heterologous microarray hybridization assays in tomato (Solanum lycopersicum; climacteric) and pepper (Capsicum chilense; nonclimacteric) fruits across development and ripening. Computational methods from multivariate and network-based analyses successfully revealed the difference between the covariance structures of the integrated data sets. Moreover, our results suggest that both fruits have similar ethylene-mediated signaling components; however, their regulation is different and may reflect altered ethylene sensitivity or regulators other than ethylene in pepper. Genes involved in ethylene biosynthesis were not induced in pepper fruits. Nevertheless, genes downstream of ethylene perception such as cell wall metabolism genes, carotenoid biosynthesis genes, and the never-ripe receptor were clearly induced in pepper as in tomato fruit. While signaling sensitivity or actual signals may differ between climacteric and nonclimacteric fruit, the evidence described here suggests that activation of a common set of ripening genes influences metabolic traits. Also, a coordinate regulation of transcripts and the accumulation of key organic acids, including malate, citrate, dehydroascorbate, and threonate, in pepper fruit were observed. Therefore, the integrated analysis allows us to uncover additional information for the comprehensive understanding of biological events relevant to metabolic regulation during climacteric and nonclimacteric fruit development.
Figures


Similar articles
-
Non-climacteric fruit ripening in pepper: increased transcription of EIL-like genes normally regulated by ethylene.Funct Integr Genomics. 2010 Mar;10(1):135-46. doi: 10.1007/s10142-009-0136-9. Epub 2009 Sep 16. Funct Integr Genomics. 2010. PMID: 19756789
-
The MADS-RIPENING INHIBITOR-DIVARICATA1 module regulates carotenoid biosynthesis in nonclimacteric Capsicum fruits.Plant Physiol. 2025 Feb 7;197(2):kiaf013. doi: 10.1093/plphys/kiaf013. Plant Physiol. 2025. PMID: 39797909
-
A non-climacteric fruit gene CaMADS-RIN regulates fruit ripening and ethylene biosynthesis in climacteric fruit.PLoS One. 2014 Apr 21;9(4):e95559. doi: 10.1371/journal.pone.0095559. eCollection 2014. PLoS One. 2014. PMID: 24751940 Free PMC article.
-
Nitro-oxidative metabolism during fruit ripening.J Exp Bot. 2018 Jun 19;69(14):3449-3463. doi: 10.1093/jxb/erx453. J Exp Bot. 2018. PMID: 29304200 Review.
-
Genetic and molecular regulation of fruit and plant domestication traits in tomato and pepper.J Exp Bot. 2007;58(14):3841-52. doi: 10.1093/jxb/erm257. Epub 2007 Nov 23. J Exp Bot. 2007. PMID: 18037678 Review.
Cited by
-
Identification of miRNAs and Their Targets Involved in Flower and Fruit Development across Domesticated and Wild Capsicum Species.Int J Mol Sci. 2021 May 4;22(9):4866. doi: 10.3390/ijms22094866. Int J Mol Sci. 2021. PMID: 34064462 Free PMC article.
-
Biomass composition explains fruit relative growth rate and discriminates climacteric from non-climacteric species.J Exp Bot. 2020 Oct 7;71(19):5823-5836. doi: 10.1093/jxb/eraa302. J Exp Bot. 2020. PMID: 32592486 Free PMC article.
-
Metabolic studies in plant organs: don't forget dilution by growth.Front Plant Sci. 2014 Mar 11;5:85. doi: 10.3389/fpls.2014.00085. eCollection 2014. Front Plant Sci. 2014. PMID: 24653732 Free PMC article. No abstract available.
-
Integrated Proteo-Transcriptomic Analyses Reveal Insights into Regulation of Pollen Development Stages and Dynamics of Cellular Response to Apple Fruit Crinkle Viroid (AFCVd)-Infection in Nicotiana tabacum.Int J Mol Sci. 2020 Nov 18;21(22):8700. doi: 10.3390/ijms21228700. Int J Mol Sci. 2020. PMID: 33218043 Free PMC article.
-
Galacturonosyltransferase 4 silencing alters pectin composition and carbon partitioning in tomato.J Exp Bot. 2013 May;64(8):2449-66. doi: 10.1093/jxb/ert106. Epub 2013 Apr 18. J Exp Bot. 2013. PMID: 23599271 Free PMC article.
References
-
- Aharoni A, O’Connell AP. (2002) Gene expression analysis of strawberry achene and receptacle maturation using DNA microarrays. J Exp Bot 53: 2073–2087 - PubMed
-
- Aharoni A, Ric de Vos CH, Verhoeven HA, Maliepaard CA, Kruppa G, Bino R, Goodenowe DB. (2002) Nontargeted metabolome analysis by use of Fourier transform ion cyclotron mass spectrometry. OMICS 6: 217–234 - PubMed
-
- Alba R, Fei Z, Payton P, Liu Y, Moore SL, Debbie P, Cohn J, D’Ascenzo M, Gordon JS, Rose JK, et al. (2004) ESTs, cDNA microarrays, and gene expression profiling: tools for dissecting plant physiology and development. Plant J 39: 697–714 - PubMed
Publication types
MeSH terms
Substances
LinkOut - more resources
Full Text Sources

