. 2012 Jul;153(7):3054-65.
doi: 10.1210/en.2011-2170. Epub 2012 Jun 8.

Overlap of endocrine hormone expression in the mouse intestine revealed by transcriptional profiling and flow cytometry

Affiliations

Overlap of endocrine hormone expression in the mouse intestine revealed by transcriptional profiling and flow cytometry

Abdella M Habib et al. Endocrinology. 2012 Jul.

Abstract

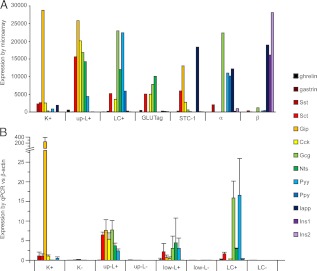
The intestine secretes a range of hormones with important local and distant actions, including the control of insulin secretion and appetite. A number of enteroendocrine cell types have been described, each characterized by a distinct hormonal signature, such as K-cells producing glucose-dependent insulinotropic polypeptide (GIP), L-cells producing glucagon-like peptide-1 (GLP-1), and I-cells producing cholecystokinin (CCK). To evaluate similarities between L-, K-, and other enteroendocrine cells, primary murine L- and K-cells, and pancreatic α- and β-cells, were purified and analyzed by flow cytometry and microarray-based transcriptomics. By microarray expression profiling, L cells from the upper small intestinal (SI) more closely resembled upper SI K-cells than colonic L-cells. Upper SI L-cell populations expressed message for hormones classically localized to different enteroendocrine cell types, including GIP, CCK, secretin, and neurotensin. By immunostaining and fluorescence-activated cell sorting analysis, most colonic L-cells contained GLP-1 and PeptideYY In the upper SI, most L-cells contained CCK, approximately 10% were GIP positive, and about 20% were PeptideYY positive. Upper SI K-cells exhibited approximately 10% overlap with GLP-1 and 6% overlap with somatostatin. Enteroendocrine-specific transcription factors were identified from the microarrays, of which very few differed between the enteroendocrine cell populations. Etv1, Prox1, and Pax4 were significantly enriched in L-cells vs. K cells by quantitative RT-PCR. In summary, our data indicate a strong overlap between upper SI L-, K-, and I-cells and suggest they may rather comprise a single cell type, within which individual cells exhibit a hormonal spectrum that may reflect factors such as location along the intestine and exposure to dietary nutrients.


Figures

Fig. 1.
Fig. 1.
Microarray expression profile comparisons between intestinal and endocrine cell populations. A—I, RMA intensities of individual microarray probes are compared between different cell types and plotted on a log (10) scale: Upper SI L-cells and their controls (L+, L−), K-cells and controls (K+, K−), colonic L-cells and controls (LC+, LC−), pancreatic α- and β-cells, and STC1 and GLUTag cells. Solid and dashed lines represent 2- and 10-fold differences, respectively, between the populations. Data points represent the mean of two or three replicates. Correlation coefficients (ρ) were determined from the mean data. J, Dendrogram showing the relationships between K+, L+, LC+, GLUTag, and STC-1 cells as determined by Hierarchical Cluster Analysis.
Fig. 2.
Fig. 2.
Expression of hormonal transcripts. A, Mean microarray RMA intensities for probes against known intestinal and pancreatic hormones in K-cells (K+), upper SI L-cells (L+), colonic L-cells (LC+), model cell lines GLUTag and STC-1, and in pancreatic α- and β-cells (n = 2–3 each). B, Expression of gut hormones measured by quantitative RT-PCR. Data are expressed relative to that of β-actin measured in parallel in the same samples. SI L-cells were collected separately from the upper third (up L+) and lower third (low L+) of the SI, together with nonfluorescent control cells from the same region. Columns represent means and se values (n = 3–6 per sample).
Fig. 3.
Fig. 3.
FACS analysis of GLP-1 and PYY staining in colonic cells. A, Single-cell colonic suspensions from GLU-Venus mice were analyzed by FACS. Cells were stained with a red secondary antibody and excited at 488 nm and 561 nm. Green fluorescence from the 488 laser (detecting Venus) is plotted vs. red fluorescence from the 561 laser. B, Cells, as in panel A, were stained with anti-GLP-1 antibody and a red secondary. R2 indicates cells that were positive in the red channel. C, Cells were excited with a 488-nm excitation laser. Green (530) and yellow (580) fluorescence are plotted on logarithmic axes. The gated region R1 outlines Venus-positive cells. D, Cells were stained as in panel B. The plot shows only the Venus-positive cell population, identified from the R1 region of panel C, but now the red fluorescence is plotted against green fluorescence. R4 outlines all Venus-positive cells, and R3 delineates strongly immunopositive cells. E, Frequency histogram of the red fluorescence of all Venus-positive cells (identified from R1 in C; dark shading) and the red fluorescence of all cells appearing in R2 in B (light shading). The y-axis represents an arbitrary scale, determined by the total number of cells analyzed. F, PYY staining, analyzed as in panels A–D and represented as in panel E. G, Mean data (n = 3) from experiments performed as in panels A–F, representing the percentage of Venus-positive cells that stained positive for GLP-1 or PYY, calculated as the number of cells in R3/R4*100%. H, Mean data (n = 3) from experiments as in panel A–F, representing the percentage of strongly red fluorescent cells (R2 in panel B) that were also positive for Venus (determined by whether they also appeared in R1 when visualized as in panel C). Ab, Antibody.
Fig. 4.
Fig. 4.
FACS analysis of SI cells from GLU-Venus mice. A–C, Single-cell upper SI suspensions from GLU-Venus mice were stained with antibodies against GLP-1 (A), GIP (B), or CCK (C), and a red secondary antibody, and analyzed by FACS. Venus-positive cells were identified as in Fig. 3C, and antibody-positive cells were identified as in Fig. 3B. Frequency histograms represent the red fluorescence of all Venus-positive cells (dark shading) or all strongly red fluorescent cells (light shading). Y-axes represent an arbitrary scale. D, Mean data from experiments performed as in panels A–C with cell suspension isolated from the upper or lower small intestine, representing the percentages of Venus-positive cells that stained positive for GLP-1, GIP, CCK, or PYY. Data represent the mean and se of the number of samples indicated. Statistical significance of hormone expression differences between upper and lower small intestine was assessed by Student's t test; *, P < 0.05; ***, P < 0.001. E, Mean data from experiments performed as in panels A–C, representing the percentage of red fluorescent cells that were also positive for Venus. Data represent the mean and se of the number of preparations indicated. F, Percentage of all cells from the upper SI that stained positive for the hormones indicated. Data represent the means and se values of the number of preparations indicated. G and H, Histograms representing GLP-1 (G) and PYY (H) staining of Venus-positive cell populations from the upper (light gray) and lower (mid gray) SI and colon (dark gray). Cells were stained with anti-GLP-1 and anti-PYY antibody and a red secondary and analyzed as in panels A–C. Only cells positive for Venus are shown. The y-axis represents the frequency, scaled according to the same total number of cells counted for each region, so the area under the curve represents the total proportion of Venus-positive cells. Ab, Antibody; a.u., arbitrary units.
Fig. 5.
Fig. 5.
FACS analysis of upper SI K-cells from GIP-Venus mice. A–D, Single-cell upper SI suspensions from GIP-Venus mice were stained with antibodies against GIP (A), GLP-1 (B), CCK (C), or Sst (D), and a red secondary, and analyzed by FACS. Venus-positive cells were identified as in Fig 3C, and antibody-positive cells were identified as in Fig 3B. Frequency histograms represent the red fluorescence of all Venus-positive cells (dark shading) or all strongly red fluorescent cells (light shading). Y-axes represent an arbitrary scale. E, Mean data from experiments performed as in panels A–D, representing the percentage of Venus-positive cells that also stained positive for GIP, GLP-1, Sst, or CCK. Data represent the mean and se of the number of preparations indicated. F, Mean data from experiments performed as in panels A–D, representing the percentage of red fluorescent cells that were also positive for Venus. Data represent the mean and se of the number of preparations indicated. Ab, Antibody; a.u., arbitrary units.
Fig. 6.
Fig. 6.
Chromogranins and secretogranins in enteroendocrine cells. A, Microarray RMA intensities for probes against chromogranin A (Chga), chromogranin B (Chgb), and secretogranins 2, 3, and 5 (Scg2, 3, 5) in upper SI K-cells (K+), upper SI L-cells (L+), and colonic L-cells (LC+), their respective control populations (K−, L−, LC−), and pancreatic α- and β-cells. B and C, Single upper SI suspensions from GLU-Venus mice were stained with a red secondary antibody (B), or with anti-CgA antibody plus red secondary, and analyzed by FACS. The regions R2 and R4 indicate strongly immunopositive cells, and the regions R1 and R3 outline the majority of the Venus-positive cells. D and E, Single-cell upper SI suspensions from GLU-Venus (D) or GIP-Venus (E) mice were stained with antibodies against CgA, and a red secondary, and analyzed by FACS. Venus-positive cells were identified as in Fig 3C, and antibody-positive cells were identified as in Fig 3B. Frequency histograms represent the red fluorescence of Venus-positive cells stained with secondary antibody only (R1, black line), Venus-positive cells stained for CgA (R3, dark shading), or all strongly red fluorescent cells (R4, light shading). Y-axes represent an arbitrary scale.
Fig. 7.
Fig. 7.
TF expression in enteroendocrine cells. Quantitative RT-PCR analysis of selected TF from Table 1. Expression in upper SI K-cells (K+), upper SI L-cells (L+), colonic L-cells (LC+), and their respective control populations (K−, L−, LC−) is shown relative to that of β-actin, measured in parallel in the same samples. Data represent the mean and se of n = 3 samples. Significant differences between K+, L+, and LC+ cells, identified by one-way ANOVA with post hoc Tukey's test, are indicated; *, P < 0.05; **, P < 0.01.

Comment in

Similar articles

Cited by

References

    1. Holst JJ. 2007. The physiology of glucagon-like peptide 1. Physiol Rev 87:1409–1439 - PubMed
    1. Baggio LL, Drucker DJ. 2007. Biology of incretins: GLP-1 and GIP. Gastroenterology 132:2131–2157 - PubMed
    1. Dockray GJ. 2009. Cholecystokinin and gut-brain signalling. Regul Pept 155:6–10 - PubMed
    1. Karra E, Batterham RL. 2010. The role of gut hormones in the regulation of body weight and energy homeostasis. Mol Cell Endocrinol 316:120–128 - PubMed
    1. Ahrén B. 2011. The future of incretin-based therapy: novel avenues–novel targets. Diabetes Obes Metab 13(Suppl 1):158–166 - PubMed

Publication types