. 2012 Aug 3;287(32):27189-203.
doi: 10.1074/jbc.M112.346932. Epub 2012 Jun 8.

Gemfibrozil, a lipid-lowering drug, induces suppressor of cytokine signaling 3 in glial cells: implications for neurodegenerative disorders

Affiliations

Gemfibrozil, a lipid-lowering drug, induces suppressor of cytokine signaling 3 in glial cells: implications for neurodegenerative disorders

Arunava Ghosh et al. J Biol Chem. .

Abstract

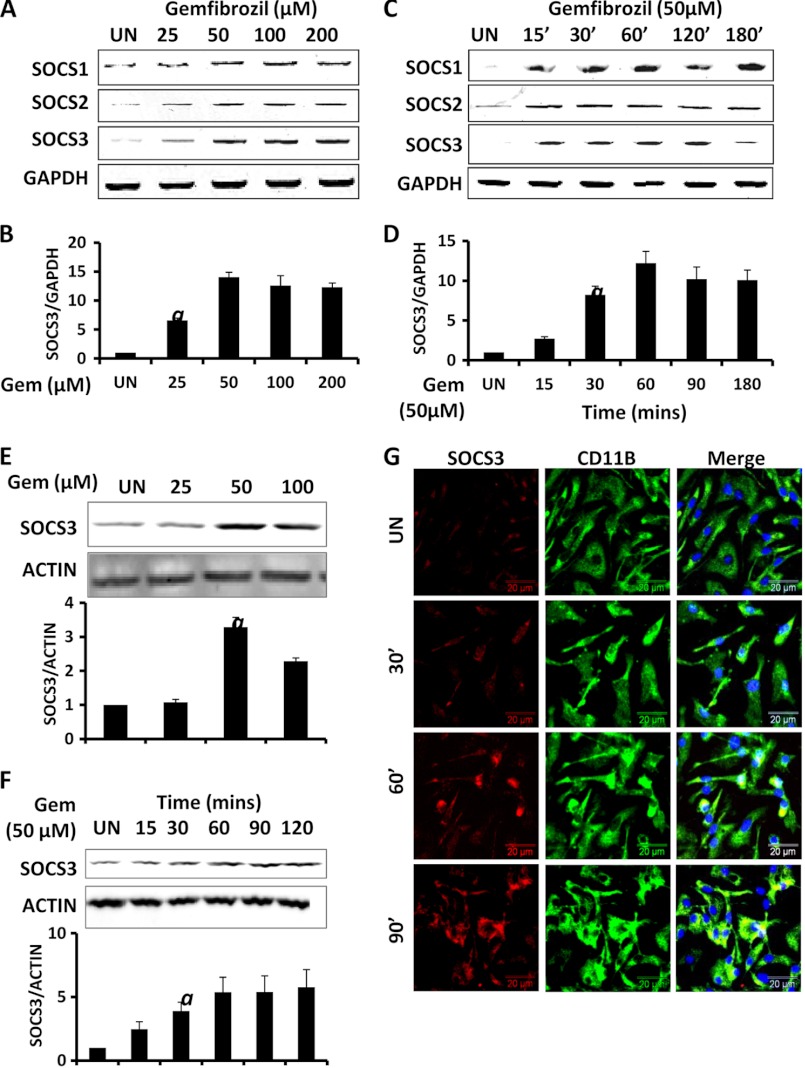
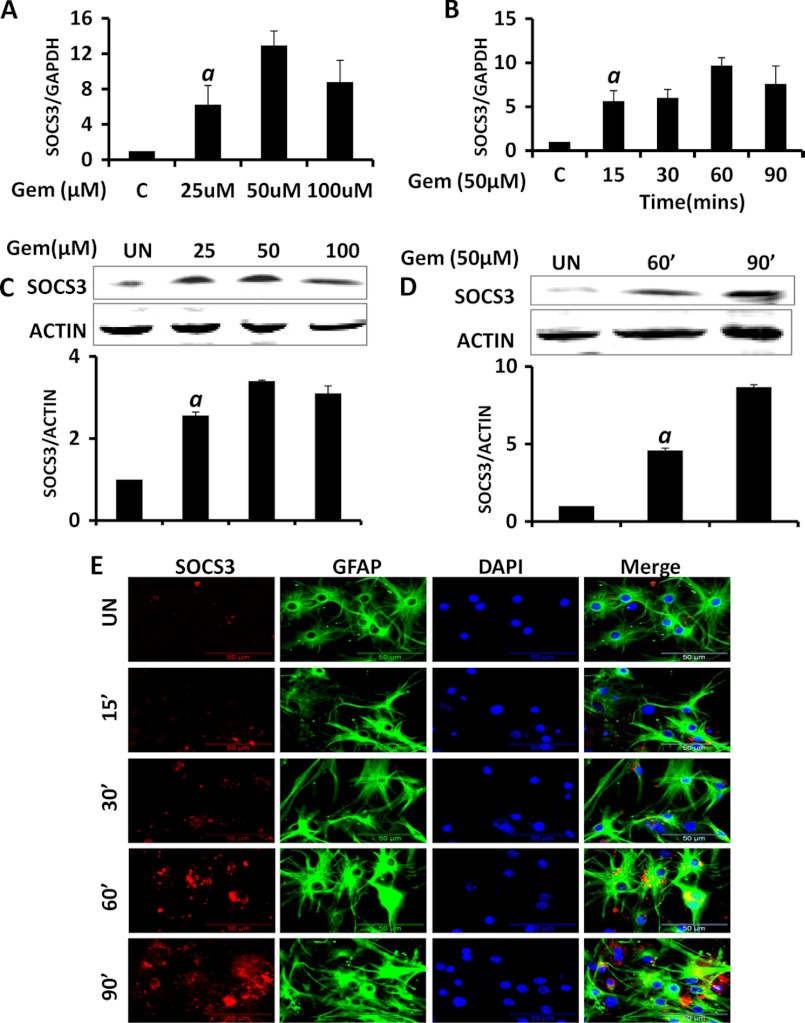
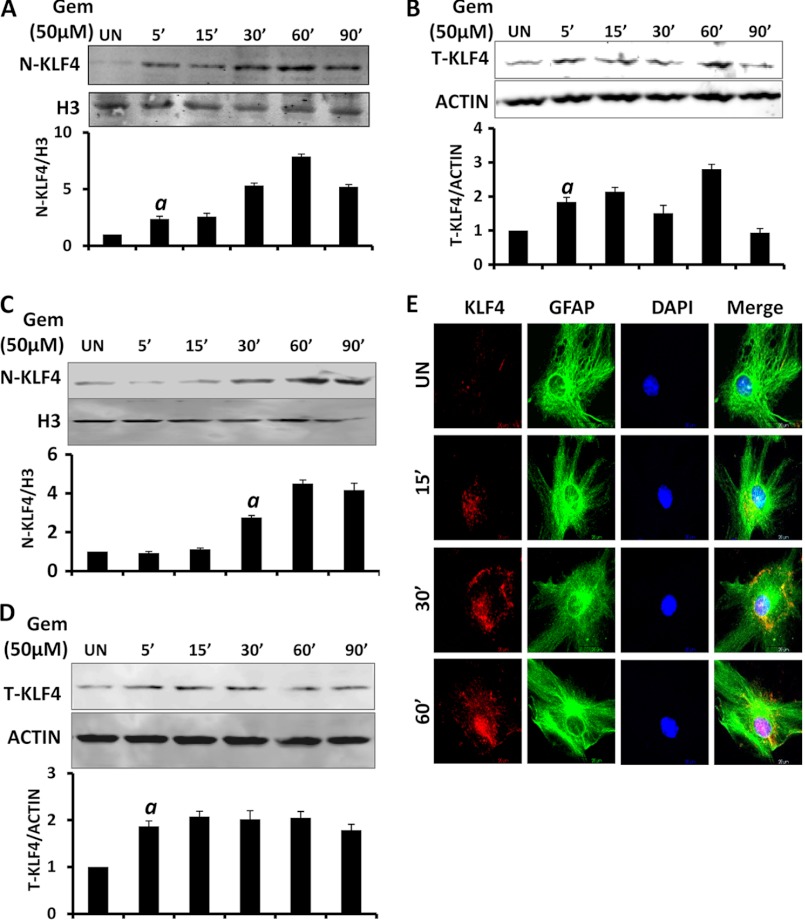
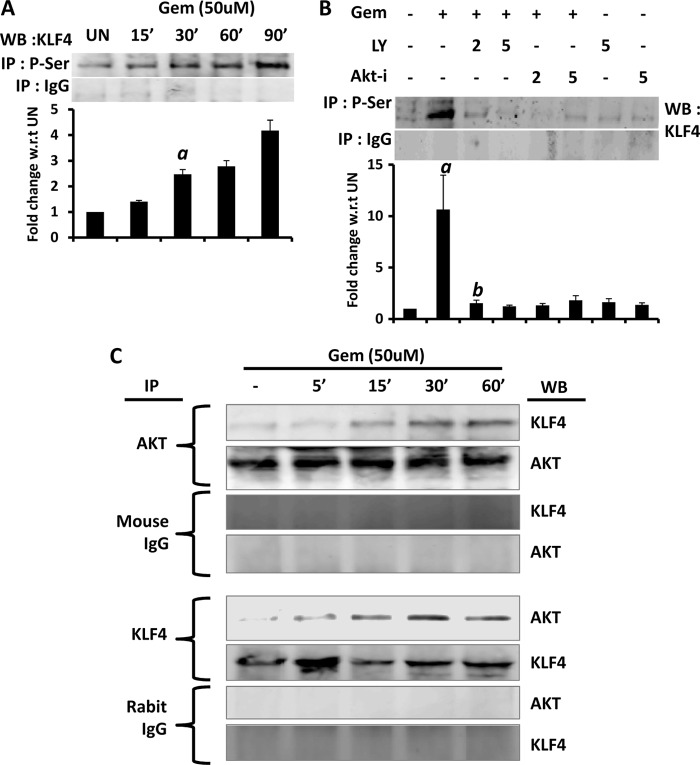
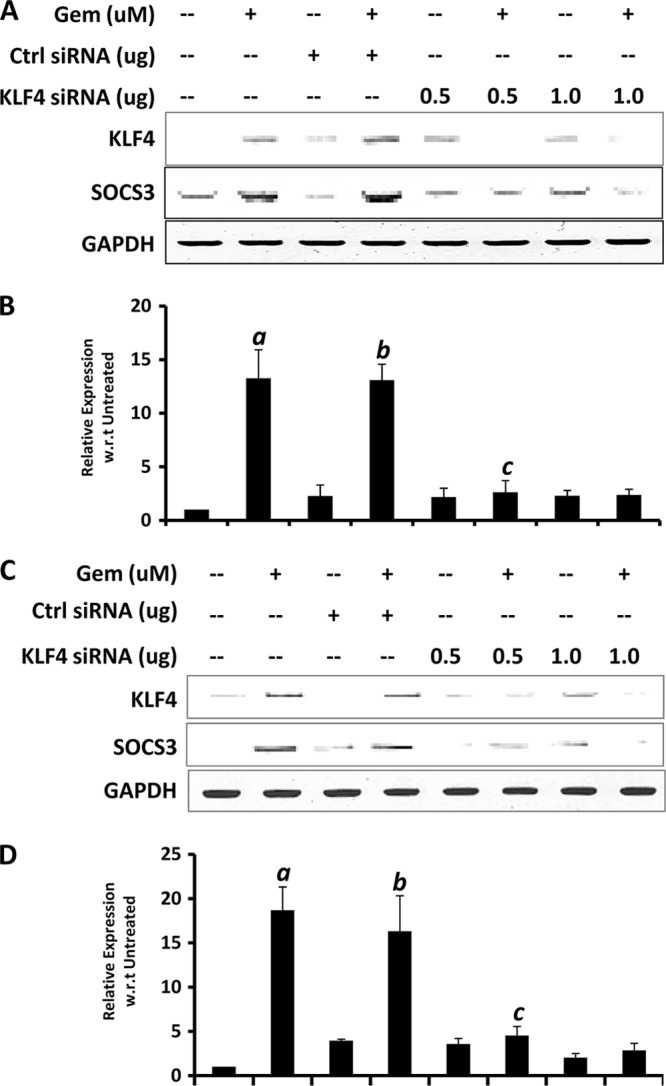
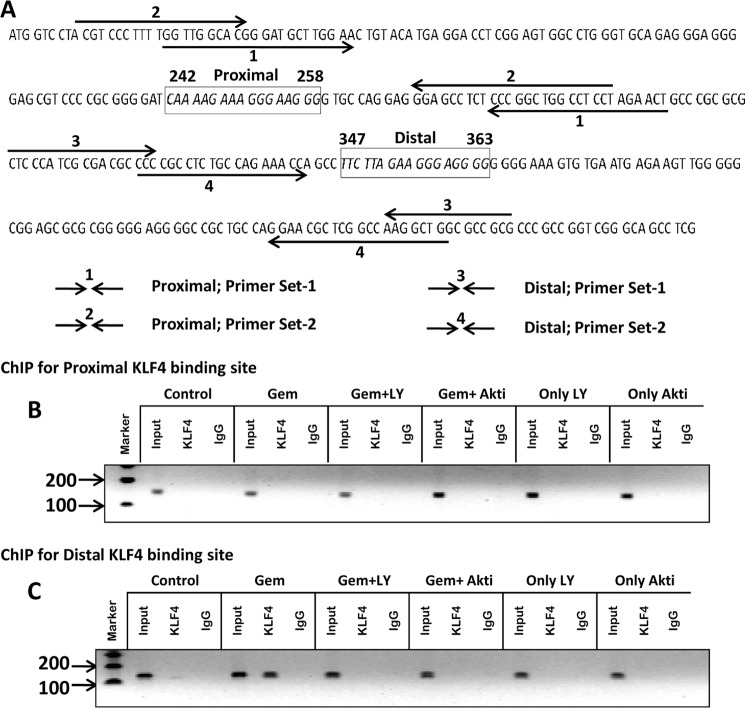
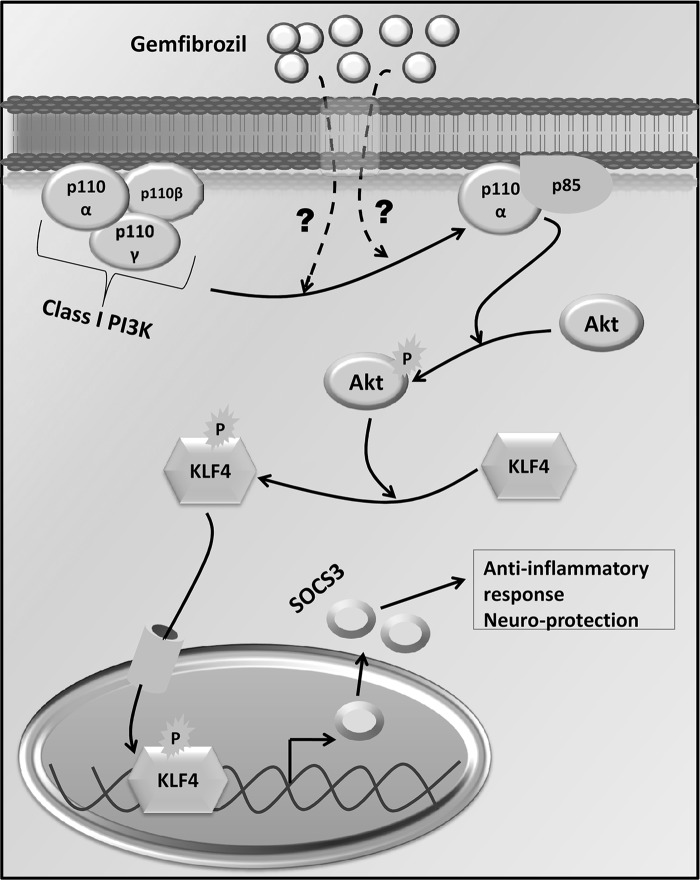
Glial inflammation is an important feature of several neurodegenerative disorders. Suppressor of cytokine signaling (SOCS) proteins play a crucial role in inhibiting cytokine signaling and inflammatory gene expression in various cell types, including glial cells. However, mechanisms by which SOCS genes could be up-regulated are poorly understood. This study underlines the importance of gemfibrozil, a Food and Drug Administration-approved lipid-lowering drug, in up-regulating the expression of SOCS3 in glial cells. Gemfibrozil increased the expression of Socs3 mRNA and protein in mouse astroglia and microglia in both a time- and dose-dependent manner. Interestingly, gemfibrozil induced the activation of type IA phosphatidylinositol (PI) 3-kinase and AKT. Accordingly, inhibition of PI 3-kinase and AKT by chemical inhibitors abrogated gemfibrozil-mediated up-regulation of SOCS3. Furthermore, we demonstrated that gemfibrozil induced the activation of Krüppel-like factor 4 (KLF4) via the PI 3-kinase-AKT pathway and that siRNA knockdown of KLF4 abrogated gemfibrozil-mediated up-regulation of SOCS3. Gemfibrozil also induced the recruitment of KLF4 to the distal, but not proximal, KLF4-binding site of the Socs3 promoter. This study delineates a novel property of gemfibrozil in up-regulating SOCS3 in glial cells via PI 3-kinase-AKT-mediated activation of KLF4 and suggests that gemfibrozil may find therapeutic application in neuroinflammatory and neurodegenerative disorders.


Figures

FIGURE 1.
FIGURE 1.
Up-regulation of SOCS3 by gemfibrozil in microglia. Mouse BV-2 microglial cells were treated with different concentrations of gemfibrozil in serum-free DMEM/F-12 for 1 h followed by monitoring the mRNA expression of Socs1/2/3 by semi-quantitative RT-PCR (A), real time PCR (for Socs3) (B), and Western blot (E). Graph represents densitometric analysis of SOCS3 protein levels normalized to β-actin (loading control). BV-2 cells were treated with 50 μm gemfibrozil for different minutes under the same culture conditions followed by monitoring the mRNA expression of Socs1/2/3 by semi-quantitative RT-PCR (C), real time PCR (for Socs3) (D), and Western blot (F). Graph represents densitometric analysis of SOCS3 protein levels normalized to β-actin (loading control). G, mouse primary microglia were treated with 50 μm gemfibrozil for different minutes under the same culture conditions and were double-labeled for SOCS3 and CD11b. DAPI was used to stain nuclei. All results are mean ± S.D. of at least three independent experiments. a, p < 0.001 versus control. UN, untreated; GEM, gemfibrozil. Scale bar, 20 μm.
FIGURE 2.
FIGURE 2.
Up-regulation of SOCS3 by gemfibrozil in astrocytes. Mouse primary astrocytes (MPA) were treated with different concentrations of gemfibrozil in serum-free DMEM/F-12 for 1 h followed by monitoring the mRNA expression of Socs3 by real time PCR (A) and Western blot (C). Graph represents densitometric analysis of SOCS3 protein levels normalized to β-actin (loading control (C)). Mouse primary astrocytes were treated with 50 μm gemfibrozil (GEM) for different minutes under the same culture conditions followed by monitoring the mRNA expression of Socs3 by real time PCR (B) and Western blot (D). Graph represents densitometric analysis of SOCS3 protein levels normalized to β-actin (loading control). E, mouse primary astrocytes were treated with 50 μm gemfibrozil for different minutes under the same culture conditions and were double-labeled for SOCS3 and GFAP. DAPI was used to stain nuclei. Results are mean ± S.D. of at least three independent experiments. a, p < 0.001 versus control. Scale bar, 50 μm. UN, untreated.
FIGURE 3.
FIGURE 3.
Activation of PI3K and AKT by gemfibrozil in microglia. A, mouse BV-2 microglial cells were treated with 50 μm gemfibrozil (Gem) under serum-free conditions for different minutes followed by analysis of the recruitment of p110α (panel i), p110β (panel ii), and p110γ (panel iii) to the cellular membrane via Western blot. TLR2 was used as a loading control for membrane fragments. B, densitometric analysis of dose-dependent change (relative to TLR2) of PI3K subunits by gemfibrozil treatment. C, BV-2 cells were treated with 50 μm gemfibrozil for different minutes followed by monitoring the activation of AKT by Western blot with antibodies against phospho-AKT and total AKT. D, densitometric analysis of dose-dependent change (relative to TLR2) of PI3K subunits by gemfibrozil treatment. Mouse primary microglia were treated with 50 μm gemfibrozil for different minutes followed by double-labeling for CD11b and either phospho-AKT (E) or total AKT (F). DAPI was used to stain nuclei. Results are means ± S.D. of at least three independent experiments. a, p < 0.001 versus control. Scale bar, 20 μm. UN, untreated.
FIGURE 4.
FIGURE 4.
Up-regulation of SOCS3 by gemfibrozil in glial cells via PI3K-AKT pathway. BV-2 microglial cells preincubated with different concentrations of wortmannin (Wo) and LY294002 (LY) (PI3K inhibitors) and AKT-I for 1 h were treated with 50 μm gemfibrozil (Gem) in serum-free conditions. After 1 h of treatment, the mRNA expression of Socs3 was monitored by quantitative real time PCR (A, wortmannin; B, LY294002; C, AKT-I). D, BV-2 cells pretreated with different concentrations of LY294002 and AKT-I for 1 h were treated with 50 μm gemfibrozil for 90 min followed by Western blot for SOCS3. Graph represents densitometric analysis of change in SOCS3 levels relative to β-actin. E, mouse primary astrocytes pretreated with different concentrations of LY294002 and AKT-I for 1 h were treated with 50 μm gemfibrozil for 90 min followed by Western blot for SOCS3. Graph represents densitometric analysis of change in SOCS3 levels relative to β-actin. Results are mean ± S.D. of three independent experiments. a, p < 0.001 versus control; b, p < 0.01 versus gemfibrozil.
FIGURE 5.
FIGURE 5.
Gemfibrozil induces the nuclear translocation of KLF4 in glial cells. BV-2 microglial cells were treated with 50 μm gemfibrozil (Gem) under serum-free conditions and at different minutes, and the level of KLF4 protein was monitored in nuclear extracts (A) and whole cell extract by Western blot (B). Histone 3 (H3) and β-actin were used as a loading control for nuclear extract and whole cell extract. respectively. Graphs represent densitometric analysis of the nuclear and total KLF4 normalized to their respective controls. Mouse primary astrocytes were treated with 50 μm gemfibrozil under serum-free conditions and at different minutes, and the level of KLF4 protein was monitored in nuclear extracts (C) and whole cell extract by Western blot (D). Histone 3 and β-actin were used as a loading control for nuclear extract and whole cell extract, respectively. Graphs represent densitometric analysis of the nuclear and total KLF4 normalized to their respective controls. E, mouse primary astrocytes were treated with 50 μm gemfibrozil, and at different time points the level of KLF4 was monitored by double label immunofluorescence for GFAP and KLF4. Arrows indicate the presence of KLF4 inside the nucleus. Results are mean ± S.D. of three independent experiments.a, p < 0.001 versus control; Scale bar, 20 μm. UN, untreated.
FIGURE 6.
FIGURE 6.
Gemfibrozil induces the phosphorylation and activation of KLF4 in glial cells. A, BV-2 microglial cells were treated with 50 μm gemfibrozil (Gem) under serum-free conditions, and at different minutes, total cellular extracts were immunoprecipitated (IP) by antibodies against phospho-Ser (P-Ser) followed by Western blot (WB) of immunoprecipitates with antibodies against KLF4. Normal IgG was used as control. Graph represents densitometric analysis of the bands normalized to untreated (UN) sample. B, BV-2 microglial glial cells preincubated with different concentrations of LY294002 (LY) and AKT-I for 1 h were treated with 50 μm gemfibrozil for 60 min under serum-free conditions followed by monitoring the serine phosphorylation via immunoprecipitation. Graph represents densitometric analysis of the bands normalized to the untreated sample. C, BV-2 cells were treated with 50 μm gemfibrozil for different time points, and total cell extracts were immunoprecipitated separately using antibody against AKT and KLF4, followed by Western blot for AKT and KLF4. Appropriate IgG antibodies were used as control. Results are mean ± S.D. of three independent experiments. a, p < 0.001 versus control; b, p < 0.001 versus gemfibrozil.
FIGURE 7.
FIGURE 7.
Gemfibrozil induces the activation of KLF4 in glial cells via PI3K-AKT pathway. BV-2 microglial glial cells preincubated with different concentrations of LY294002 (LY) and AKT-I for 1 h were treated with 50 μm gemfibrozil (Gem) for 60 min under serum-free conditions followed by monitoring the nuclear translocation of KLF4 (A) and the levels of total KLF4 as described above (B). C, BV-2 cells were treated with different concentrations of gemfibrozil under serum-free conditions for 60 min followed by monitoring the DNA binding activity of KLF4 by EMSA. D, at different minutes of gemfibrozil treatment, the DNA binding activity of KLF4 was monitored by EMSA. Graphs represent densitometric analysis of the bands compared with untreated (UN) sample. Results are mean ± S.D. of three independent experiments. a, p < 0.001 versus control. E, BV-2 cells preincubated with different concentrations of LY for 1 h were treated with 50 μm gemfibrozil for 60 min followed by monitoring the DNA binding activity of KLF4 by EMSA. F, graph represents densitometric analysis of the bands compared with untreated sample. Results are means ± S.D. of three independent experiments. a, p < 0.001 versus control; b, p < 0.01 versus gemfibrozil.
FIGURE 8.
FIGURE 8.
siRNA knockdown of KLF4 abrogates gemfibrozil-induced up-regulation of SOCS3 in glial cells. Mouse BV-2 microglial cells (A and B) and primary astrocytes (C and D) were transfected with either control (Ctrl) or KLF4 siRNA. Forty eight hours after transfection, cells were treated with 50 μm gemfibrozil (Gem) for 60 min under serum-free conditions followed by monitoring the mRNA expression of Socs3 by semi-quantitative RT-PCR (A and C) and quantitative real time PCR (B and D). Results are mean ± S.D. of at least three independent experiments. a, p < 0.001 versus untreated; b, p < 0.001 versus control siRNA treatment; c, p < 0.001 versus control siRNA + gemfibrozil treatment.
FIGURE 9.
FIGURE 9.
Gemfibrozil induces the recruitment of KLF4 to the distal KLF4-binding site on the Socs3 promoter. A, DNA sequence of the Socs3 promoter region containing the KLF4-binding sites with positions of the primers used for the ChIP analysis. Mouse BV-2 microglial cells pretreated with different concentrations of LY294002 (LY) and AKT-I for 1 h were stimulated with 50 μm gemfibrozil for 30 min under serum-free conditions. The recruitment of KLF4 to proximal (B) and distal (C) KLF4-binding sites of the Socs3 promoter was monitored by ChIP analysis as described under “Materials and Methods.” Normal IgG was used as control.
FIGURE 10.
FIGURE 10.
Graphical representation of pathways by which gemfibrozil up-regulates the level of SOCS3 in glial cells.

Similar articles

Cited by

References

    1. Tansey M. G., McCoy M. K., Frank-Cannon T. C. (2007) Neuroinflammatory mechanisms in Parkinson disease. Potential environmental triggers, pathways, and targets for early therapeutic intervention. Exp. Neurol. 208, 1–25 - PMC - PubMed
    1. Frank-Cannon T. C., Alto L. T., McAlpine F. E., Tansey M. G. (2009) Does neuroinflammation fan the flame in neurodegenerative diseases? Mol. Neurodegener 4, 47. - PMC - PubMed
    1. Martin J. B. (1999) Molecular basis of the neurodegenerative disorders. N. Engl. J. Med. 340, 1970–1980 - PubMed
    1. Cummings J. L., Vinters H. V., Cole G. M., Khachaturian Z. S. (1998) Alzheimer disease. Etiologies, pathophysiology, cognitive reserve, and treatment opportunities. Neurology 51, S2–S17 - PubMed
    1. Jana A., Pahan K. (2010) Fibrillar amyloid-β-activated human astroglia kill primary human neurons via neutral sphingomyelinase. Implications for Alzheimer disease. J. Neurosci. 30, 12676–12689 - PMC - PubMed

Publication types

MeSH terms