. 2012 Jul 20;287(30):25038-48.
doi: 10.1074/jbc.M112.374041. Epub 2012 Jun 8.

Lipolytic products activate peroxisome proliferator-activated receptor (PPAR) α and δ in brown adipocytes to match fatty acid oxidation with supply

Affiliations

Lipolytic products activate peroxisome proliferator-activated receptor (PPAR) α and δ in brown adipocytes to match fatty acid oxidation with supply

Emilio P Mottillo et al. J Biol Chem. .

Abstract

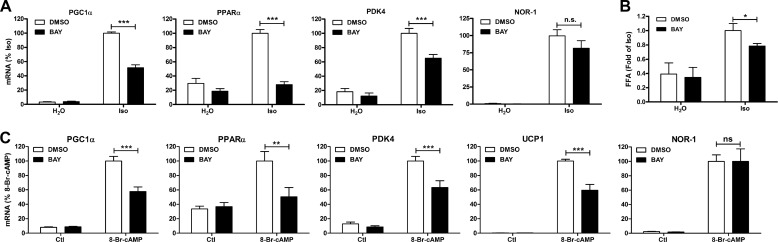
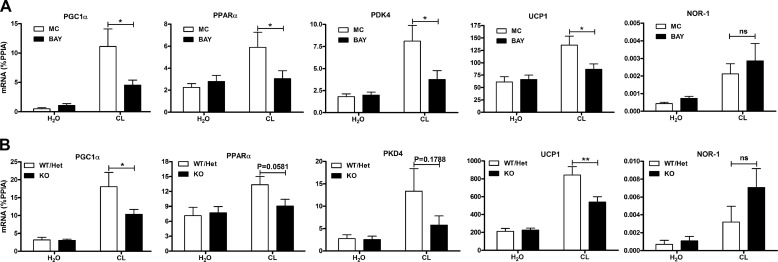
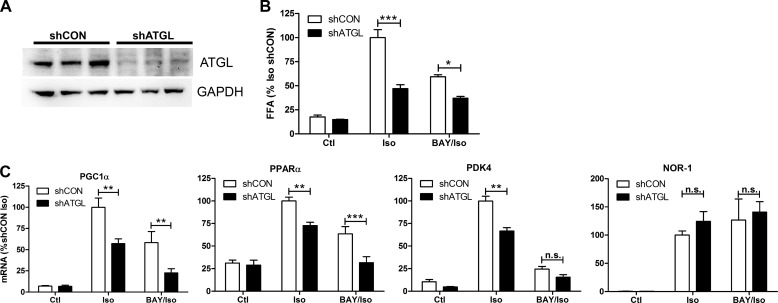
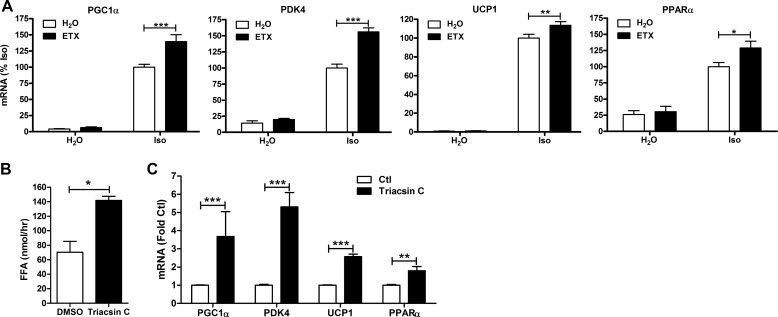
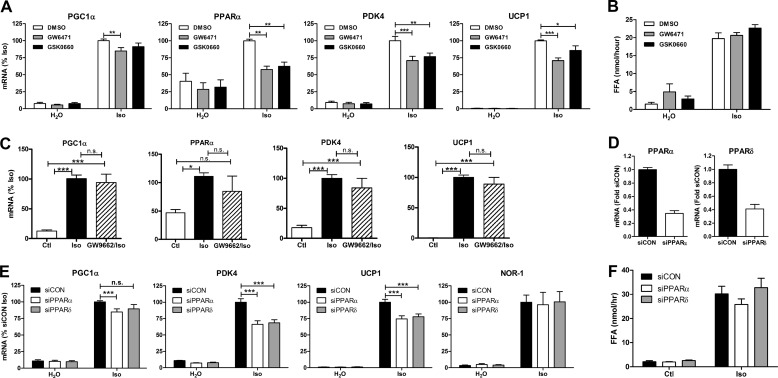
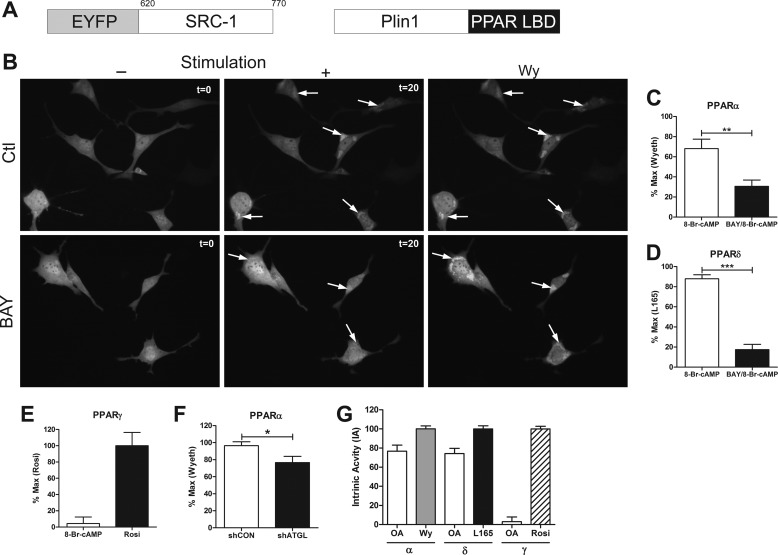
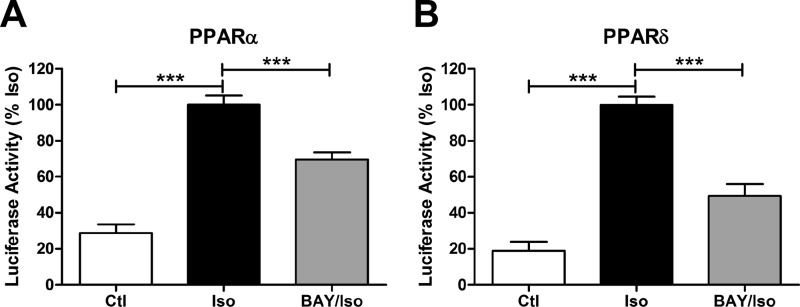
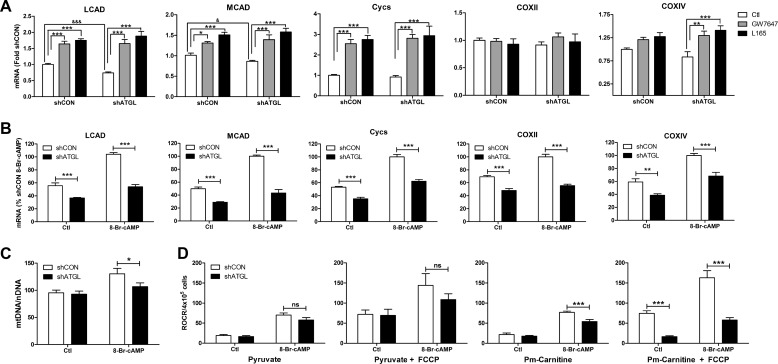
β-Adrenergic receptors (β-ARs) promote brown adipose tissue (BAT) thermogenesis by mobilizing fatty acids and inducing the expression of oxidative genes. β-AR activation increases the expression of oxidative genes by elevating cAMP, but whether lipolytic products can modulate gene expression is not known. This study examined the role that adipose triglyceride lipase (ATGL) and hormone-sensitive lipase (HSL) plays in the induction of gene expression. Activation of brown adipocytes by β-AR agonism or 8-bromo-cyclic AMP increased the expression of PGC1α, PDK4, PPARα, uncoupling protein 1 (UCP1), and neuron-derived orphan receptor-1 (NOR-1), and concurrent inhibition of HSL reduced the induction of PGC1α, PDK4, PPARα, and UCP1 but not NOR-1. Similar results were observed in the BAT of mice following pharmacological or genetic inhibition of HSL and in brown adipocytes with stable knockdown of ATGL. Conversely, treatments that increase endogenous fatty acids elevated the expression of oxidative genes. Pharmacological antagonism and siRNA knockdown indicate that PPARα and PPARδ modulate the induction of oxidative genes by β-AR agonism. Using a live cell fluorescent reporter assay of PPAR activation, we demonstrated that ligands for PPARα and -δ, but not PPARγ, were rapidly generated at the lipid droplet surface and could transcriptionally activate PPARα and -δ. Knockdown of ATGL reduced cAMP-mediated induction of genes involved in fatty acid oxidation and oxidative phosphorylation. Consequently, ATGL knockdown reduced maximal oxidation of fatty acids, but not pyruvate, in response to cAMP stimulation. Overall, the results indicate that lipolytic products can activate PPARα and PPARδ in brown adipocytes, thereby expanding the oxidative capacity to match enhanced fatty acid supply.


Figures

FIGURE 1.
FIGURE 1.
HSL is required for β-AR-mediated induction of oxidative genes in brown adipocytes. A, brown adipocytes were treated with BAY (5 μm) or vehicle (DMSO) followed by vehicle (H2O) or isoproterenol (Iso; 10 μm) for 4 h. mRNA levels were measured by QPCR, normalized to percent peptidylprolyl isomerase A (PPIA), and expressed as percent isoproterenol. B, medium free fatty acids (FFA) were measured after 4 h and expressed as -fold isoproterenol. C, brown adipocytes were treated as described in A, except cells were stimulated with 8-Br-cAMP (1 mm). Data are from 3–4 independent experiments performed in duplicate and analyzed by two-way ANOVA to determine the effect of BAY (***, p < 0.001; **, p < 0.01; *, p < 0.05; n.s., non-significant).
FIGURE 2.
FIGURE 2.
HSL is required for β3-AR-mediated induction of thermogenic genes in BAT. A, mice (n = 11) were pretreated with BAY (30 mg/kg) or methylcellulose (MC) for 1 h followed by CL (10 nmol) or vehicle (H2O) for 3 h, and BAT was analyzed for mRNA expression by QPCR and normalized to percent PPIA. B, mice (n = 13) (WT, Het, or deficient for HSL (KO)) were treated with CL (10 nmol) for 6 h, and BAT was analyzed for mRNA as described in A. The effect of BAY (two-way ANOVA) or the difference between WT/Het and HSL-KO mice (two-way ANOVA) is indicated (**, p < 0.01; *, p < 0.05; ns, non-significant).
FIGURE 3.
FIGURE 3.
Knockdown of ATGL reduces the induction of oxidative genes by β-AR activation in brown adipocytes. A, Western blot was performed on shCON and shATGL brown adipocytes for ATGL and GAPDH. B, medium free fatty acids (FFA) were measured after 4 h and expressed as -fold isoproterenol (Iso). Ctl, control. C, shCON and shATGL brown adipocytes were treated with isoproterenol (10 μm) or BAY and isoproterenol (BAY/Iso), for 4 h, and mRNA levels were measured by QPCR, normalized to percent PPIA, and expressed as a percentage of shCON isoproterenol. Data are from three separate experiments performed in duplicate, and the difference between shCON and shATGL cells by two-way ANOVA is indicated (***, p < 0.001; **, p < 0.01; *, p < 0.05; n.s., non-significant).
FIGURE 4.
FIGURE 4.
Endogenous fatty acids increase the transcription of genes involved in thermogenesis in brown adipocytes. A, brown adipocytes were treated with etomoxir (ETX; 50 μm) or vehicle (H2O) followed by isoproterenol (Iso; 10 μm) for 4 h. mRNA levels were measured by QPCR, normalized to percent PPIA, and expressed as percent Iso. B, brown adipocytes were treated with triacsin C or vehicle (DMSO), and medium free fatty acids (FFA) were measured after 4 h and expressed as nmol/h. C, brown adipocytes were treated as described in B, and mRNA levels were quantified by QPCR and expressed as -fold of control (Ctl). Data are from 3–4 separate experiments performed in duplicate, and the effect of etomoxir or triacsin C is shown (***, p < 0.001; **, p < 0.01; *, p < 0.05).
FIGURE 5.
FIGURE 5.
PPARα and PPARδ mediate the maximal induction of thermogenic genes by β-AR activation in brown adipocytes. A, brown adipocytes were treated with antagonists against PPARα (GW6741; 10 μm) or PPARδ (GSK0660; 2 μm) followed by isoproterenol (Iso; 10 μm) for 4 h. mRNA levels were measured by QPCR, normalized to percent PPIA, and expressed as a percent of isoproterenol. Data are from four separate experiments performed in duplicate, and the effect of GW6471 or GSK0660 by two-way ANOVA is shown (***, p < 0.001; **, p < 0.01; *, p < 0.05). B, free fatty acid (FFA) levels from A were measured in the medium and expressed as nmol/h. C, brown adipocytes were treated with PPARγ antagonist (GW9662, 30 μm) followed by isoproterenol for 4 h. The differences between groups were evaluated by one-way ANOVA. D, mRNA levels of PPARα and -δ in brown adipocytes treated with control (siCON), PPARα (siPPARα), or PPARδ (siPPARδ) siRNA normalized to percent PPIA and expressed as -fold siCON. E, siCON-, siPPARα-, or siPPARδ-treated brown adipocytes were stimulated with isoproterenol for 4 h, and mRNA was quantified as described in A and expressed as a percent of siCON isoproterenol. Data are from three separate experiments performed in triplicate, and the effect of siPPARα or siPPARδ by two-way ANOVA is shown (***, p < 0.001; n.s., non-significant). F, free fatty acid levels in the medium from E were measured and expressed as nmol/h.
FIGURE 6.
FIGURE 6.
Ligands for PPARα and -δ, but not PPARγ, are created at the lipid droplet surface in response to lipolysis. A, schematic representation of constructs used for the fluorescent reporter assays (amino acids for SRC1 are shown). Plin1, Perilipin-1; LBD, ligand-binding domain. B, brown adipocytes transfected with a PPARα fluorescent reporter were pretreated with DMSO (Ctl) or BAY (5 μm) for 10 min. Representative images shown prior to stimulation with 1 mm 8-Br-cAMP (−; t = 0) or after 20 min of stimulation (+; t = 20) and after the addition of PPARα ligand, Wy (100 μm). C, the PPARα reporter was quantified by normalizing the region of interest after treatment with 8-Br-cAMP or BAY/8-Br-cAMP to the maximal effect of Wy-14,263 (Wyeth) from 2–3 coverslips/experiment (n = 3). D, the PPARδ reporter was normalized to the maximal effect of L165 (10 μm). The effect of BAY was determine by unpaired t test (***, p < 0.001; **, p < 0.01). E, the PPARγ reporter was quantified by normalizing the region of interest after 8-Br-cAMP to the maximal effect of rosiglitazone (Rosi, 10 μm). F, the PPARα reporter was quantified in shCON and shATGL brown adipocytes after treatment with 8-Br-cAMP as above, and the difference was determine by unpaired t test (*, p < 0.05). G, brown adipocytes transfected with reporters for PPARα, -δ, and -γ were treated with 400 μm oleic acid (OA), and the data were normalized to the intrinsic activity (IA) of the respective ligands, Wy, L165, and rosiglitazone.
FIGURE 7.
FIGURE 7.
Lipolysis activates PPARα and PPARδ transcription. Brown adipocytes transfected with β-galactosidase, luciferase reporter, and hPPARα-Gal4 (A) or hPPARδ-Gal4 (B) fusions were treated with vehicle (Ctl) or BAY (5 μm) and stimulated with isoproterenol (Iso; 10 μm) for 8 h. Luciferase reporter activity was normalized to β-gal activity and expressed as a percent of isoproterenol, and statistical analysis was performed by one-way ANOVA to determine the effect of BAY or isoproterenol (***, p < 0.001).
FIGURE 8.
FIGURE 8.
ATGL is required for the maximal increase in mitochondrial gene expression and fatty acid oxidation in response to cAMP stimulation in brown adipocytes. A, brown adipocytes expressing a control (shCON) or ATGL (shATGL) shRNA were treated with agonists against PPARα (GW7647; 1 μm) and δ (L165; 5 μm) for 24 h. mRNA levels were measured by QPCR, normalized to percent PPIA, and expressed as -fold shCON. Measurements are from an average of three independent experiments performed in duplicate. Statistical analysis was performed by two-way ANOVA to determine the effect of GW7647 or L165 in comparison with control (***, p < 0.001; **, p < 0.01) or by post hoc t test to determine the effect of ATGL knockdown (***, p < 0.001; *, p < 0.05). Cycs, cytochrome c. B, the indicated cells were treated with H2O (Ctl) or 8-Br-cAMP for 24 h, and mRNA levels were quantified by QPCR, normalized to percent PPIA, and expressed as a percent shCON 8-Br-cAMP. Measurements are from an average of four independent experiments performed in triplicate. Statistical analysis was performed by two-way ANOVA to determine the effect of ATGL knockdown (shATGL) (***, p < 0.001; **, p < 0.01). C, mtDNA normalized to nDNA in shCON and shATGL brown adipocytes in control state (Ctl) or treated with 8-Br-cAMP for 48 h (*, p < 0.05). D, relative mitochondrial oxygen consumption rate (ROCR) in permeabilized shCON and shATGL brown adipocytes using pyruvate or palmitoylcarnitine (Pm-Carnitine) as substrate. ADP-driven (Pyruvate and Pm-Carnitine) and fully stimulated (Pyruvate + FCCP and Pm-Carnitine + FCCP) respiration is shown. Measurements are from an average of three independent experiments performed in duplicate. Statistical analysis was performed by two-way ANOVA to determine the effect of ATGL knockdown (shATGL) (***, p < 0.001; ns, non-significant).

References

    1. Puigserver P., Wu Z., Park C. W., Graves R., Wright M., Spiegelman B. M. (1998) A cold-inducible coactivator of nuclear receptors linked to adaptive thermogenesis. Cell 92, 829–839 - PubMed
    1. Spiegelman B. M. (2007) Transcriptional control of mitochondrial energy metabolism through the PGC1 coactivators. Novartis Found. Symp. 287, 60–63; discussion 63–69 - PubMed
    1. Chang J. S., Fernand V., Zhang Y., Shin J., Jun H. J., Joshi Y., Gettys T. W. (2012) NT-PGC-1α protein is sufficient to link β3-adrenergic receptor activation to transcriptional and physiological components of adaptive thermogenesis. J. Biol. Chem. 287, 9100–9111 - PMC - PubMed
    1. Reusch J. E., Colton L. A., Klemm D. J. (2000) CREB activation induces adipogenesis in 3T3-L1 cells. Mol. Cell. Biol. 20, 1008–1020 - PMC - PubMed
    1. Rim J. S., Kozak L. P. (2002) Regulatory motifs for CREB-binding protein and Nfe2l2 transcription factors in the upstream enhancer of the mitochondrial uncoupling protein 1 gene. J. Biol. Chem. 277, 34589–34600 - PubMed

Publication types

MeSH terms