. 2012 Sep 1;125(Pt 17):4067-76.
doi: 10.1242/jcs.104943. Epub 2012 Jun 8.

Perilipin family members preferentially sequester to either triacylglycerol-specific or cholesteryl-ester-specific intracellular lipid storage droplets

Affiliations

Perilipin family members preferentially sequester to either triacylglycerol-specific or cholesteryl-ester-specific intracellular lipid storage droplets

Kai Hsieh et al. J Cell Sci. .

Abstract

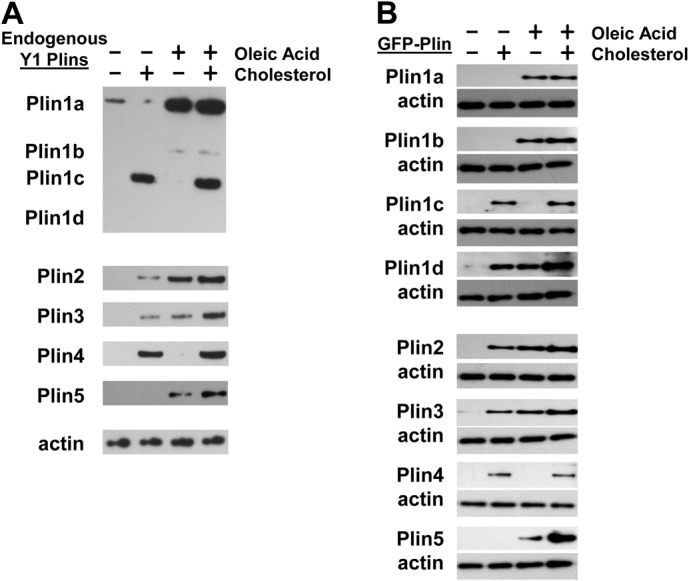
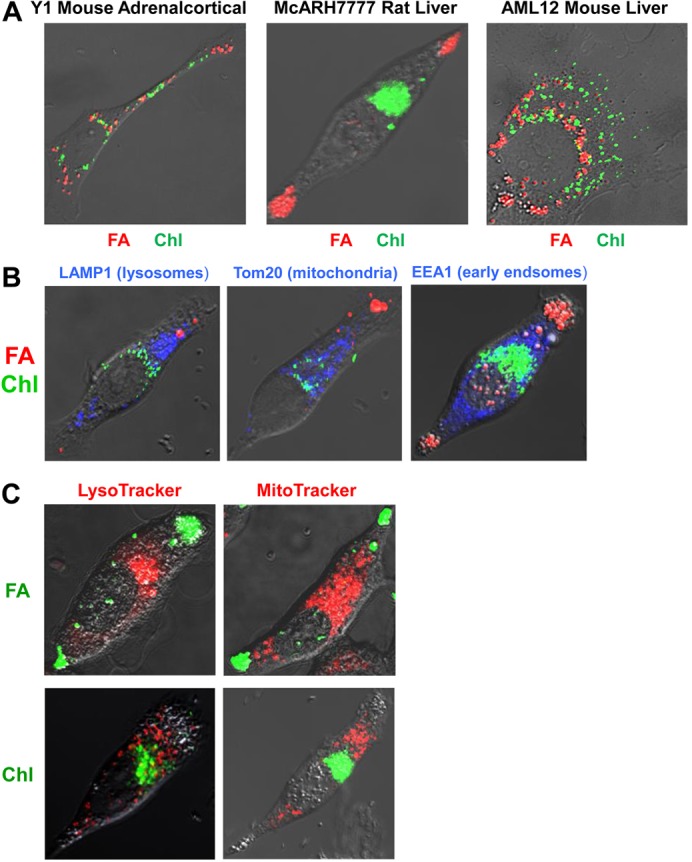
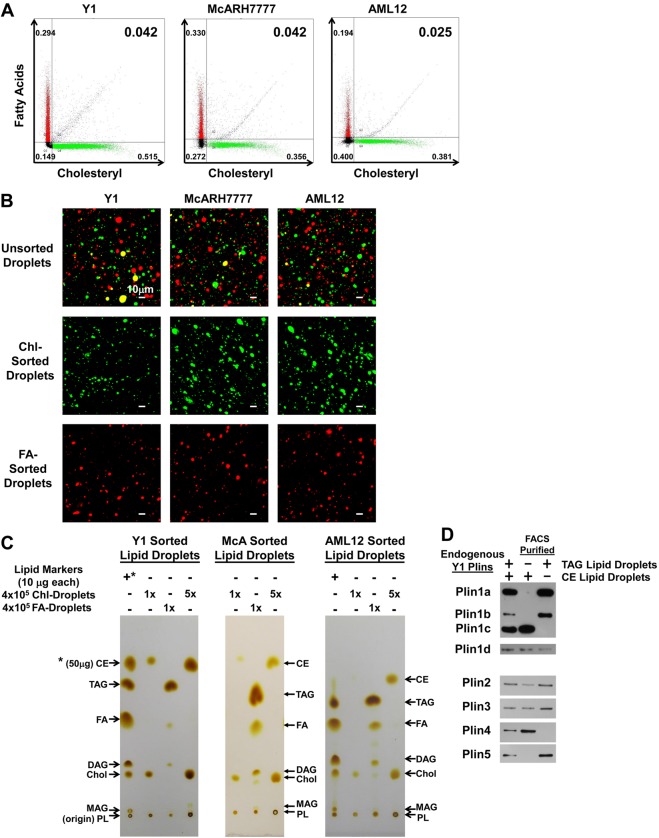
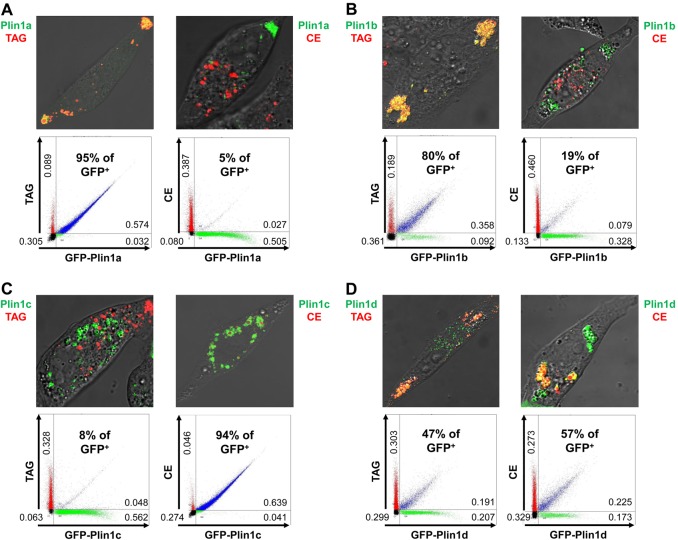
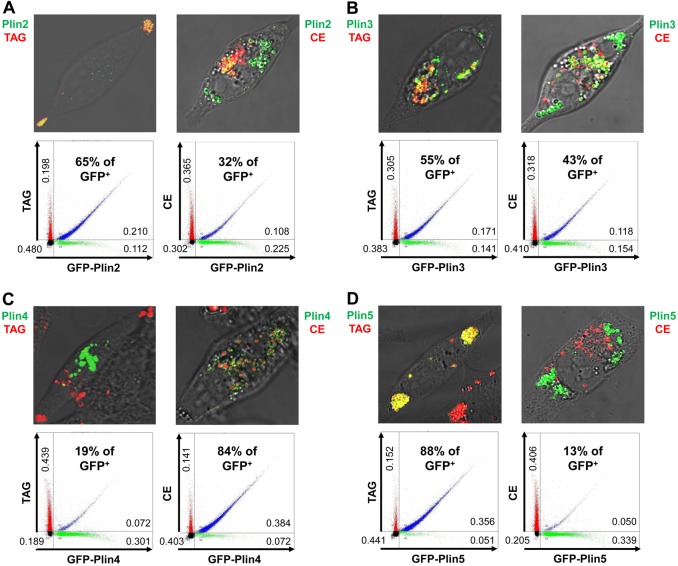
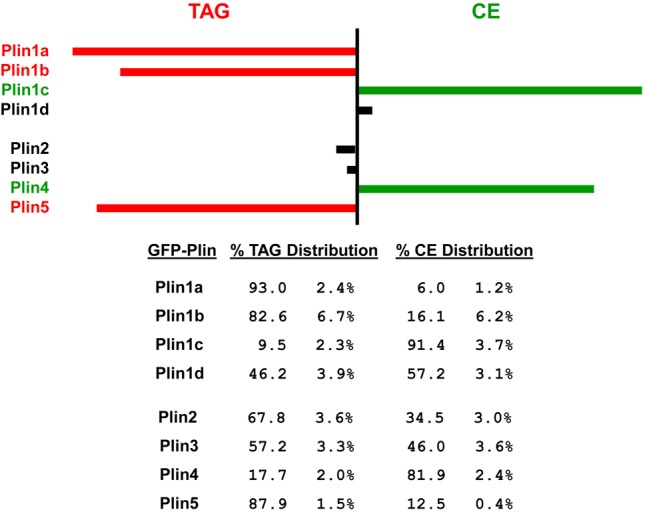
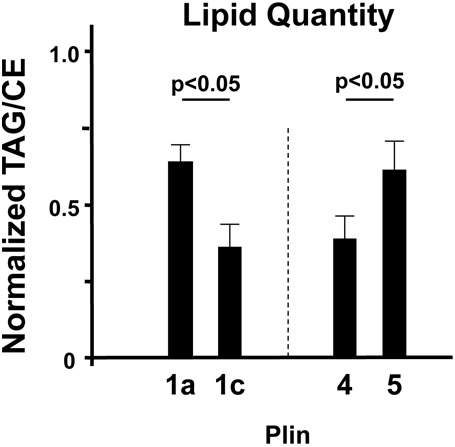
Perilipin family proteins (Plins) coat the surface of intracellular neutral lipid storage droplets in various cell types. Studies across diverse species demonstrate that Plins regulate lipid storage metabolism through recruitment of lipases and other regulatory proteins to lipid droplet surfaces. Mammalian genomes have distinct Plin gene members and additional protein forms derived from specific mRNA splice variants. However, it is not known if the different Plins have distinct functional properties. Using biochemical, cellular imaging and flow cytometric analyses, we now show that within individual cells of various types, the different Plin proteins preferentially sequester to separate pools of lipid storage droplets. By examining ectopically expressed GFP fusions and all endogenous Plin protein forms, we demonstrate that different Plins sequester to different types of lipid droplets that are composed of either triacylcerides or cholesterol esters. Furthermore, Plins with strong association preferences to triacylceride (or cholesterol ester) droplets can re-direct the relative intracellular triacylceride-cholesterol ester balance toward the targeted lipid. Our data suggest diversity of Plin function, alter previous assumptions about shared collective actions of the Plins, and indicate that each Plin can have separate and unique functions.


Figures

Fig. 1.
Fig. 1.
Differential accumulation of Plins in cells cultured in the absence or presence of fatty acid and/or cholesterol. (A) Y1 adrenal cells were cultured overnight in the absence or presence of oleic acid and/or cholesterol. Whole cell lysates were prepared and endogenous Plins assayed by immunoblotting. Data are representative of three experiments. (B) McARH7777 rat liver cells were transiently transfected with the indicated GFP–Plin-expressing constructs and cultured overnight in the absence or presence of oleic acid and/or cholesterol. Whole cell lysates were prepared and GFP–Plin assayed by immunoblotting. Data are representative of three experiments.
Fig. 2.
Fig. 2.
Spatially distinct intracellular accumulations of fatty acid and cholesteryl dye markers. (A) Y1 adrenal, McARH7777 rat liver and AML12 mouse liver cells were cultured overnight in the presence of oleic acid and cholesterol, plus fatty acid BODIPY 558/568 C12 (FA) and cholesteryl BODIPY 500/510 FL C12 (Chl). Representative confocal images are shown with red and green indicating the localization of FA and Chl, respectively. (B) McARH7777 cells were cultured overnight in the presence of oleic acid and cholesterol, plus fatty acid BODIPY 558/568 C12 and cholesteryl BODIPY 500/510 FL C12 and probed for organelle localization using immunofluorescence detection of LAMP1 (Lysosomal-associated membrane protein 1), TOM2 (Translocase of outer mitochondrial membranes 20 kDa) and EEA1 (Early endosome antigen 1). (C) McARH7777 cells were cultured overnight in the presence of oleic acid and cholesterol, plus fatty acid BODIPY 500/510 C12 or cholesteryl BODIPY 500/510 FL C12 and probed for organelle localization by staining with organelle-specific markers.
Fig. 3.
Fig. 3.
Differential localization of Plins to TAG or CE droplets. Y1 adrenal, McARH7777 rat liver and AML12 mouse liver cells were cultured overnight in the presence of oleic acid and cholesterol, plus fatty acid BODIPY 558/568 C12 (FA) and cholesteryl BODIPY 500/510 FL C12 (Chl). (A) Representative FACS profiles of purified FA- and Chl-tagged lipid droplets are shown, with relative distributions of total lipid droplet numbers indicated in the different quadrants (FA/Chl, FA+/Chl, FA/Chl+ and FA+/Chl+); blue represents dual signals of the FA and Chl probes. Y1 cells: 25,000 total droplets; McARH7777 cells: 20,000 total droplets; AML12 cells: 25,000 total droplets. (B) Confocal images of unsorted and FACS sorted FA- and Chl-tagged lipid droplets from Y1, McARH7777 and AML12 cells. (C) Lipids isolated from sorted FA- and Chl-droplets were separated by TLC in parallel with lipid markers and detected by staining with iodine vapor. 1× indicates 2×10⁵ LSD particles; 5× indicates 1×10⁶ LSD particles. Marker lanes have 50 µg CE (*) and 10 µg each of TAG, FA, diacylglycerides (DAG), cholesterol (Chol), MAG and phospholipid (PL). PLs do not migrate from the origin in this system. (D) Proteins were prepared from unsorted and FACS-sorted TAG- or CE-LSD isolated from Y1 cells. Endogenous Plin proteins were assayed by immunoblotting. Identical numbers of lipid droplet particles were loaded in each lane. Data are representative of three experiments.
Fig. 4.
Fig. 4.
Differential localization of Plin1 proteins to TAG or CE lipid droplets. McARH7777 cells were transiently transfected with the indicated GFP–Plin1-expressing constructs and cultured overnight in the presence of oleic acid and cholesterol, plus either BODIPY 558/568 C12 (TAG) or cholesteryl BODIPY 576/589 C11 (CE). Representative confocal images are shown for each with red indicating the localization of either TAG or CE droplets, green indicating localization of GFP–Plin1 proteins, and yellow (or rings) indicating colocalization. Representative FACS profiles of TAG- and GFP-labeled lipid droplets or of CE- and GFP-labeled lipid droplets are shown, with relative distributions of total particle numbers indicated in the different quadrants, and the relative Plin1 variant localizations indicated as a percentage of the total GFP+ signal that co-sorts (blue) with either TAG+ or CE+ tags. Each experiment was performed at least three times (see Fig. 6). (A) Plin1a (25,000 total droplets for each population); (B) Plin1b (20,000 total droplets for each population); (C) Plin1c (25,000 total droplets for each population); (D) Plin1d (10,000 total droplets for each population).
Fig. 5.
Fig. 5.
Differential localization of Plin2, -3, -4 and -5 proteins to TAG or CE lipid droplets. McARH7777 cells were transiently transfected with the indicated GFP–Plin-expressing constructs and cultured overnight in the presence of oleic acid and cholesterol, plus either BODIPY 558/568 C12 (TAG) or cholesteryl BODIPY 576/589 C11 (CE). Representative confocal images are shown for each, with red indicating the localization of either TAG or CE droplets, green indicating localization of GFP–Plin proteins, and yellow (or rings) indicating colocalization. Representative FACS profiles of TAG- and GFP-labeled lipid droplets or of CE- and GFP-labeled lipid droplets are shown, with relative distributions of total particle numbers indicated in the different quadrants, and the relative Plin2–5 variant localizations indicated as a percentage of total GFP+ signal that co-sorts (blue) with either TAG+ or CE+ tags. Each experiment was performed at least three times (see Fig. 6). (A) Plin2 (15,000 total droplets for each population); (B) Plin3 (20,000 total droplets for each population); (C) Plin4 (25,000 total droplets for each population); (D) Plin5 (10,000 total droplets for each population).
Fig. 6.
Fig. 6.
Relative distributions of Plin family proteins to TAG- or CE-specific intracellular lipid storage droplets. McARH7777 cells were transiently transfected with the indicated GFP–Plin-expressing constructs and cultured overnight in the presence of oleic acid and cholesterol, plus either BODIPY 558/568 C12 (FA) or cholesteryl BODIPY 576/589 C11 (Chl) dye markers. TAG or CE distributions are the percentage of the total GFP+ signal that co-sorts, respectively, with either FA+ or Chl+ tags (see Figs 4, 5). Data are from at least three independent, paired experiments, where the TAG+CE sum for each pair was 98–102%. Values are the means ± standard deviation. Plin1a, Plin1b and Plin5 show strong preference for localization to TAG-LSDs, with Plin1a consistently exhibiting a stronger TAG signal than Plin1b or Plin5. Plin1c and Plin4 show strong preference for localization to CE-LSDs, with Plin1c consistently exhibiting a stronger CE signal than did Plin4. Plin1d, Plin2 and Plin3 exhibit less specific localization. Values are ± standard deviation.
Fig. 7.
Fig. 7.
Relative change in TAG- or CE-specific intracellular lipid storage upon expression of various Plin proteins. AML12 cells were transiently transfected with the indicated GFP–Plin-expressing constructs and cultured overnight in the presence of oleic acid and cholesterol. Transfection efficiencies were confirmed by visualizing GFP fluorescence. Untransfected cells, cultured with/without exogenous oleic acid and cholesterol, were grown in parallel. LSDs were isolated by centrifugation and lipids were extracted, separated by TLC in parallel with lipid markers, and TAG and CE detected after staining with iodine vapor. Relative TAG/CE ratios were quantified in cells transfected with each specific Plin-expressing construct and analyzed in parallel with identically grown untransfected cells for normalization and TLC background correction. The TAG/CE ratio for untransfected lipid-loaded cells (controls) was set to 0.5. The relative TAG/CE-ratio of Plin1a- and Plin1c-expressing cells were always analyzed in parallel and normalized to those of control cells, and then secondarily compared to results determined for its Plin-expressing counterpart. Values >0.5 indicate a proportional increase in TAG lipid bias, whereas values <0.5 indicate a proportional increase in CE lipid bias. Relative distributions of TAG/CE levels are shown as the means ± standard deviation for each paired comparison. Data for each pair are based on three independent experiments. Plin4- and Plin5-expressing cells were similarly analyzed as pairs and internally compared as described for the Plin1a/Plin1c pair. Plin1a and Plin5 show a relative bias for cellular TAG accumulation and a strong preference for binding specificity to TAG-LSDs (see Fig. 6). Conversely, Plin1c and Plin4 show a relative increase in cellular CE levels and a strong preference for binding to CE-LSDs.

References

    1. Brasaemle D. L., Dolios G., Shapiro L., Wang R. (2004). Proteomic analysis of proteins associated with lipid droplets of basal and lipolytically stimulated 3T3-L1 adipocytes. J. Biol. Chem. 279, 46835–46842 10.1074/jbc.M409340200 - DOI - PubMed
    1. Bussell R., Jr and Eliezer D. (2003). A structural and functional role for 11-mer repeats in alpha-synuclein and other exchangeable lipid binding proteins. J. Mol. Biol. 329, 763–778 10.1016/S0022-2836(03)00520-5 - DOI - PubMed
    1. Chang B. H., Li L., Paul A., Taniguchi S., Nannegari V., Heird W. C., Chan L. (2006). Protection against fatty liver but normal adipogenesis in mice lacking adipose differentiation-related protein. Mol. Cell. Biol. 26, 1063–1076 10.1128/MCB.26.3.1063-1076.2006 - DOI - PMC - PubMed
    1. Christian A. E., Haynes M. P., Phillips M. C., Rothblat G. H. (1997). Use of cyclodextrins for manipulating cellular cholesterol content. J. Lipid Res. 38, 2264–2272 - PubMed
    1. Dalen K. T., Ulven S. M., Arntsen B. M., Solaas K., Nebb H. I. (2006). PPARalpha activators and fasting induce the expression of adipose differentiation-related protein in liver. J. Lipid Res. 47, 931–943 10.1194/jlr.M500459-JLR200 - DOI - PubMed

Publication types