. 2012;8(6):e1002762.
doi: 10.1371/journal.ppat.1002762. Epub 2012 Jun 7.

Mobilization of HIV spread by diaphanous 2 dependent filopodia in infected dendritic cells

Affiliations

Mobilization of HIV spread by diaphanous 2 dependent filopodia in infected dendritic cells

Anupriya Aggarwal et al. PLoS Pathog. 2012.

Abstract

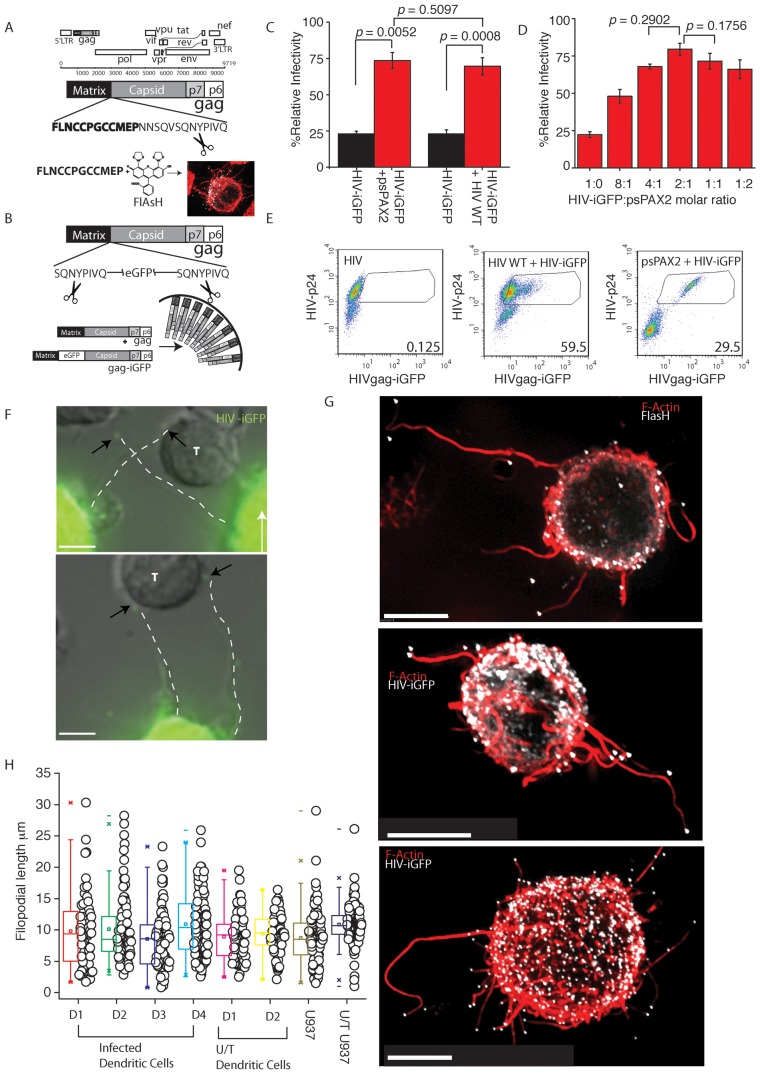
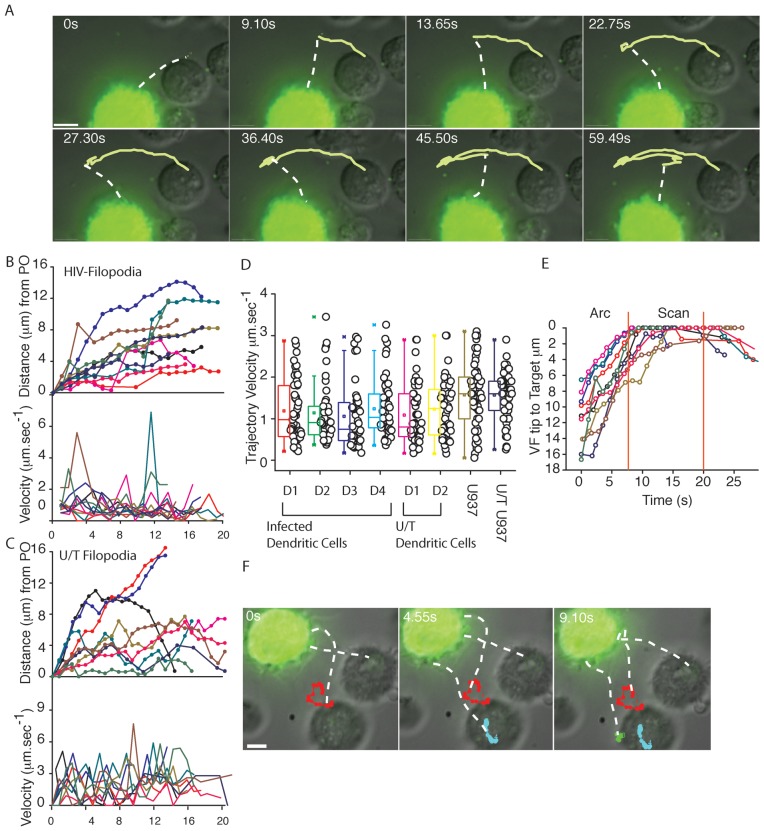
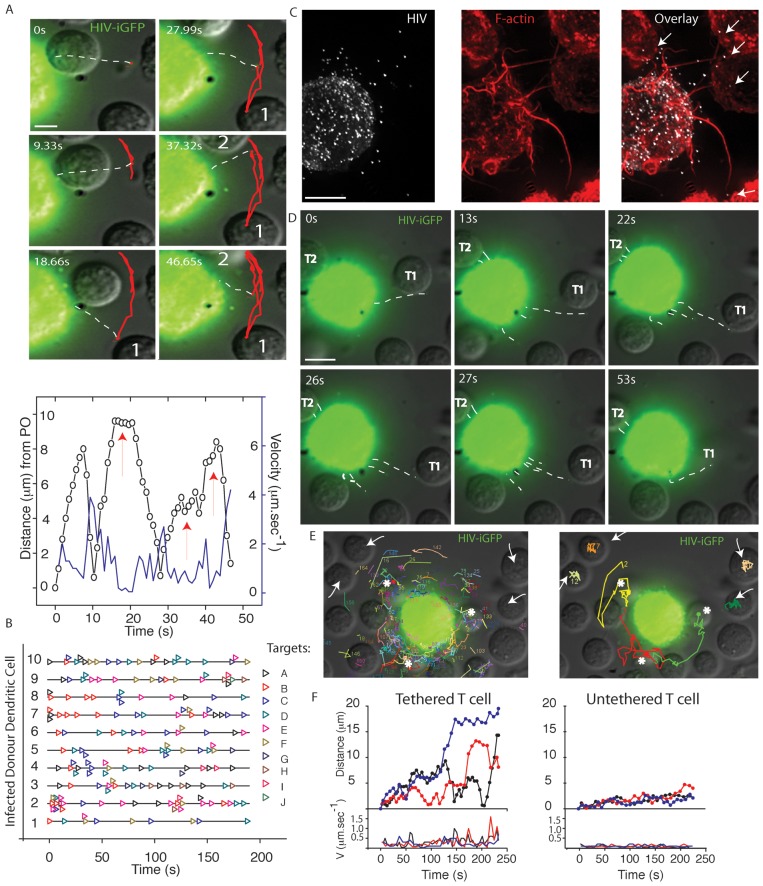
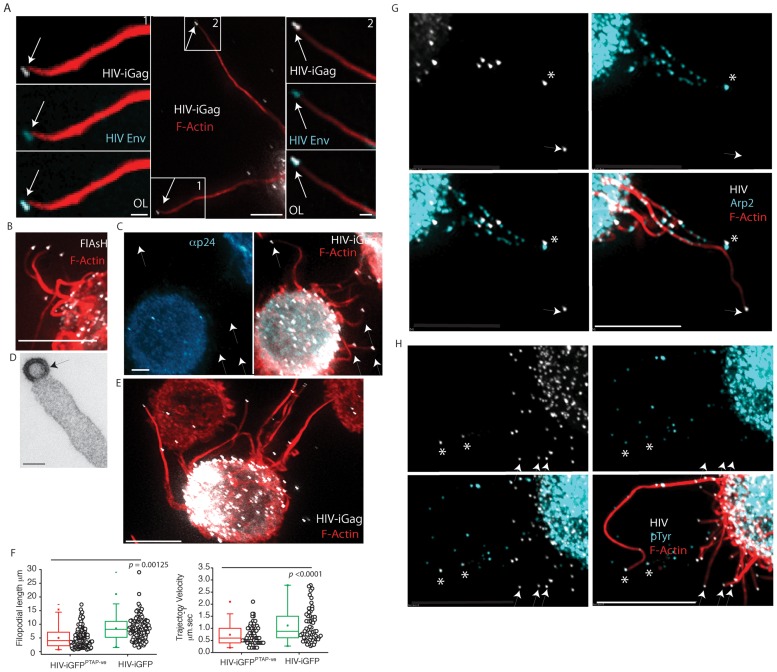
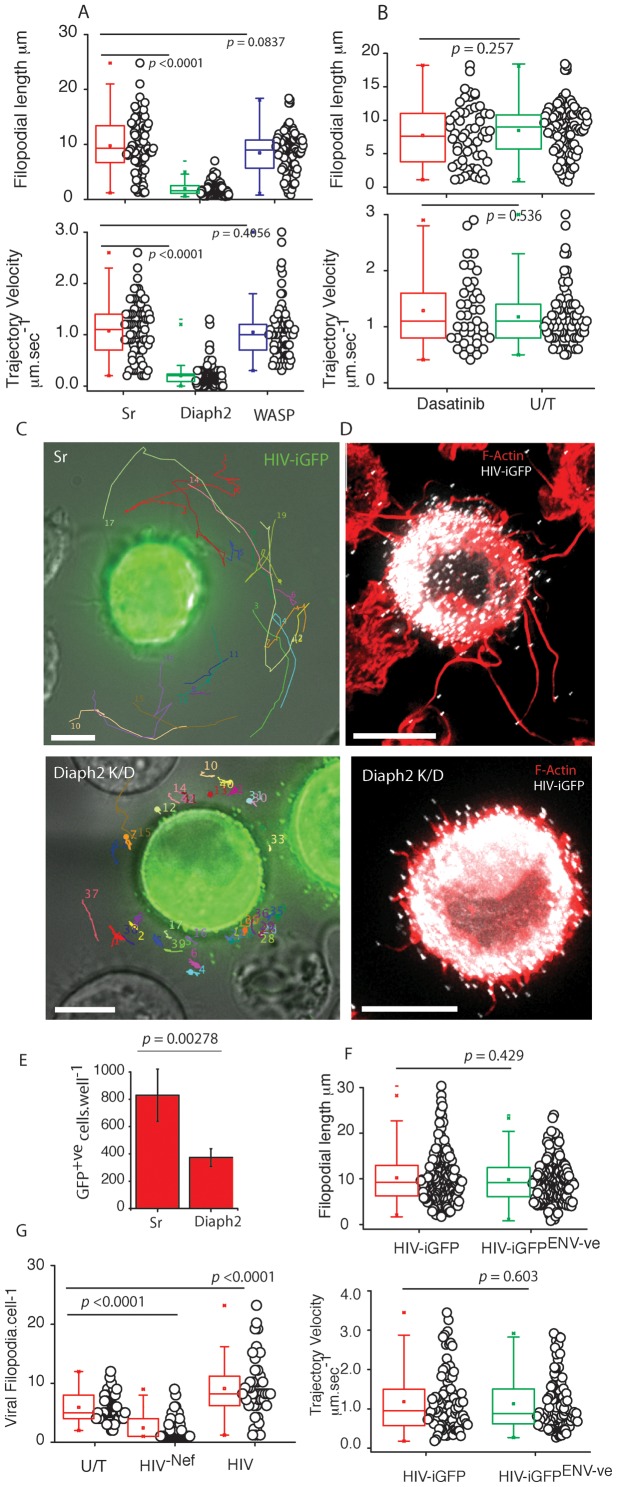
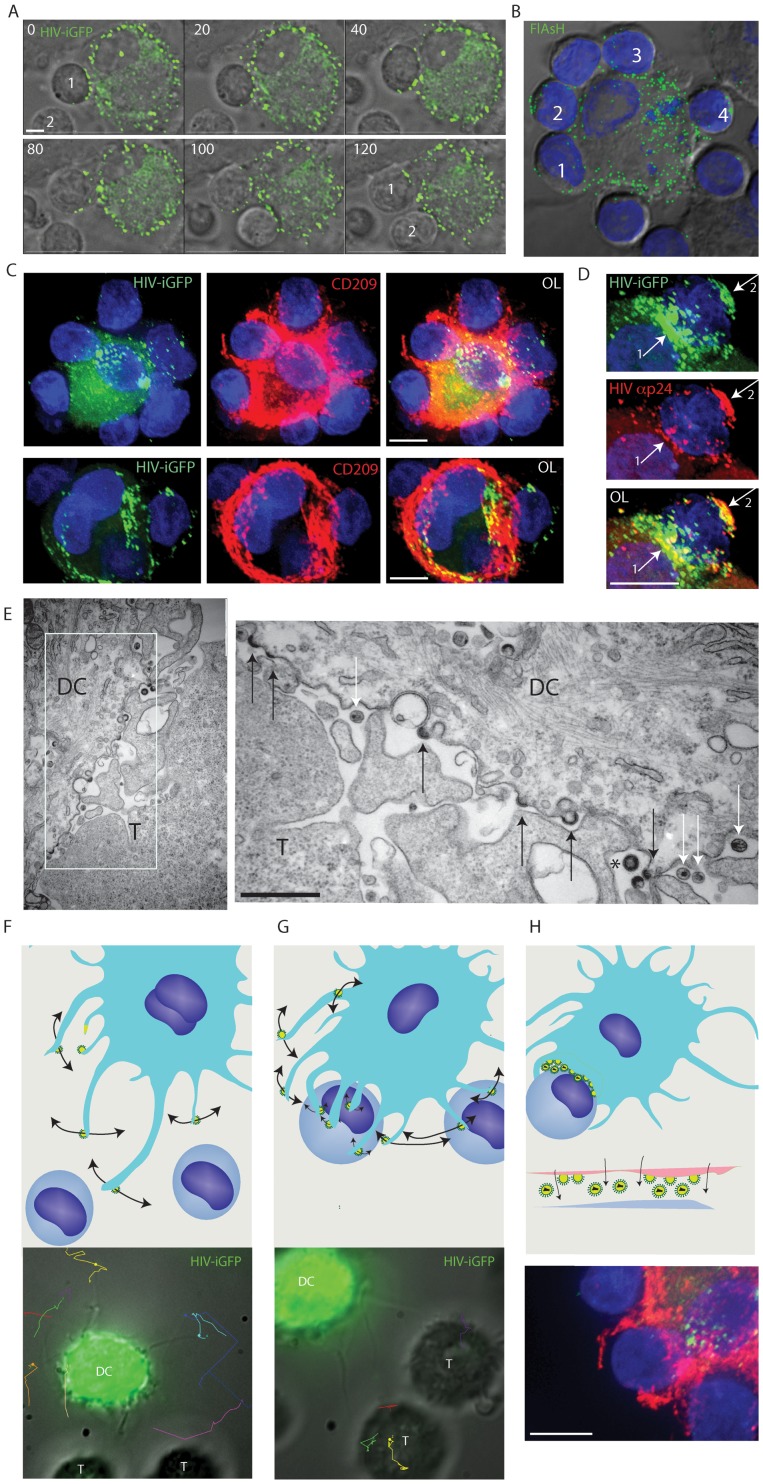
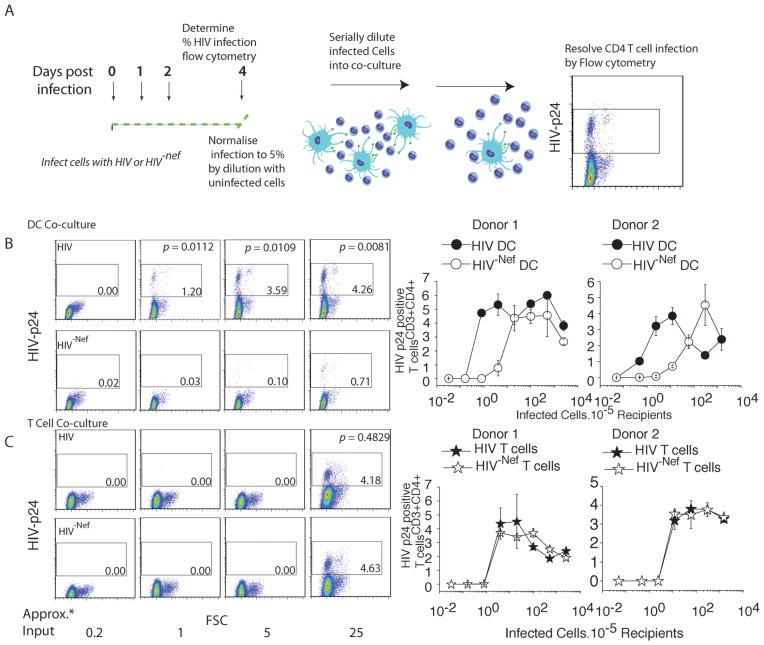
Paramount to the success of persistent viral infection is the ability of viruses to navigate hostile environments en route to future targets. In response to such obstacles, many viruses have developed the ability of establishing actin rich-membrane bridges to aid in future infections. Herein through dynamic imaging of HIV infected dendritic cells, we have observed how viral high-jacking of the actin/membrane network facilitates one of the most efficient forms of HIV spread. Within infected DC, viral egress is coupled to viral filopodia formation, with more than 90% of filopodia bearing immature HIV on their tips at extensions of 10 to 20 µm. Live imaging showed HIV filopodia routinely pivoting at their base, and projecting HIV virions at µm.sec⁻¹ along repetitive arc trajectories. HIV filopodial dynamics lead to up to 800 DC to CD4 T cell contacts per hour, with selection of T cells culminating in multiple filopodia tethering and converging to envelope the CD4 T-cell membrane with budding HIV particles. Long viral filopodial formation was dependent on the formin diaphanous 2 (Diaph2), and not a dominant Arp2/3 filopodial pathway often associated with pathogenic actin polymerization. Manipulation of HIV Nef reduced HIV transfer 25-fold by reducing viral filopodia frequency, supporting the potency of DC HIV transfer was dependent on viral filopodia abundance. Thus our observations show HIV corrupts DC to CD4 T cell interactions by physically embedding at the leading edge contacts of long DC filopodial networks.


Conflict of interest statement

The authors have declared that no competing interests exist.

Figures

Figure 1
Figure 1. Complementary live imaging approaches reveal abundant HIV tipped filopodia (VF) on infected DC.
(A) Detection strategy of HIV-T. The HIV Gag polyprotein is presented in the context of the HIV open reading frames. The biarsenical fluorescent dye FlAsH is shown and binds to a 12 amino acid motif (in bold) at the C-Terminus of Matrix. The protease cleavage site between HIV Matrix and Capsid is highlighted by black scissors. (B) Detection strategy using HIV-iGFP. HIV-iGFP constructs encode eGFP at the C-terminus of HIV matrix and are flanked by 5′ and 3′ HIV protease cleavage sites (highlighted by black scissors). For generation of cell-free virus with comparable infectivity to WT HIV Gag and Gag-Pol are expressed in trans to the HIV iGFP genome (see bottom of panel; HIV Gag only shown) to increase viral infectivity in one round. (C) & (D) Rescuing infectivity of HIV-iGFP. (C) HIV iGFP was prepared by co-transfecting WT HIV or WT Gag and Gag -POL (psPAX2) with HIV iGFP at an equimolar ratio into the 293T cell line. Three days post transfection, supernatants were harvested, diluted 1/1000 and 200 ml was added to 1×10³ TZM-bl cells (HeLa HIV indicator cell line), seeded 24 hours prior in a 96 well plate. % infectivity is relative to wild type HIV and calculated as the (co-transfections)/(HIV-WT alone)×100. Statistical differences are presented as p values. Standard deviations are derived from assays in triplicate. (D) Further titration of psPAX2∶HIV-iGFP. As in C. HIV-iGFP was co-transfected with psPAX2, but here at as a titration. Supernatants were subsequently titered using the TZM-bl cell line as in C. Standard deviations and p values also as per C. % infectivity relative to wild type HIV is calculated as in C. (E) DC were infected with an MOI of 0.1 with either WT HIV (left panel), WT HIV rescued HIV-iGFP virus (middle panel) or psPAX2 rescued HIV-iGFP (right panel) as outlined in material and methods. To determine total infection, infected DC were stained with anti-HIV-p24 antibody KC57-RD1. Gates in panels reflect eGFP signal from infected p24 high cells, with percentages from gates presented in the lower right corners. Note WT rescued HIV iGFP virus generates infected DC with diluted eGFP signal. (F) Infected DCs expressing HIV-iGFP 4 days post infection and co-cultured with autologous resting CD4 T cells at a ratio of 1 DC to 3 CD4 T cells (images are also representative for HIV-T). Filopodia are highlighted by dotted lines. Neighboring CD4 T cells that are in contact with filopodia are marked as (T) (G) HIV iGFP infected cells (HIV in white) have been fixed and stained for F-actin using phalloidin dye (red). Note all filopodia stained red, bear HIV at their terminal tips (All scale bars are 5 µm). (H) Average lengths of filopodia & VF across multiple DC donors. Infected or uninfected DCs (untreated U/T) were co-cultured with CD4 T cells as in F. Length of filopodia from the base at the plasma membrane to the tip was calculated in live infected and uninfected DC donors. VF and Filopodia lengths in infected and uninfected co-cultures from D1 & D2 are presented as a comparison. Filopodial lengths are representative of greater than n = 20 donors. VF and filopodia from infected and uninfected U937 cell line are also presented as a comparison.
Figure 2
Figure 2. VF trajectories engage in fast overlapping Arc trajectories prior to engaging and scanning CD4 T cells.
DC were infected with HIV-iGFP and subsequent live imaging proceeded with infected DCs co-culture with CD4 T cells at a ratio of 1 DC to 3 CD4 T cells as outlined in Fig. 1. (A) Untethered VF engage in sweeping Arc trajectories. To illustrate the overall movement of VF, 8 frames of the Supplementary Video S5 were superimposed. To highlight filopodia, a dashed line shadows the filopodial connection on VF as in Fig. 1. (B) 10 representative velocities of VF tips over time (lower graph) and corresponding movements from their point of origin (PO) (upper graph) (C) 10 representative velocities of filopodia from uninfected DC from the same donor. (D) Average velocities across entire VF trajectories across multiple DC donors and filopodial trajectories from untreated (U/T) controls (each point is the average VF Velocity over an entire 20 second trajectory). VF and filopodia from infected and untreated (U/T) U937 monocyte cell line is presented herein as a comparison. (E) Change in VF trajectories from Arc to Scan movements, when contacting CD4 T cells. The distance of the VF tip to the target T cells was calculated over time for 10 representative VF. Vertical red lines highlight the average scanning time of filopodia on the CD4 T cell membrane. Although scanning by normal filopdoia occurs, we could not resolve definitive trajectories as we did not have a tip marker equivalent to HIV on VF. (F) To illustrate the appearance of Scan trajectories in close contact with CD4 T cells, 3 frames have been taken from a live imaging time lapse experiment in Video S5, and single particle tracking over time highlighted in each frame. All scale bars are at 5 µm. All data is representative of in excess of 12 independent donors.
Figure 3
Figure 3. VF contacts and tethering of CD4 T cell targets.
To analyze the consequence of VF contact, DCs were infected with HIV-iGFP and subsequently co-cultured with autologous CD4 T cells as outlined in Fig. 1. (A) HIV contacts proceed via Arc movements of single VF between cells. In A. Upper panel 6 frames have been taken from live imaging time lapse experiment with single particle tracking in red highlighting the movement of VF between two CD4 T cells (labeled 1 and 2). In A. lower panel VF velocities (blue) and distance from the point of origin (PO) (black) summarize the movement in the former panel, with CD4 T cell contacts indicated by red arrows. (B) Frequency of VF to CD4 Targets over time for 10 representative infected HIV iGFP DC. Each CD4 T cell in the co-culture is listed as “Target” and is represented over time by an open colored triangle (eg. Repeating black triangles, indicated VF contacting the same CD4 T cell “Target A”). CD4 T cell contact data is representative of in excess of 8 independent donors. (C)(F) Multiple VF co-ordinate to tether CD4 T cells. C. Multiple filopodia (highlighted by arrows) are in contact with a neighboring CD4 T cells. Contact is a representative still image, where VF are revealed by F-actin staining using phalloidin (red) and HIV iGFP (white). D. CD4 tethering in real-time. Still images have been taken from Video S8 and time is present in seconds in the upper right corners. Viral filopodia have been outlined with white dotted lines as in Fig. 1. Within still images, CD4 T cell denoted “T1” is actively tethered and moved closer to the DC membrane. Whilst CD4 T cell “T2” remains tethered for the duration of the Video. E. Multiple VF contacts result in CD4 T cell tethering. In the left panel accumulative VF trajectories for a 3 minute infected DC-CD4 T cell co-culture. White arrows and asterix indicate CD4 T cells where either limited VF contact have occurred over this time (less than or equal to 1) or multiple contacts (>5) have occurred respectively. Image derived from Video S9. In the right panel, trajectories of CD4 T cell over the 3 minute co-culture are presented. Note CD4 T cell repositioning associated with high filopodial activity. Image derived from Video S10. F. Distance from the point of origin (upper panel) and velocities (lower panel) for CD4 T cells that are engaged in multiple VF contacts (“tethered”-asterix in E.) versus CD4 T cells with undetectable VF contact (“untethered”-arrows in E.). All data in representative of in excess of 8 independent donors DC-CD4 T cell co-cultures, where greater a minimum of 10 videos were acquired per donor.
Figure 4
Figure 4. VF are capped and continous with immature HIV buds and do not associate with Arp2/3 antigens.
(A) HIV envelope staining at the filopodial tip. An infected DC is presented bearing two long VF (HIV iGFP in white and Phalloidin staining in red) in excess of 20 µm (center panel boxed sections labeled 1 & 2). Left and right panels are magnified and HIV envelope stain is presented as blue. Scale bars in the center panel are 5 µm. Scale bars in left and right panels are 1 µm. (B)(D) HIV at the tip of VF consists of cytosolic uncleave HIV Gag. (B) HIV-T FlAsH staining (white) at the tip of VF with F-actin staining using phalloidin (red) (scale bar is at 5 µm). (C) Further confirmation that HIV particles consist primarily of uncleaved HIV Gag. Image presented is HIV iGFP DC (all HIV particles will be detected) and counter-stained with the anti-p24/Capsid mAb 183 that specifically detects cleaved HIV p24/Capsid. Note the lack of mAb staining for HIV iGFP particles. Scale bar is at 5 µm. (C) Image is representative VF after imaging HIV infected DC via transmission electron microscopy (scale bar at 100 nm). Images in A-C are representative of n = 6 infected DC donors with HIV-T, HIV iGFP (fluorescence) or HIV (electron microscopy). (E) & (F) Virions unable to undergo fission from the plasma membrane (HIV GAG PTAP mutants) form VF. (E) A representative image of VF is presented in the fluorescent image, with HIV iGFP in white and phalloidin staining of actin in red. Note the mutation of the PTAP motif does not prevent VF formation. Data is representative of three independent infections. (F) DCs were infected with HIV iGFP or HIV iGFPPTAP-ve. VF lengths and average trajectory velocities are calculated as outlined in Fig. 1 & 2. Statistical significance is presented as p values. Data is representative of n = 3 independent experiments. (G) & (H) VF are enriched for filopodial antigens, but their antigens do not routinely co-localize with immature HIV particles. Immature DCs were infected as outlined in Fig. 1 and then fixed and counter stained for filopodial antigens (blue), (G) Arp2 and (H) phosphotyrosine (pTyr) staining are presented as overlays with F-actin (red) and HIV iGFP (white). HIV particles in close association with the antigenic stain are highlighted by asterix in volume projected images, whilst non-associated particles are marked by arrows. Staining for Wasp and Cortactin are presented for comparison in the supplementary Fig. S2. All scale bars are at 5 µm. Images are representative of n = 7 independent donors.
Figure 5
Figure 5. VF form by a Diaph2 dependent pathway with frequency regulated by HIV Nef and not HIV Env.
(A) To further delineate how VF pathway are formed, Wasp and Diaph2 was knockdown in the U937 cell line using shRNA. After 2 weeks of puromycin selection, resistant U937 cell lines were infected with HIV iGFP and VF lengths and trajectory velocities enumerated as in Fig. 4. P values are included to highlight significant differences in each variable. Protein knock-down for Wasp and Diaph2 are presented in Fig. S2E. The house-keeping protein Gapdh is present below to normalize lysate loading. Data is representative of 4 independent infections using HIV iGFP. (B) To rule out manipulation of the Arp2/3 filopodial pathway, the U937 cell line was infected with HIV iGFP and two days post infection, infected cells were treated with the Abl/Src kinase inhibitor Dasatinib at 10 µM for 4 hours. Note, under these conditions Vaccinia actin tails do not form (data not shown). VF were then enumerated for lengths and trajectory velocities as outlined Fig. 3. (C) Accumulative single particle tracking for 1 minute of VF trajectories in scrambled controls (upper panel) versus Diaph2 knockdowns (lower panel). Note the confined trajectories in the absence of Diaph2. Diaph2 knockdown particle tracking is derived from Video S12. Scale bars are 5 µm. Data from knockdown experiments is representative of 4 independent HIV iGFP infections. (D) Fixed cell images of control shRNA (upper panel) and Diaph2 (lower panel) transduced cells infected with HIV iGFP. Note the significantly shorter VF lengths in Diaph2 knockdown U937 cells. Scale bars are 5 µm. Images are representative of 4 independent infections with HIV iGFP. (E) Attenuation of cell-cell transfer in Diaph2 knockdown U937. U937 were infected with HIV and 2 days post infection were stained for HIV p24 and enumerated by flow cytometry. After infections were verified to be equivalent, infected U937 cells were co-cultured at a ratio of 1∶5 with the T cell HIV indicator cell line JLTR-R5. Four days post infection, fluorescent images were acquired for the entire well and enumerated using Image J. Standard deviations represent co-cultures in triplicate. Data is representative of 3 independent infections. (F) VF form in the absence of HIV envelope. DCs were infected with either VSVg pseudotyped HIV iGFP or HIV iGFP-ENV-ve as outlined in Fig. 1. VF were then enumerated for lengths and trajectory velocities as outlined B. Data is representative of four independent infections. P values are presented for significant differences. (G) Deletion of HIV Nef leads to significantly lower VF frequency on DC. Enumeration of VF numbers over time in uninfected DCs (U/T), or HIV infected DCS with HIViGFP or HIV-NEF-iGFP. Each point represents live imaging of a VF bearing DC over a period of 2 minutes under imaging conditions outlined in materials and methods. Accumulative data presented is equally drawn from 5 independent donors. Statistical significance is indicated by p values.
Figure 6
Figure 6. Viral filopodial contacts precedes the formation of an enveloping DC-CD4 T cell contact.
(A)(D) Long-term contact by an infected DC leads to enveloping of the neighboring CD4 T cells. (A) Long-term enveloping in real-time. To follow the consequence of initial VF contact and tethering, HIV iGFP infected DC initially engaged in VF contacts with CD4 T cells were imaged over a period of 2 hours. Stills were taken from Video S15, with time elapsed presented in the upper left corner as minutes. In the final frame, two CD4 T cells are labeled 1 & 2 that have been enveloped by the infected DC. Scale bar at 5 µm. (B) Enveloping of multiple CD4 T cells. DCs were infected with HIV-T and 5 days post infection co-cultured with CD4 T cells at a ratio of 1 DC to 3 CD4 T cells for 2 hours. HIV particles were then imaged using FlAsH staining (green), samples fixed/permeabilized and nuclei countered stained with DAPI (Blue). Note CD4 T cells numbered 1 through to 4 have distal and proximal FlasH positive viral particles across their membrane. (C) Viral synapses between infected DC and CD4 T cells mature into extensive enveloping contacts. DC-T cell co-cultures are generated as per conditions in B, with the exception of the use of HIV iGFP (green). After 2 hours of co-culture, cells were stained with the DC membrane marker CD209 (red) and nuclei counterstained with DAPI (blue). Upper panel is representative of an infected DC engaging multiple CD4 T-cells as in B. In the lower panel, the infected DC is limited to two CD4 T cells, with the T cell conjugated on the right with a representative infected DC-T cell viral synapse. Scale bars are at 5 µm. Images are representative from 4 independent donors. (D) Long-term enveloping precedes viral fission across the synaptic cleft and seeding of the CD4 T cell with mature HIV. DCs were infected and co-cultured with autologous CD4 T cells as in (C). Total HIV (iGFP - green), mature HIV (Anti-p24/Capsid clone 183 in red) staining was carried out as per materials and methods. Nuclei are stained with DAPI as in (B). Arrow denotes accumulation of mature HIV particles at the viral synapse and also at the distal CD4 T cell membrane. Note HIV iGFP staining at the viral synapse exceeds mature HIV particles. Scale bar at 5 µm. (E) Electron microscopy confirms the presence of both immature/actively budding (black arrows) and mature HIV virions (white arrows) between the DC-T cell mature contact zone. The appearance of a rare immature HIV particle is marked by *. Scale bar, 500 nm. Data from A–D is representative of n = 5 donors. (F–H) Schematic of the sequential contacts by VF (F), leading to selection and tethering (G) and enveloping of the T cells target coinciding with viral release (H). Whilst upper panels are schematics, lower panels have included primary representative data to support schematics.
Figure 7
Figure 7. High VF frequencies correlate with the efficiency of immature DC viral transfer.
(A) Schematic of the DC-CD4 T cell transfer assay. DC are infected with either HIVWT (high VF frequency) or HIV-NEF-ve (low VF frequency) pseudotyped with the VSVg glycoprotein, to ensure equal infection frequencies. After 4 days, DC infections are normalized to 5% with uninfected DC. Normalized populations are serially diluted below 1 infected DC per co-culture. 4 days post co-culture, CD4 T cell infections are resolved by staining cells for of HIV capsid and resolution by flow cytometry. (B) Flow cytometry detection of HIV p24 within CD4 T cell recipients when input infected DC are limiting (upper panel) versus (C) when input infected CD4 T cells are limiting (lower panel). Approximate infected cell number input into co-cultures is indicated at “Approx. Input*” on the X-axis. CD4 T cell infection frequencies are detected by the accumulation of a high HIV p24 population as indicated by the square gate in each dot-plot. Statistical difference is presented in upper HIV WT panels, and is calculated from data acquired from the same assay performed in triplicate. CD4 T cell infection frequency versus infected donor input is further summarized in right panels for two representative donors. Standard deviations represent co-cultures in triplicate. Data is representative of n = 8 independent donors.

References

    1. Carr JM, Hocking H, Li P, Burrell CJ. Rapid and efficient cell-to-cell transmission of human immunodeficiency virus infection from monocyte-derived macrophages to peripheral blood lymphocytes. Virology. 1999;265:319–329. - PubMed
    1. Jolly C, Kashefi K, Hollinshead M, Sattentau QJ. HIV-1 cell to cell transfer across an Env-induced, actin-dependent synapse. J Exp Med. 2004;199:283–293. - PMC - PubMed
    1. Sigal A, Kim JT, Balazs AB, Dekel E, Mayo A, et al. Cell-to-cell spread of HIV permits ongoing replication despite antiretroviral therapy. Nature. 2011;477:95–98. - PubMed
    1. Turville SG, Santos JJ, Frank I, Cameron PU, Wilkinson J, et al. Immunodeficiency virus uptake, turnover, and 2-phase transfer in human dendritic cells. Blood. 2004;103:2170–2179. - PubMed
    1. Kawamura T, Cohen SS, Borris DL, Aquilino EA, Glushakova S, et al. Candidate microbicides block HIV-1 infection of human immature Langerhans cells within epithelial tissue explants. J Exp Med. 2000;192:1491–1500. - PMC - PubMed

Publication types