. 2012;8(6):e1002732.
doi: 10.1371/journal.pgen.1002732. Epub 2012 Jun 7.

RNA methylation by the MIS complex regulates a cell fate decision in yeast

Affiliations

RNA methylation by the MIS complex regulates a cell fate decision in yeast

Sudeep D Agarwala et al. PLoS Genet. 2012.

Abstract

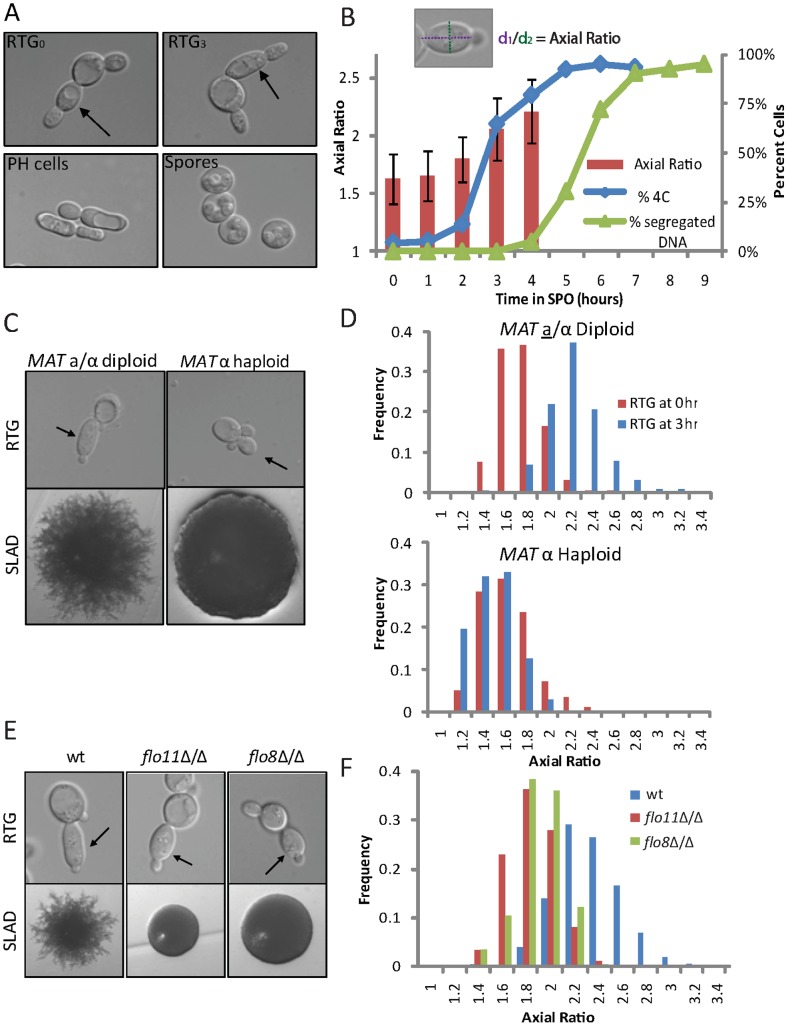
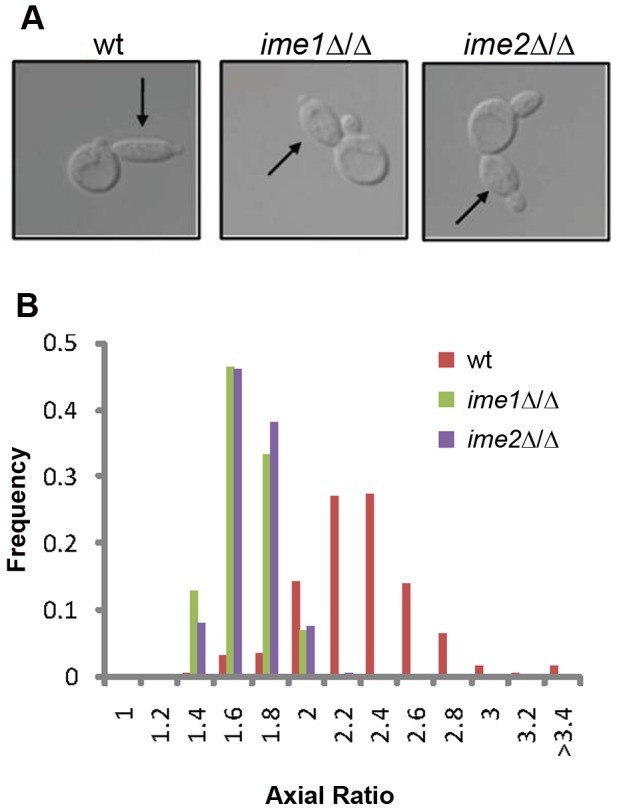
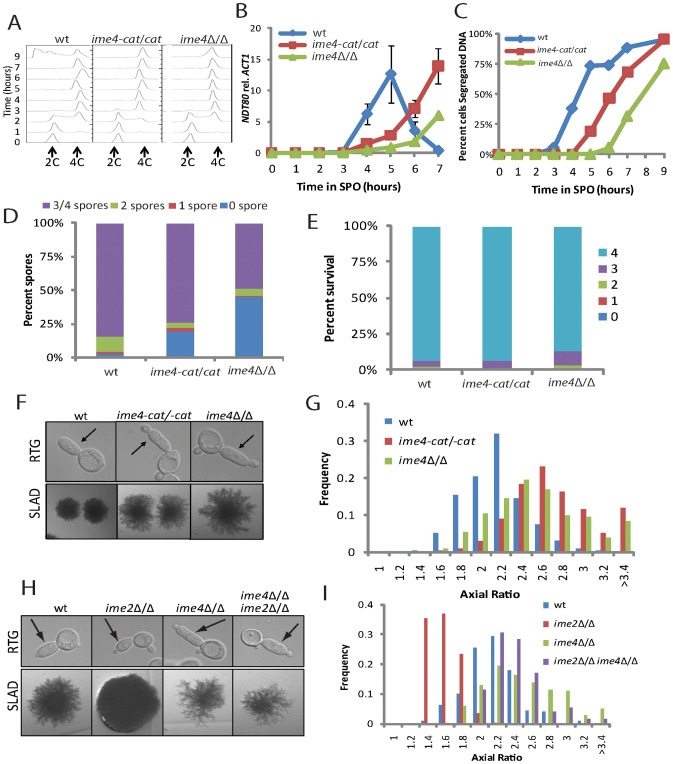
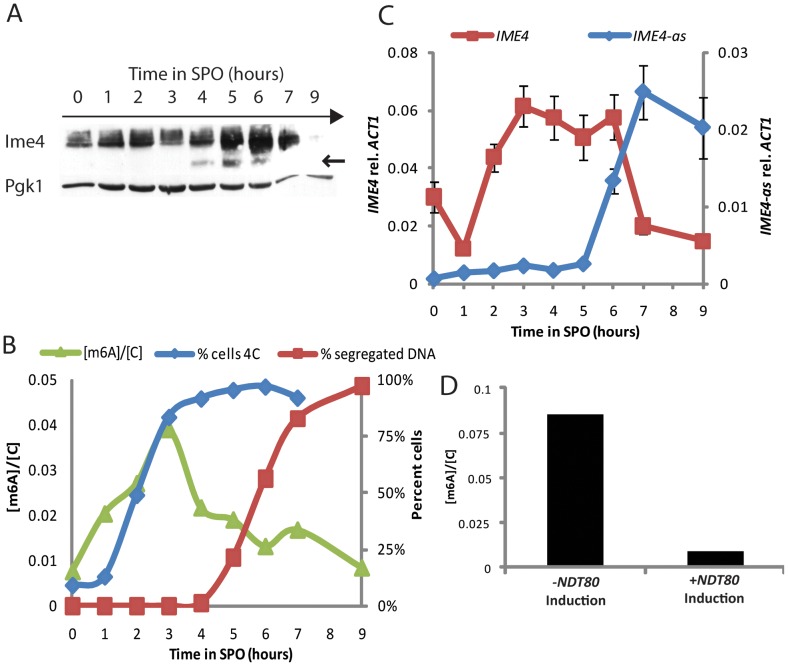
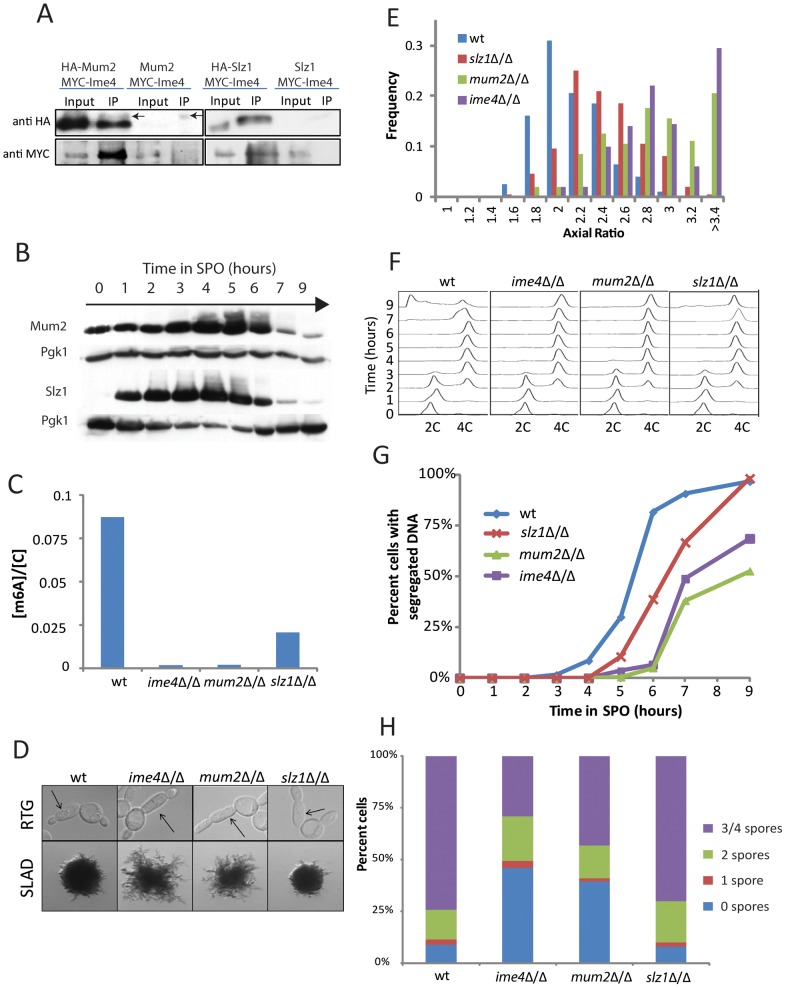
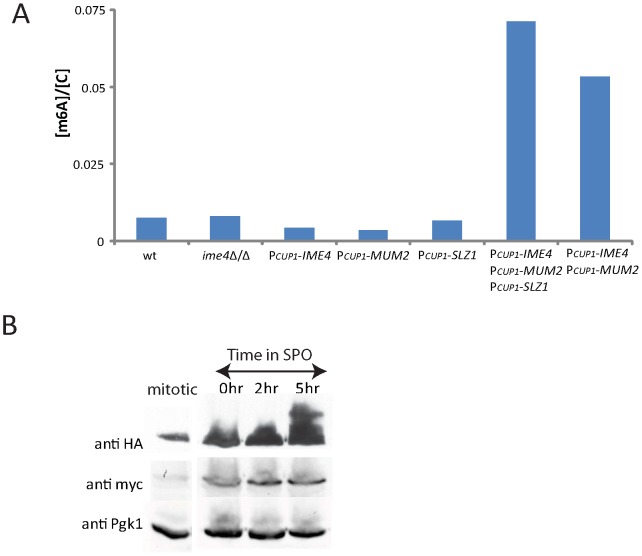
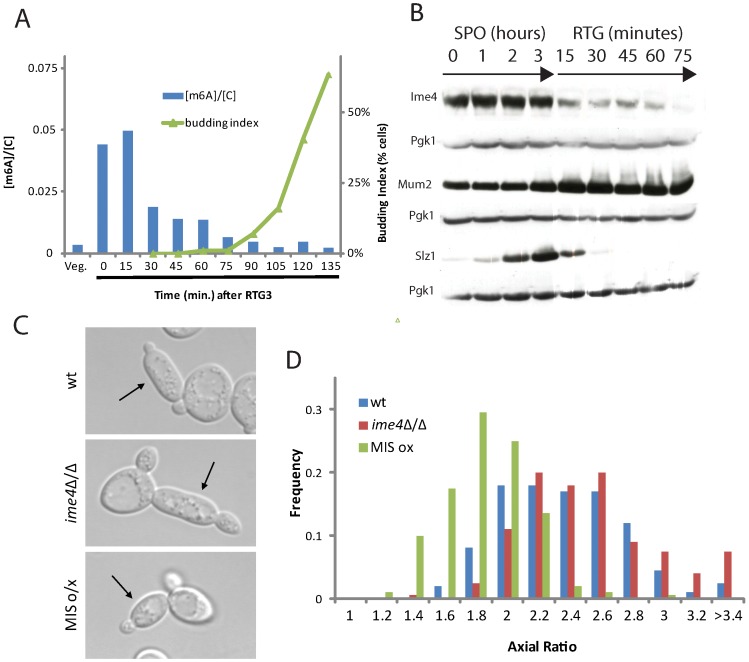
For the yeast Saccharomyces cerevisiae, nutrient limitation is a key developmental signal causing diploid cells to switch from yeast-form budding to either foraging pseudohyphal (PH) growth or meiosis and sporulation. Prolonged starvation leads to lineage restriction, such that cells exiting meiotic prophase are committed to complete sporulation even if nutrients are restored. Here, we have identified an earlier commitment point in the starvation program. After this point, cells, returned to nutrient-rich medium, entered a form of synchronous PH development that was morphologically and genetically indistinguishable from starvation-induced PH growth. We show that lineage restriction during this time was, in part, dependent on the mRNA methyltransferase activity of Ime4, which played separable roles in meiotic induction and suppression of the PH program. Normal levels of meiotic mRNA methylation required the catalytic domain of Ime4, as well as two meiotic proteins, Mum2 and Slz1, which interacted and co-immunoprecipitated with Ime4. This MIS complex (Mum2, Ime4, and Slz1) functioned in both starvation pathways. Together, our results support the notion that the yeast starvation response is an extended process that progressively restricts cell fate and reveal a broad role of post-transcriptional RNA methylation in these decisions.


Conflict of interest statement

The authors have declared that no competing interests exist.

Figures

Figure 1
Figure 1. RTG from starvation results in three distinct cell morphologies.
(A) Representative morphologies of daughter cells following RTG from SPO throughout a meiotic time course. Top left panel: RTG at 0 hours, i.e., after growth in BYTA, (RTG0); top right panel: RTG at 3 hours (RTG3), which is comparable to PH cells from solid nitrogen medium (bottom left panel). Bottom right panel: RTG at 6 hours (RTG6). RTG0 and RTG3 cells were photographed after one complete cell cycle, corresponding to 160 minutes and 220 minutes after shift to rich medium, respectively (see Figure S1A). RTG6 cells were photographed three hours after shift to rich medium, at which point the majority of cells (>95%) had formed spores. Arrows indicate primary daughter cells upon RTG0 and RTG3. B) Quantification of axial ratio in wild-type (SAy821) cells upon RTG throughout a meiotic time course (red bars, left axis; n = 200 cells/time point) relative to percent of cells undergoing pre-meiotic DNA synthesis (i.e., 4C cells) (blue diamonds, right axis, quantified by FACS, 3×10⁴ cells/time point) and percent cells undergoing meiotic divisions as assayed by DAPI staining (green triangles, right axis). Schematic at top defines axial ratio. The majority (>80%) of RTG5, RTG6, RTG7, and RTG9 cells either formed spores or remained unbudded three hours after shift to rich medium; axial ratio was therefore not quantified for these time points. C) MAT a/α diploids (SAy821) (top left panel) or MAT α haploids (H224) (top right panel) were returned to growth in rich medium after meiotic induction. Arrows indicate primary buds. Bottom panels represent colony morphologies after growth on SLAD for 6 days. D) Distribution of axial ratios of primary daughter cells upon RTG3 for strains in (C): wild-type diploid (SAy821 top panel), haploid MAT α (H224 bottom panel) (n = 200 cells/strain). RTG0 is represented in red bars, RTG3 in blue bars. E) Wild-type (SAy821), flo11Δ/Δ (SAy789) and flo8Δ/Δ (SAy905) daughter cell morphologies upon RTG3 (top panels). Arrows indicate primary daughter cells. The same strains were photographed after growth on SLAD for 6 days (bottom panels). Axial ratios are quantified in (F) (n = 200 cells/strain).
Figure 2
Figure 2. IME1 and IME2 are necessary for RTG PH development.
A) Representative bud morphology after RTG3 in wild-type (SAy821), ime1Δ/Δ (SAy834) and ime2Δ/Δ (SAy859). Arrows indicate primary buds. The same strains were photographed after growth on SLAD for 6 days (bottom panels). B) Axial ratio quantification of RTG3 cells for strains in (A) (n = 200 cells/strain).
Figure 3
Figure 3. Cells encoding IME4 mutant alleles show developmental defects.
A) FACS analysis of DNA synthesis in wild-type (SAy821), ime4-cat/cat (SAy1086) and ime4Δ/Δ (SAy771) strains throughout a meiotic time course (n = 3×10⁴ cells/strain/time point). DNA content of diploid cells before DNA replication (2C) and after DNA replication (4C) is indicated. B) NDT80 transcript levels in the strains from (A) during a meiotic time course. Transcript levels were determined by RT-PCR and normalized to ACT1 transcript levels. C) Kinetics for meiotic nuclear divisions as assayed by DAPI DNA staining in the strains from (A) (n = 200 cells/strain). D) Number of asci with one, two, three, four, or no spores in the strains from (A) after 24 hours in SPO medium (n = 200 cell/strain). E) Spore viability in the strains from (A); legend indicates number of surviving spores upon dissection (n = 187 tetrads/strain). F) Representative images of cells from strains in (A) after RTG3 (top panels—arrows indicate primary buds) and colonies grown on SLAD for 6 days (bottom panels). G) Quantification of axial ratios of RTG3 cells shown in (F), (n = 200 cells/strain). H) Representative images of cells after RTG3 (top panels—arrows indicate primary buds) and colonies grown on SLAD for 6 days (bottom panels) of wild-type (SAy821), ime2Δ/Δ (SAy859), ime4Δ/Δ (SAy771) or ime2Δ/Δ ime4Δ/Δ (SAy1123) strains. Arrows indicate primary daughter cells. I) Quantification of axial ratios of RTG3 cells shown in (H), (n = 200 cells/strain).
Figure 4
Figure 4. m6A accumulates prior to meiotic divisions.
A) Western analysis for 3x-myc-tagged Ime4 protein (SAy914) throughout meiosis; Pgk1 protein serves as loading control. B) Quantification of m6A abundance relative to cytosine throughout meiosis (green triangles, left axis) in a wild-type strain (SAy821). Percent of 4C cells as quantified by FACS (3×10⁴ cells/time point—blue diamonds, right axis) and percent cells undergoing nuclear divisions as assayed by DAPI staining (200 cells/time point—red squares, right axis) are shown as references for meiotic progression. C) Strand-specific qPCR for sense IME4 (red squares, left axis) and antisense transcript (IME4-as) (blue diamonds, right axis) transcript throughout meiosis. D) m6A relative to cytosine quantification in cells carrying an estradiol-inducible NDT80 construct as their sole source of NDT80 (SAy995). Cells were treated with β-estradiol or vehicle 6 hours after meiotic induction and monitored at 9 hours.
Figure 5
Figure 5. Mum2 and Slz1 interact with Ime4 and are required for m6A formation.
A) Western analysis for co-immunoprecipitation of Mum2 (left panels) and Slz1 (right panels) with Ime4. HA-tagged Mum2 or Slz1 was immunoprecipitated from cellular extracts 3 hours after induction of meiosis and probed for interaction with myc-tagged Ime4 (SAy1232, SAy1253, respectively). A myc-Ime4 (SAy914) strain without HA-tags served as a control. Arrows in the IP lanes indicate IgG bands. B) Western analysis for HA-tagged Mum2 protein (SAy1235) or HA-tagged Slz1 protein (SAy1254) throughout meiosis; Pgk1 protein serves as loading control. C) Quantification of m6A on mRNA three hours after meiotic starvation, when m6A accumulation is maximal in wild-type cells (SAy821). Deleting any one of ime4Δ/Δ (SAy771), mum2Δ/Δ (SAy1196) and slz1Δ/Δ (SAy1206) results in a reduction in m6A levels. D) Wild-type (SAy821), ime4Δ/Δ (SAy771), mum2Δ/Δ (SAy1196) and slz1Δ/Δ (SAy1206) daughter cell morphology upon RTG3 (top panels). Arrows indicate primary buds. The same strains were photographed after growth on SLAD for 6 days (bottom panels). E) Axial ratio quantification of primary daughter cells upon RTG3 for strains in (D). (F) FACS analysis of DNA synthesis in strains from (D) throughout a meiotic time course (n = 3×10⁴ cells/strain/time point). DNA content of diploid cells before DNA replication (2C) and after DNA replication (4C) is indicated. G) Kinetics for meiotic nuclear divisions as assayed by DNA staining by DAPI in the strains from (C) (n = 200 cells/strain/time point). H) Number of asci with one, two, three/four, or no spores in strains from (D) after 24 hours in SPO medium (n = 200 cell/strain).
Figure 6
Figure 6. MIS complex expression is sufficient to induce m6A accumulation on mRNA.
A) m6A accumulation on mRNA was quantified in rich conditions in wild-type (SAy821), ime4Δ/Δ (SAy771), PCUP1-IME4 (SAy1249), PCUP1-MUM2 (SAy1251), PCUP1-SLZ1 (SAy1250), PCUP1-IME4 PCUP1-MUM2 PCUP1-SLZ1 (SAy1248) and PCUP1-IME4 PCUP1-IME4 (SAy1252) after 150 minutes of mitotic growth in the presence of cupric sulfate. B) Western analysis for expression of Ime4 and Mum2. Cells encoding epitope-tagged Ime4 and Mum2 (SAy1232) were collected either from the rich cupric-sulfate media conditions in (A) (first column) or at 0, 2, and 5 hours in meiosis (as labeled), then subjected to Western analysis for either Ime4 (anti-myc) or Mum2 (anti-HA). Pgk1 serves as a loading control. Images across each row come from the same exposure.
Figure 7
Figure 7. m6A formation inhibits filamentation.
A) Quantification of m6A abundance relative to cytosine (blue bars, left axis) and budding index (green triangles, right axis) upon RTG3. B) Western analysis for 3x-myc-tagged Ime4 protein (SAy914), 3x-HA-tagged Mum2 protein (SAy1235) or 3x-HA-tagged Slz1 protein (SAy1254) throughout RTG3 (i.e., following the shift to YPD after 3 hours in SPO); Pgk1 protein serves as loading control. C) Representative images of cells from wild-type (SAy821), ime4Δ/Δ (SAy771) and a strain induced to express the three components, IME4, MUM2 and SLZ1 (SAy1248) from PCUP1 after RTG3. All strains were treated with cupric sulfate upon RTG3 into YPD. D) Axial ratio quantifications of RTG3 cells from cells in (C) (n = 200 cells/strain).

References

    1. Cullen PJ, Sprague GF., Jr The regulation of filamentous growth in yeast. Genetics. 2012;190:23–49. - PMC - PubMed
    1. Gimeno CJ, Ljungdahl PO, Styles CA, Fink GR. Unipolar cell divisions in the yeast S. cerevisiae lead to filamentous growth: regulation by starvation and RAS. Cell. 1992;68:1077–1090. - PubMed
    1. Kron SJ, Styles CA, Fink GR. Symmetric cell division in pseudohyphae of the yeast Saccharomyces cerevisiae. Mol Biol Cell. 1994;5:1003–1022. - PMC - PubMed
    1. Dayani Y, Simchen G, Lichten M. Meiotic recombination intermediates are resolved with minimal crossover formation during return-to-growth, an analogue of the mitotic cell cycle. PLoS Genet. 2011;7:e1002083. doi: 10.1371/journal.pgen.1002083. - DOI - PMC - PubMed
    1. Kassir Y, Granot D, Simchen G. IME1, a positive regulator gene of meiosis in S. cerevisiae. Cell. 1988;52:853–862. - PubMed

Publication types

MeSH terms