. 2012;7(6):e36366.
doi: 10.1371/journal.pone.0036366. Epub 2012 Jun 7.

Insecticide resistance mechanisms in the green peach aphid Myzus persicae (Hemiptera: Aphididae) I: A transcriptomic survey

Affiliations

Insecticide resistance mechanisms in the green peach aphid Myzus persicae (Hemiptera: Aphididae) I: A transcriptomic survey

Andrea X Silva et al. PLoS One. 2012.

Abstract

Background: Insecticide resistance is one of the best examples of rapid micro-evolution found in nature. Since the development of the first synthetic insecticide in 1939, humans have invested considerable effort to stay ahead of resistance phenotypes that repeatedly develop in insects. Aphids are a group of insects that have become global pests in agriculture and frequently exhibit insecticide resistance. The green peach aphid, Myzus persicae, has developed resistance to at least seventy different synthetic compounds, and different insecticide resistance mechanisms have been reported worldwide.

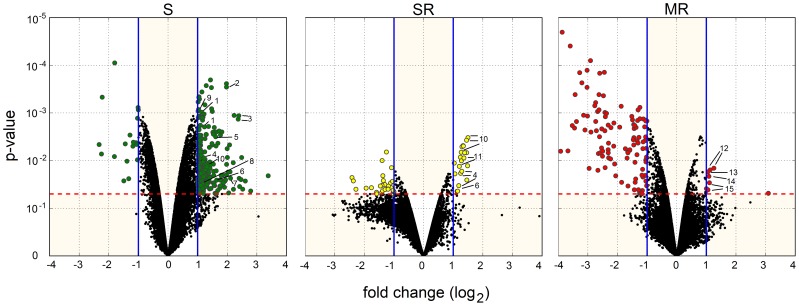
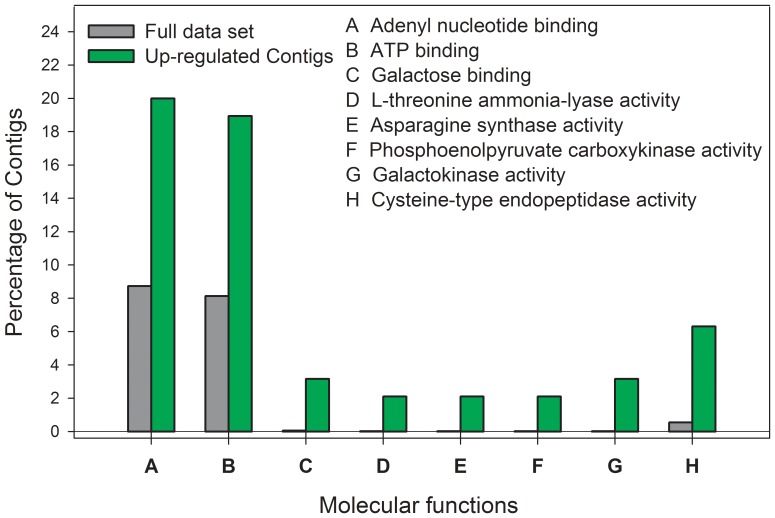
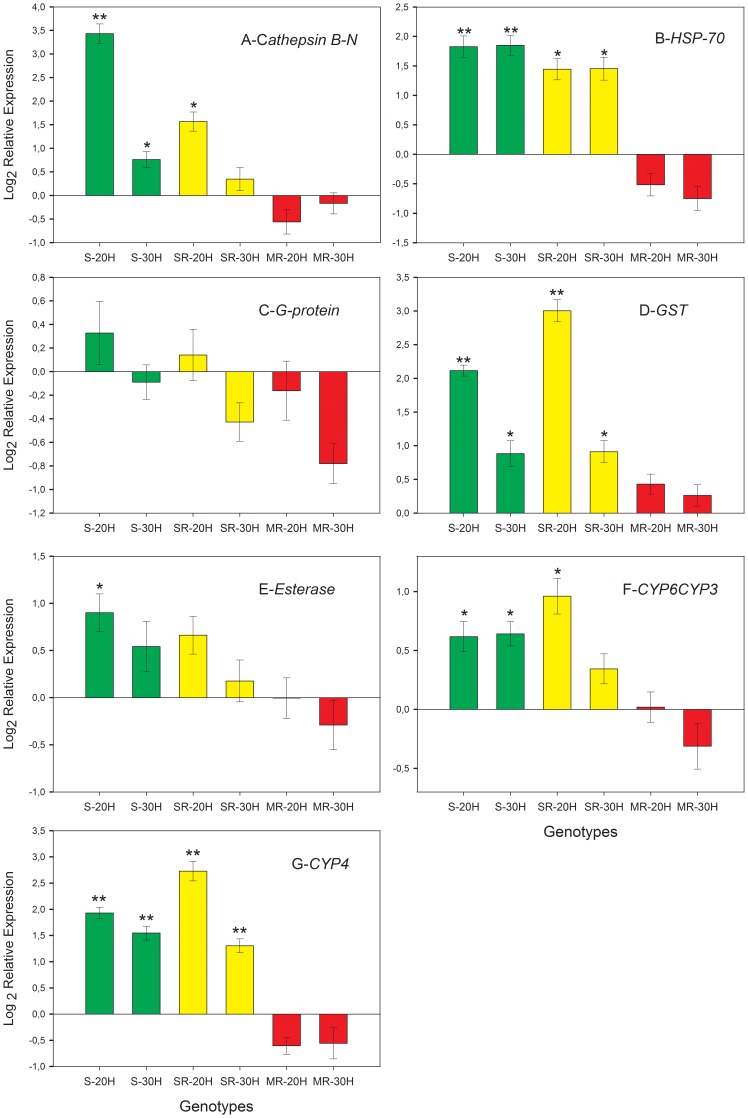
Methodology/principal findings: To further characterize this resistance, we analyzed genome-wide transcriptional responses in three genotypes of M. persicae, each exhibiting different resistance mechanisms, in response to an anti-cholinesterase insecticide. The sensitive genotype (exhibiting no resistance mechanism) responded to the insecticide by up-regulating 183 genes primarily ones related to energy metabolism, detoxifying enzymes, proteins of extracellular transport, peptidases and cuticular proteins. The second genotype (resistant through a kdr sodium channel mutation), up-regulated 17 genes coding for detoxifying enzymes, peptidase and cuticular proteins. Finally, a multiply resistant genotype (carrying kdr and a modified acetylcholinesterase), up-regulated only 7 genes, appears not to require induced insecticide detoxification, and instead down-regulated many genes.

Conclusions/significance: This study suggests strongly that insecticide resistance in M. persicae is more complex that has been described, with the participation of a broad array of resistance mechanisms. The sensitive genotype exhibited the highest transcriptional plasticity, accounting for the wide range of potential adaptations to insecticides that this species can evolve. In contrast, the multiply resistant genotype exhibited a low transcriptional plasticity, even for the expression of genes encoding enzymes involved in insecticide detoxification. Our results emphasize the value of microarray studies to search for regulated genes in insects, but also highlights the many ways those different genotypes can assemble resistant phenotypes depending on the environmental pressure.


Conflict of interest statement

Competing Interests: The authors declare that JSR was a former Ph.D. student of GJ at the Boyce Thomson Institute for Plant Research in Cornell during the time the data reported in this manuscript was collected. Currently, JSR is hired at Agave BioSystems (401 E State St # 200 Ithaca, New York 14850, United States of America). This does not alter the authors’ adherence to all the PLoS ONE policies on sharing data and materials.

Figures

Figure 1
Figure 1. Transcriptional responses in three Myzus persicae genotypes (S, SR and MR) subjected to a pirimicarb.
Volcano plots for each genotype show the log2 fold change (x axis) and the statistical significance (y axis) between the controls and treatments. Vertical lines indicate 2-fold expression difference in either direction (−1>log2FC>1). Horizontal line indicates significance threshold (P<0.05). Statistical analysis is based on a Bayesian inference using a lineal model, and reflects both biological and technical replications. Genes showing both 2-fold differential expression and a significant P value are colored. Not all labels appear in the S, SR and MR volcano plot in order to preserve readability (see Table 2 and supporting material for a full listing of significantly over-expressed genes). Gene abbreviations: 1, glutathione s-transferase; 2, cytochrome p450 family CYP6CYP3; 3, carboxylesterase type FE4; 4, cathepsin b; 5, cytochrome p450 family CYP6; 6, cuticle protein; 7, salivary peptide; 8, ABC transporter; 9, glucose transporter; 10, cytochrome p450; 11, heat shock protein 70; 12, heterotrimeric guanine nucleotide-binding protein; 13, histone h3 methyltransferase, 14, eukaryotic initiation factor; 15, unknown protein.
Figure 2
Figure 2. Correlation of gene expression changes measured using DNA microarray analysis and quantitative reverse transcription PCR (RT-qPCR).
The average log2 fold-change values were used, and each point represents the gene expression in a genotype. Open circles correspond to expression using in RT-qPCR the same RNA samples as were used for microarray experiments. Black circles correspond to expression in RT-qPCR experiments using RNA that was obtained from new biological replicates. Spearman correlation coefficient (r) is shown in the graph.
Figure 3
Figure 3. Distribution of GO IDs at the 2nd level.
Based on their participation in biological processes (A) and molecular functions (B) of up-regulated ESTs (putative proteins) in a sensitive genotype (S) of Myzus persicae treated with pirimicarb. Out of 97 annotated EST sequences, 69 presented GO IDs for biological processes and 88 for molecular functions.
Figure 4
Figure 4. Biological processes over-represented in the sensitive genotype (S) after an Enrichment Analysis.
The bars show the percentage of contigs associated with each GO term. The dark gray bars show the percentage of contigs associated with each GO term considering the full microarray data set. Green bars show the percentage of contigs associated with each GO terms, but only in the up-regulated date set
Figure 5
Figure 5. Molecular functions over-represented in the sensitive genotype (S) after an Enrichment Analysis.
The bars show the percentage of contigs associated with each GO term. The dark gray show the percentage of contigs associated with each GO term considering the full microarray data set. Green bars show the percentage of contigs associated with each GO term but only in the up-regulated date set.
Figure 6
Figure 6. Quantification of relative expression in different genotypes of Myzus persicae exposed to pirimicarb.
Graphs represent the relative mRNA expression in aphids sprayed with pirimicarb in comparison to control (water). Data were normalized for interclonal variation using GADPH expression levels. Green bars correspond to the genotype S (sensitive), Yellow corresponds to the genotype SR (simple resistant) and red bars correspond to the genotype MR (multiple resistant). Same color bars represent the time after insecticide spraying, with left bar = 20 hours and right bar = 30 hours. Data are shown as mean ± SE of two independent experiments, with three technical replicates in each case. *p<0.05 and **p<0.01 indicate a significant difference compared to 1, which was used as a reference value for no change in gene expression, using a t-test. Gene abbreviations: (A) cathepsin B–N, cathepsin B clade N; (B) HSP-70, heat shock protein 70; (C) G protein, Heterotrimeric guanine nucleotide-binding protein; (D) GST, glutathione S-transferase; (E) Esterase, carboxylesterase type E4/FE4; (F) CYP6CYP3, cytochrome p450 family CYP6CYP3; (G) CYP4, cytochrome p450 family CYP4.

References

    1. ffrench-Constant RH, Daborn PJ, Le Goff G. The genetics and genomics of insecticide resistance. Trends in Genetics. 2004;20:163–170. - PubMed
    1. Lenormand T, Bourguet D, Guillemaud T, Raymond M. Tracking the evolution of insecticide resistance in the mosquito Culex pipiens. Nature. 1999;400:861–864. - PubMed
    1. McKenzie JA. Evolutionary Ecology: concepts and case studies. New York: Oxford University Press; 2001. Fox CW, Roff, D.A., Fairbairn, D.J., editor. pp. 347–360.
    1. Whalon ME, Mota-Sanchez D, Hollingworth RM. UK: Oxford University Press; 2008. Global Pesticide Resistance in Arthropods.169
    1. Onstad DW. London, UK: Academic Press; 2008. Insecticide Resistance Management: Biology, Economics and Prediction.320

Publication types