

Quercetin reduces inflammatory responses in LPS-stimulated cardiomyoblasts
- PMID: 22685622
- PMCID: PMC3364695
- DOI: 10.1155/2012/837104
Quercetin reduces inflammatory responses in LPS-stimulated cardiomyoblasts
Abstract
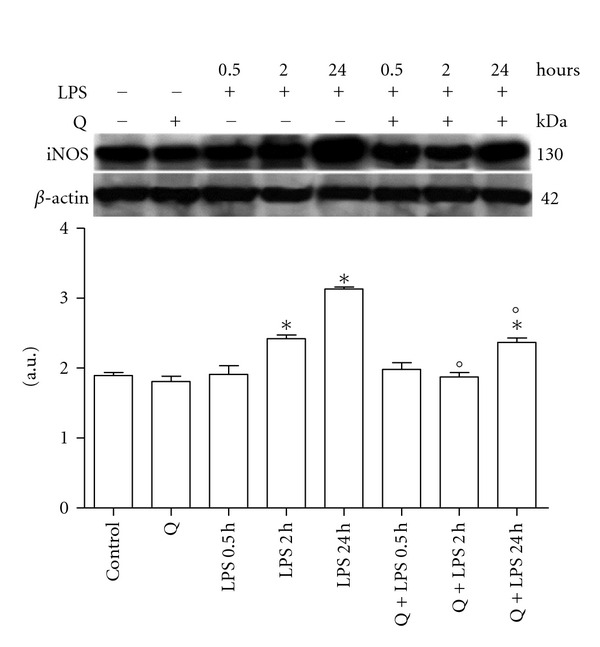
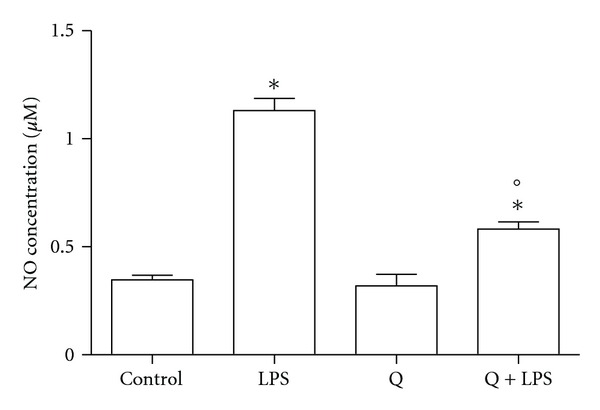
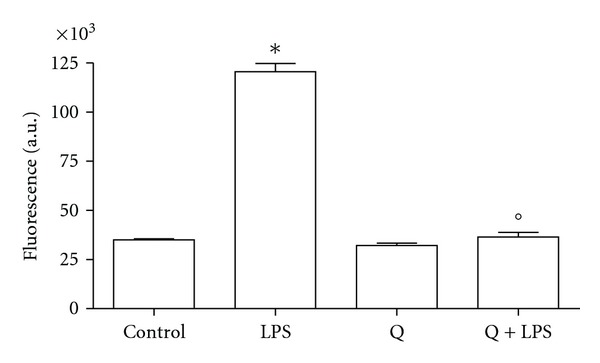
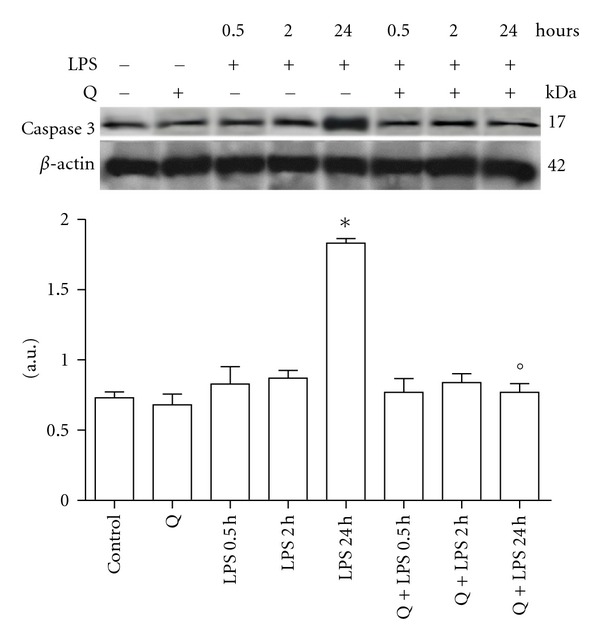
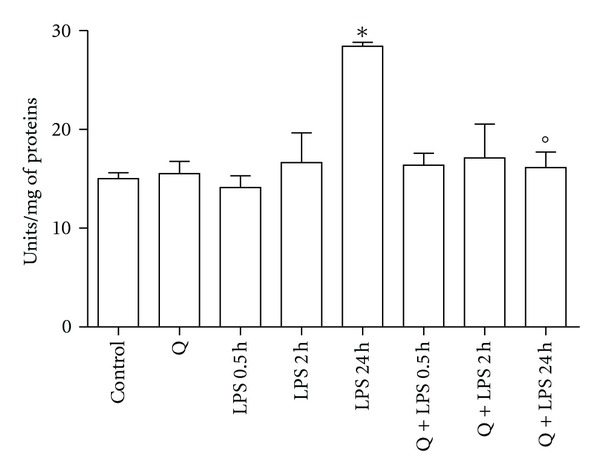
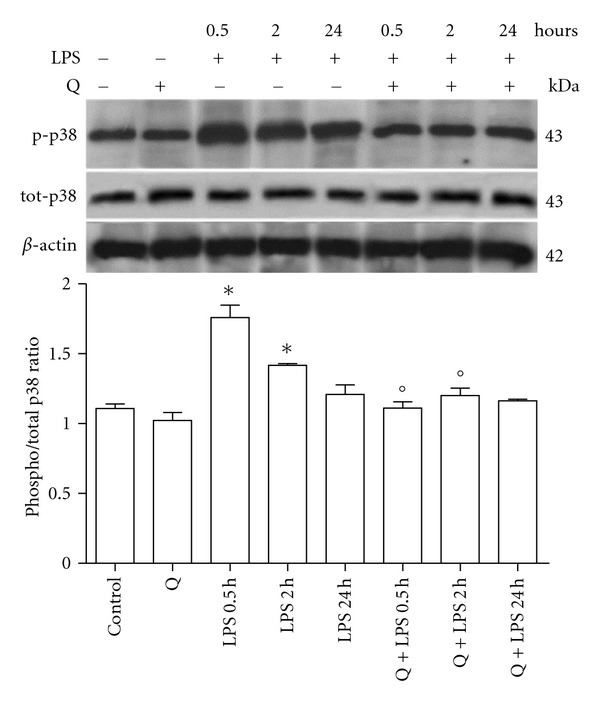
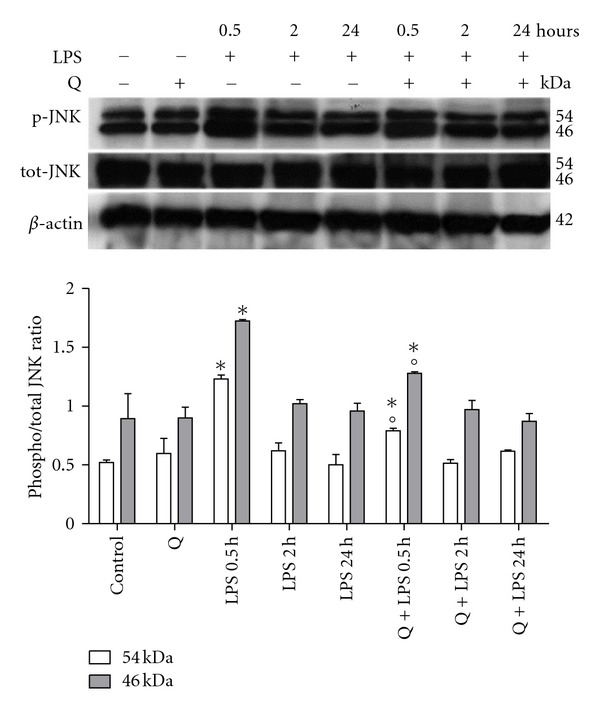
Flavonoids possess several biological and pharmacological activities. Quercetin (Q), a naturally occurring flavonoid, has been shown to downregulate inflammatory responses and provide cardioprotection. However, the mechanisms behind the anti-inflammatory properties of Q in cardiac cells are poorly understood. In inflammation, nitric oxide (NO) acts as a proinflammatory mediator and is synthesized by inducible nitric oxide synthase (iNOS) in response to pro-inflammatory agents such as lipopolysaccharide (LPS), a causative agent in myocardial depression during sepsis. In the present study, we evaluated the protective effect of Q on rat cardiac dysfunction during sepsis induced by LPS. Pretreatment of H9c2 cardiomyoblasts with Q inhibited LPS-induced iNOS expression and NO production and counteracted oxidative stress caused by the unregulated NO production that leads to the generation of peroxynitrite and other reactive nitrogen species. In addition, Q pretreatment significantly counteracted apoptosis cell death as measured by immunoblotting of the cleaved caspase 3 and caspase 3 activity. Q also inhibited the LPS-induced phosphorylation of the stress-activated protein kinases (JNK/SAPK) and p38 MAP kinase that are involved in the inhibition of cell growth as well as the induction of apoptosis. In conclusion, these results suggest that Q might serve as a valuable protective agent in cardiovascular inflammatory diseases.
Figures
Similar articles
-
Puerarin suppresses production of nitric oxide and inducible nitric oxide synthase in lipopolysaccharide-induced N9 microglial cells through regulating MAPK phosphorylation, O-GlcNAcylation and NF-κB translocation.Int J Oncol. 2012 May;40(5):1610-8. doi: 10.3892/ijo.2012.1331. Epub 2012 Jan 13. Int J Oncol. 2012. PMID: 22246431
-
Pioglitazone inhibition of lipopolysaccharide-induced nitric oxide synthase is associated with altered activity of p38 MAP kinase and PI3K/Akt.J Neuroinflammation. 2008 Jan 18;5:4. doi: 10.1186/1742-2094-5-4. J Neuroinflammation. 2008. PMID: 18205920 Free PMC article.
-
The inhibitory action of quercetin on lipopolysaccharide-induced nitric oxide production in RAW 264.7 macrophage cells.J Endotoxin Res. 2001;7(6):431-8. doi: 10.1179/096805101101533034. J Endotoxin Res. 2001. PMID: 11753212
-
Anti-inflammatory effect of Sosihotang via inhibition of nuclear factor-κB and mitogen-activated protein kinases signaling pathways in lipopolysaccharide-stimulated RAW 264.7 macrophage cells.Food Chem Toxicol. 2013 Mar;53:343-51. doi: 10.1016/j.fct.2012.12.006. Epub 2012 Dec 12. Food Chem Toxicol. 2013. PMID: 23246826
-
Zerumin A attenuates the inflammatory responses in LPS-stimulated H9c2 cardiomyoblasts.J Biochem Mol Toxicol. 2021 Jun;35(6):1-11. doi: 10.1002/jbt.22777. Epub 2021 Mar 23. J Biochem Mol Toxicol. 2021. PMID: 33755281
Cited by
-
Effects of Quercetin on Proliferation and H₂O₂-Induced Apoptosis of Intestinal Porcine Enterocyte Cells.Molecules. 2018 Aug 12;23(8):2012. doi: 10.3390/molecules23082012. Molecules. 2018. PMID: 30103566 Free PMC article.
-
Fermentation of Vaccinium floribundum Berries with Lactiplantibacillus plantarum Reduces Oxidative Stress in Endothelial Cells and Modulates Macrophages Function.Nutrients. 2022 Apr 8;14(8):1560. doi: 10.3390/nu14081560. Nutrients. 2022. PMID: 35458122 Free PMC article.
-
Rutin Modulates MAPK Pathway Differently from Quercetin in Angiotensin II-Induced H9c2 Cardiomyocyte Hypertrophy.Int J Mol Sci. 2021 May 11;22(10):5063. doi: 10.3390/ijms22105063. Int J Mol Sci. 2021. PMID: 34064664 Free PMC article.
-
Nitro-oxidative stress after neuronal ischemia induces protein nitrotyrosination and cell death.Oxid Med Cell Longev. 2013;2013:826143. doi: 10.1155/2013/826143. Epub 2013 Aug 1. Oxid Med Cell Longev. 2013. PMID: 23983901 Free PMC article.
-
Antibacterial structure-activity relationship studies of several tricyclic sulfur-containing flavonoids.Beilstein J Org Chem. 2016 May 23;12:1065-71. doi: 10.3762/bjoc.12.100. eCollection 2016. Beilstein J Org Chem. 2016. PMID: 27340492 Free PMC article.
References
-
- Parrillo JE, Burch C, Shelhamer JH, Parker MM, Natanson C, Schuette W. A circulating myocardial depressant substance in humans with septic shock. Septic shock patients with a reduced ejection fraction have a circulating factor that depresses in vitro myocardial cell performance. Journal of Clinical Investigation. 1985;76(4):1539–1553. - PMC - PubMed
-
- Sharma AC. Sepsis-induced myocardial dysfunction. Shock. 2007;28(3):265–269. - PubMed
-
- von Haehling S, Schefold JC, Lainscak M, Doehner W, Anker SD. Inflammatory biomarkers in heart failure revisited: much more than innocent bystanders. Heart Failure Clinics. 2009;5(4):549–560. - PubMed
-
- Charalambous BM, Stephens RCM, Feavers IM, Montgomery HE. Role of bacterial endotoxin in chronic heart failure: the gut of the matter. Shock. 2007;28(1):15–23. - PubMed
Publication types
MeSH terms
Substances
LinkOut - more resources
Full Text Sources
Research Materials
