. 2012:2:445.
doi: 10.1038/srep00445. Epub 2012 Jun 8.

Hybrid dispersion laser scanner

Affiliations

Hybrid dispersion laser scanner

K Goda et al. Sci Rep. 2012.

Abstract

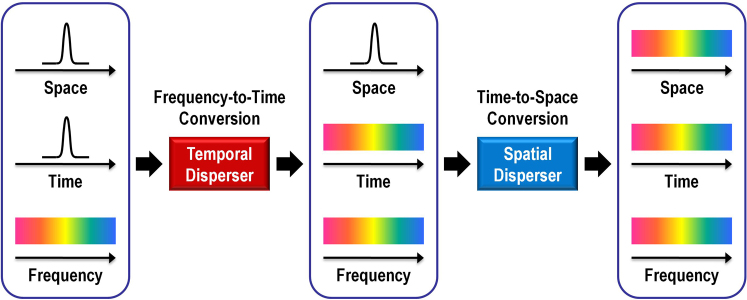
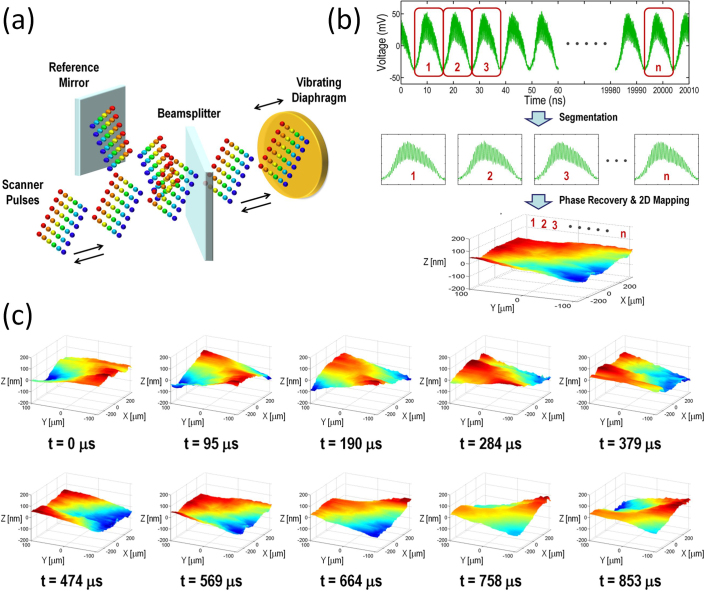
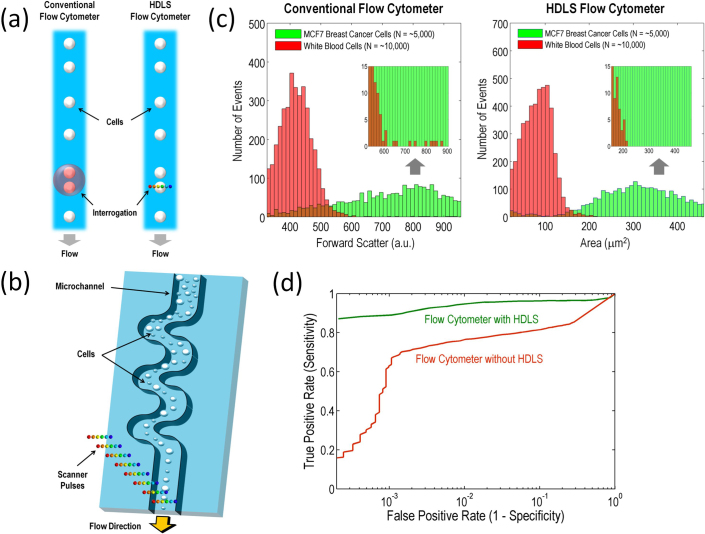
Laser scanning technology is one of the most integral parts of today's scientific research, manufacturing, defense, and biomedicine. In many applications, high-speed scanning capability is essential for scanning a large area in a short time and multi-dimensional sensing of moving objects and dynamical processes with fine temporal resolution. Unfortunately, conventional laser scanners are often too slow, resulting in limited precision and utility. Here we present a new type of laser scanner that offers ∼1,000 times higher scan rates than conventional state-of-the-art scanners. This method employs spatial dispersion of temporally stretched broadband optical pulses onto the target, enabling inertia-free laser scans at unprecedented scan rates of nearly 100 MHz at 800 nm. To show our scanner's broad utility, we use it to demonstrate unique and previously difficult-to-achieve capabilities in imaging, surface vibrometry, and flow cytometry at a record 2D raster scan rate of more than 100 kHz with 27,000 resolvable points.


Figures

Figure 1
Figure 1. Concept of the HDLS.
The operation of the HDLS consists of two steps: frequency-to-time conversion and time-to-space conversion. First, the broadband spectrum of an optical pulse is mapped into a temporal waveform by temporal dispersion. Second, the temporal waveform is converted into a 1D rainbow pulse in space by spatial dispersion. The resultant 1D rainbow pulse is incident onto an object, performing a 1D line scan. Combining the two steps, the spectrum of the pulse is mapped into space, resulting in each frequency component of the spectrum illuminating different spatial coordinates on the target at a different time. Pulses are repeated for repetitive scans at a rate equivalent to the pulse repetition rate.
Figure 2
Figure 2. Chromatic dispersion of the dispersive fiber.
To demonstrate dispersive Fourier transformation in the ∼800 nm spectral band, a single-mode fiber with a smaller effective mode area than conventional fibers in the wavelength operation range is employed. Consequently, the fiber provides increased contribution of waveguide dispersion to the total chromatic dispersion of the fiber (as large as −123 ps/nm/km GVD), enabling dispersive Fourier transformation in this spectral range as indicated by the linear one-to-one relation between wavelength (frequency) and time as well as the small residuals between the data and fit functions.
Figure 3
Figure 3. Schematic of the HDLS.
The optical source is a Ti:Sapphire femtosecond pulse laser that generates a broadband pulse train at 90.8 MHz repetition rate. The pulses are pre-chirped by the prism-based pulse stretcher and enter the dispersive fiber in which the spectrum of each pulse is mapped into the time domain by the GVD of the fiber. A pair of diffraction gratings maps the pulses into space in the horizontal direction, producing 202 subpulses which arrive at different spatial coordinates on the target at different times. Consequently, 1D line scans are performed in the horizontal direction at 90.8 MHz. The AOD scans the pulses in the vertical direction at 105.4 kHz with 132 resolvable points, resulting in the aggregate resolution of 202×132 (horizontal x vertical) (See Methods). The cylindrical lens collimates the pulses deflected at different angles. The colors of the subpulses in the figure are only for illustrative purposes and do not represent the real wavelengths.
Figure 4
Figure 4. Imaging with the HDLS.
(a) Comparison between a CCD image of the test target (left) and a digitally reconstructed image of the target scanned by the HDLS (right). The target consists of the non-reflective word “UCLA” on top of a reflective substrate and was scanned by the HDLS at 90.8 MHz in 1D and 105.4 kHz in 2D for image acquisition. The word “UCLA” appears evident (with the reddish and bluish colors indicating high and low reflectivities, respectively). The number of pixels in the target image is 510×861 (horizontal x vertical) (See Methods). The distortion on the right hand side of the letter “A” is due to the reduced diffraction efficiency of the AOD at a large deflection angle near the edge of the field of view. (b) Horizontal line scans (pulses) at different vertical coordinates (different deflection angles of the AOD) with a time interval of 11 ns, corresponding to the pulse repetition rate of 90.8 MHz. The inset shows one-to-one mapping between the reflection signal from the target measured by the photodetector and the spectrum of the signal measured by a conventional optical spectrum analyzer, clearly establishing the two-step transformation from time via frequency (wavelength) to space in the 800 nm spectral range. The wavelength dependence of the target's reflectivity is negligible as the bandwidth is less than 20 nm centered at ∼800 nm.
Figure 5
Figure 5. Surface vibrometry with the HDLS.
(a) Experimental apparatus for the HDLS-based surface vibrometry. The HDLS is combined with a Michelson interferometer to quantitatively measure the axial position of the vibrating diaphragm at each different set of spatial coordinates. (b) Procedure for producing time-resolved surface profiles with sub-nanometer axial resolution. The axial position of each scanned point on the surface is encoded into the interferometer output (i.e., the interferogram in the time domain), retrieved from the interferogram and its Hilbert transform, and mapped into a 2D matrix for dynamical surface profilometry. (c) Frame sequence of the 1 kHz nanomechanical surface vibration captured by the HDLS-based surface vibrometer with a sub-nanometer axial resolution of 0.4 nm at a frame rate of 105.4 kHz (corresponding to a temporal resolution of 9.5 μs). For clarity, only one every ten scans is shown. The complete frame sequence (movie) of the diaphragm's surface profile is available (Supplementary Movie 1). This is the first time that such a fast nanomechanical surface vibration was measured quantitatively in real time.
Figure 6
Figure 6. Flow cytometry with the HDLS.
(a) Comparison in interrogation method between the conventional flow cytometer and HDLS-based flow cytometer. While conventional flow cytometers cannot resolve multiple cells (i.e., doublets, triplets, and clustered cells) within the interrogation beam due to the lack of spatial resolution, spatial metrics provided by the HDLS can be used to identify these events and hence reduce false positive rate and statistical error yet with high throughput. (b) Experimental apparatus for the HDLS-based flow cytometry. The microfluidic channel focuses and orders randomly distributed cells into a single stream with inertial lift forces (Supplementary Information). HDLS pulses are then focused onto the single stream of fast-flowing cells for forward-scattering measurements. Scattered light from the target is collected by an objective lens and detected by a single-pixel photodetector. To ensure stability, the microfluidic device was fabricated in thermoset polyester (TPE) using standard replica molding methods (Supplementary Information). The volumetric flow rate of cells was controlled by a syringe pump, and a uniform velocity of 1 m/s was achieved by positioning cells precisely in a velocity gradient using inertial focusing. (c) Comparison of size-based histograms obtained with the conventional flow cytometer (left) and the HDLS-based flow cytometer (right) using identical samples of white blood cells and MCF7 breast cancer cells (measured separately). The figure clearly indicates our method's ability to differentiate MCF7 breast cancer cells from white blood cells as it can identify multiple white blood cells as false positive events. (d) Receiver operating characteristic (ROC) curve analysis showing that flow cytometry with the HDLS achieves lower false positive rate than flow cytometry without it, yet with high sensitivity and high throughput (Supplementary Information). This is made possible by the complete spectrum in the spatial frequency domain provided by the HDLS's ultrafast laser-scanning capability.

References

    1. Marshall G. F. Handbook of optical and laser scanning (Dekker, New York, 2009).
    1. Fujii T. & Fukuchi T. Laser remote sensing (CRC Press, New York, 2005).
    1. Dotson C. L. Fundamentals of dimensional metrology (Delmar Cengage Learning, New York, 2006).
    1. Popescu G., Ikeda T., Goda K., Best-Popescu C. A., Laposata M. L., Manley S., Dasari R. R., Badizadegan K. & Feld M. S. Optical measurement of cell membrane tension. Physical Review Letters 97, 218101 (2006). - PubMed
    1. Gobel W., Kampa B. M. & Helmchen F. Imaging cellular network dynamics in three dimensions using fast 3D laser scanning. Nature Methods 4, 73–79 (2007). - PubMed

Publication types

MeSH terms