

The role of biotic interactions in shaping distributions and realised assemblages of species: implications for species distribution modelling
- PMID: 22686347
- PMCID: PMC3561684
- DOI: 10.1111/j.1469-185X.2012.00235.x
The role of biotic interactions in shaping distributions and realised assemblages of species: implications for species distribution modelling
Abstract
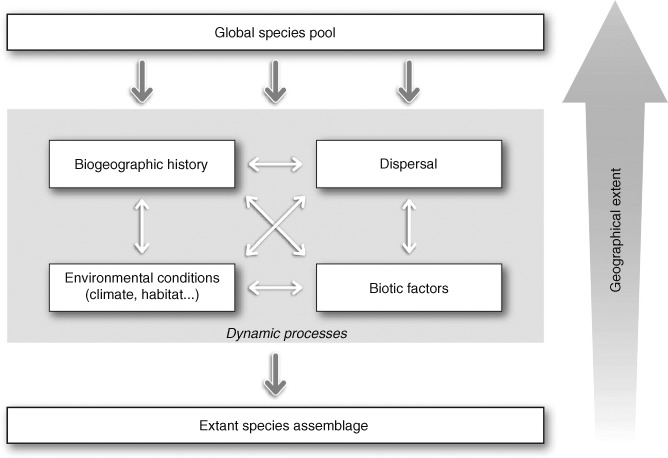
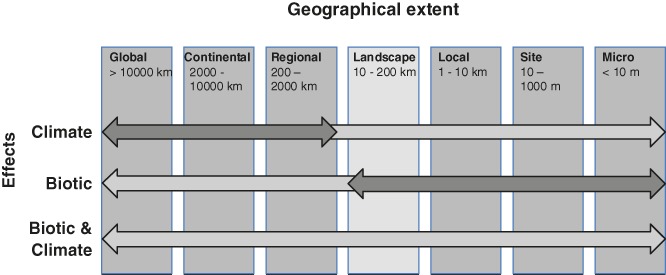
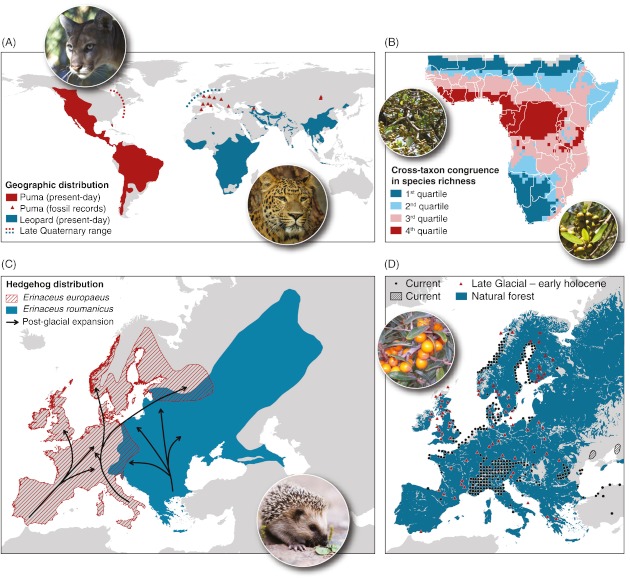
Predicting which species will occur together in the future, and where, remains one of the greatest challenges in ecology, and requires a sound understanding of how the abiotic and biotic environments interact with dispersal processes and history across scales. Biotic interactions and their dynamics influence species' relationships to climate, and this also has important implications for predicting future distributions of species. It is already well accepted that biotic interactions shape species' spatial distributions at local spatial extents, but the role of these interactions beyond local extents (e.g. 10 km(2) to global extents) are usually dismissed as unimportant. In this review we consolidate evidence for how biotic interactions shape species distributions beyond local extents and review methods for integrating biotic interactions into species distribution modelling tools. Drawing upon evidence from contemporary and palaeoecological studies of individual species ranges, functional groups, and species richness patterns, we show that biotic interactions have clearly left their mark on species distributions and realised assemblages of species across all spatial extents. We demonstrate this with examples from within and across trophic groups. A range of species distribution modelling tools is available to quantify species environmental relationships and predict species occurrence, such as: (i) integrating pairwise dependencies, (ii) using integrative predictors, and (iii) hybridising species distribution models (SDMs) with dynamic models. These methods have typically only been applied to interacting pairs of species at a single time, require a priori ecological knowledge about which species interact, and due to data paucity must assume that biotic interactions are constant in space and time. To better inform the future development of these models across spatial scales, we call for accelerated collection of spatially and temporally explicit species data. Ideally, these data should be sampled to reflect variation in the underlying environment across large spatial extents, and at fine spatial resolution. Simplified ecosystems where there are relatively few interacting species and sometimes a wealth of existing ecosystem monitoring data (e.g. arctic, alpine or island habitats) offer settings where the development of modelling tools that account for biotic interactions may be less difficult than elsewhere.
© 2012 The Authors. Biological Reviews © 2012 Cambridge Philosophical Society.
Figures
References
-
- Abrahamczyk S, Kessler M. Hummingbird diversity, food niche characters, and assemblage composition along a latitudinal precipitation gradient in the Bolivian lowlands. Journal of Ornithology. 2010;151:615–625.
-
- Agustí J, Antón M. Mammoths, Sabertooths, and Hominids: 65 Million Years of Mammalian Evolution in Europe. New York: Columbia University Press; 2002.
-
- Algar AC, Kharouba HM, Young ER, Kerr JT. Predicting the future of species diversity: macroecological theory, climate change, and direct tests of alternative forecasting methods. Ecography. 2009;32:22–33.
-
- Araújo MB, Luoto M. The importance of biotic interactions for modelling species distributions under climate change. Global Ecology and Biogeography. 2007;16:743–753.
Publication types
MeSH terms
LinkOut - more resources
Full Text Sources
Miscellaneous
