

Direct optical detection of viral nucleoprotein binding to an anti-influenza aptamer
- PMID: 22687054
- PMCID: PMC3437744
- DOI: 10.1021/ac202427e
Direct optical detection of viral nucleoprotein binding to an anti-influenza aptamer
Abstract
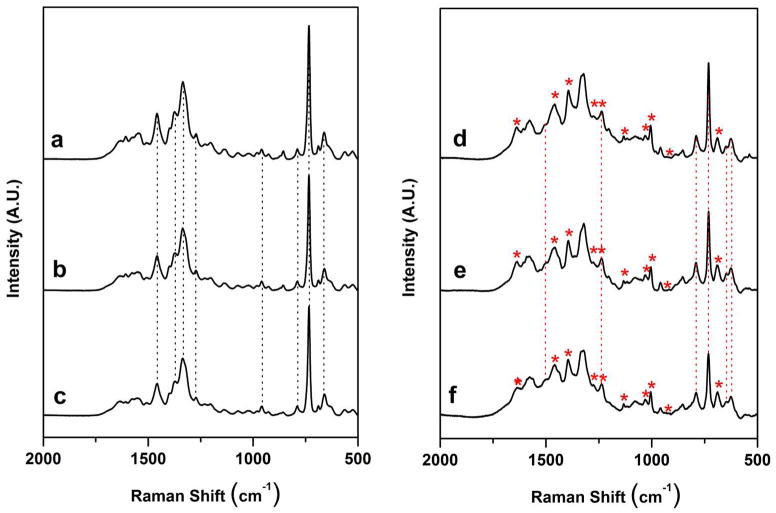
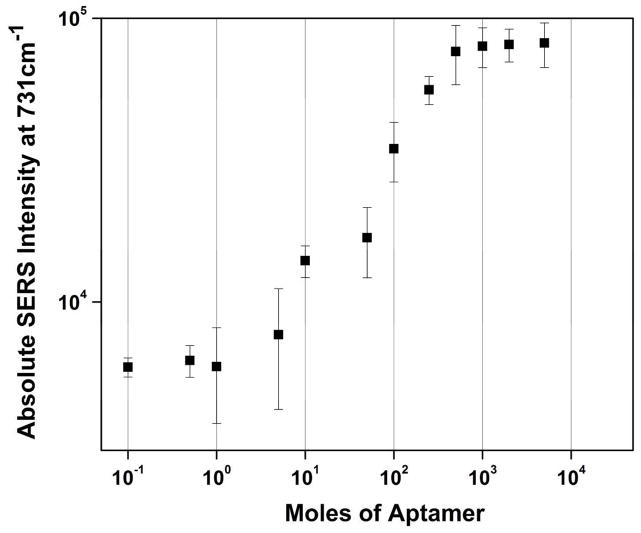
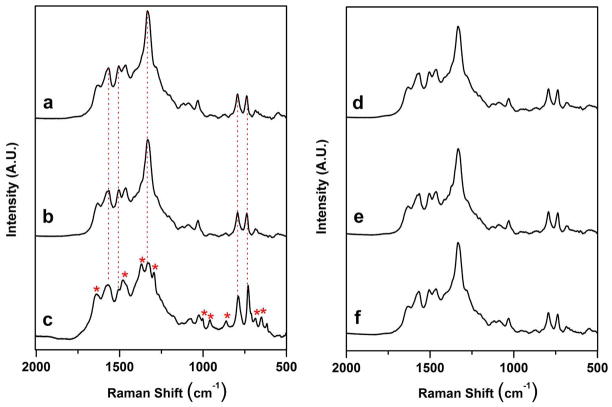
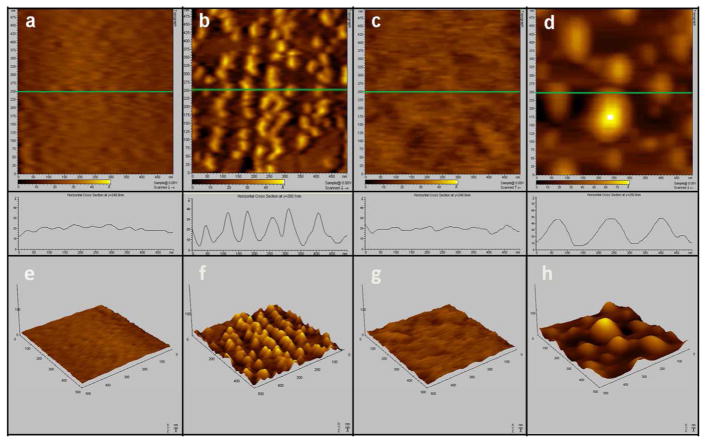
We have demonstrated label-free optical detection of viral nucleoprotein binding to a polyvalent anti-influenza aptamer by monitoring the surface-enhanced Raman (SERS) spectra of the aptamer-nucleoprotein complex. The SERS spectra demonstrated that selective binding of the aptamer-nucleoprotein complex could be differentiated from that of the aptamer alone based solely on the direct spectral signature for the aptamer-nucleoprotein complex. Multivariate statistical methods, including principal components analysis, hierarchical clustering, and partial least squares, were used to confirm statistically significant differences between the spectra of the aptamer-nucleoprotein complex and the spectra of the unbound aptamer. Two separate negative controls were used to evaluate the specificity of binding of the viral nucleoproteins to this aptamer. In both cases, no spectral changes were observed that showed protein binding to the control surfaces, indicating a high degree of specificity for the binding of influenza viral nucleoproteins only to the influenza-specific aptamer. Statistical analysis of the spectra supports this interpretation. AFM images demonstrate morphological changes consistent with formation of the influenza aptamer-nucleoprotein complex. These results provide the first evidence for the use of aptamer-modified SERS substrates as diagnostic tools for influenza virus detection in a complex biological matrix.
Figures


Similar articles
-
Detection of viral nucleoprotein binding to anti-influenza aptamers via SERS.Chem Commun (Camb). 2011 Aug 14;47(30):8635-7. doi: 10.1039/c0cc05433j. Epub 2011 Jun 27. Chem Commun (Camb). 2011. PMID: 21706113
-
Encoded particle microfluidic platform for rapid multiplexed screening and characterization of aptamers against influenza A nucleoprotein.Anal Chim Acta. 2019 Apr 11;1053:70-80. doi: 10.1016/j.aca.2018.11.055. Epub 2018 Dec 5. Anal Chim Acta. 2019. PMID: 30712571
-
An Aptamer-Based Electrochemical Sensor That Can Distinguish Influenza Virus Subtype H1 from H5.J Microbiol Biotechnol. 2017 Nov 28;27(11):2037-2043. doi: 10.4014/jmb.1708.08015. J Microbiol Biotechnol. 2017. PMID: 28910866
-
SERS-Based Biosensors for Virus Determination with Oligonucleotides as Recognition Elements.Int J Mol Sci. 2020 May 10;21(9):3373. doi: 10.3390/ijms21093373. Int J Mol Sci. 2020. PMID: 32397680 Free PMC article. Review.
-
Influenza virus nucleoprotein: structure, RNA binding, oligomerization and antiviral drug target.Future Microbiol. 2013 Dec;8(12):1537-45. doi: 10.2217/fmb.13.128. Future Microbiol. 2013. PMID: 24266354 Review.
Cited by
-
Measuring single-virus fusion kinetics using an assay for nucleic acid exposure.Biophys J. 2022 Dec 6;121(23):4467-4475. doi: 10.1016/j.bpj.2022.11.002. Epub 2022 Nov 9. Biophys J. 2022. PMID: 36330566 Free PMC article.
-
Layer-by-layer polyelectrolyte encapsulation of Mycoplasma pneumoniae for enhanced Raman detection.Analyst. 2014 Sep 7;139(17):4287-95. doi: 10.1039/c4an00596a. Epub 2014 Jul 14. Analyst. 2014. PMID: 25017005 Free PMC article.
-
Identification of virulence determinants in influenza viruses.Anal Chem. 2014 Jul 15;86(14):6911-7. doi: 10.1021/ac500659f. Epub 2014 Jun 27. Anal Chem. 2014. PMID: 24937567 Free PMC article.
-
SERS-Based Aptasensor for Rapid Quantitative Detection of SARS-CoV-2.Nanomaterials (Basel). 2021 May 25;11(6):1394. doi: 10.3390/nano11061394. Nanomaterials (Basel). 2021. PMID: 34070421 Free PMC article.
-
Detection of genetic markers related to high pathogenicity in influenza by SERS.Analyst. 2013 Sep 7;138(17):4877-84. doi: 10.1039/c3an00774j. Epub 2013 Jul 8. Analyst. 2013. PMID: 23833767 Free PMC article.
References
-
- Smith GJD, Vijaykrishna D, Bahl J, Lycett SJ, Worobey M, Pybus OG, Ma SK, Cheung CL, Raghwani J, Bhatt S, Peiris JSM, Guan Y, Rambaut A. Nature. 2009;459:1122–1125. - PubMed
-
- Watcharatanyatip K, Boonmoh S, Chaichoun K, Songserm T, Woratanti M, Dharakul T. J Virol Methods. 2010;163:238–243. - PubMed
-
- Amano Y, Cheng Q. Anal Bioanal Chem. 2005;381:156–164. - PubMed
Publication types
MeSH terms
Substances
Grants and funding
LinkOut - more resources
Full Text Sources
Other Literature Sources
Miscellaneous
