. 2012 Sep;61(9):2269-79.
doi: 10.2337/db11-1462. Epub 2012 Jun 11.

Pulsatile portal vein insulin delivery enhances hepatic insulin action and signaling

Affiliations

Pulsatile portal vein insulin delivery enhances hepatic insulin action and signaling

Aleksey V Matveyenko et al. Diabetes. 2012 Sep.

Abstract

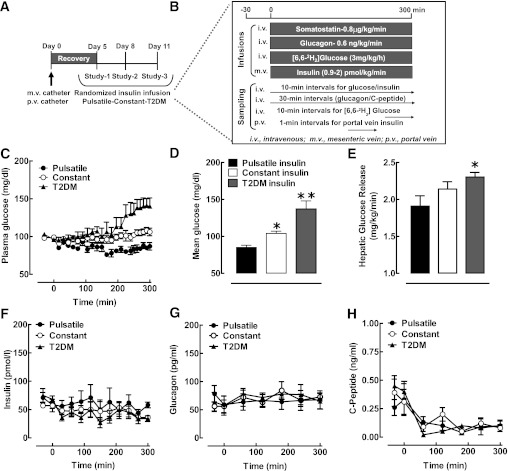
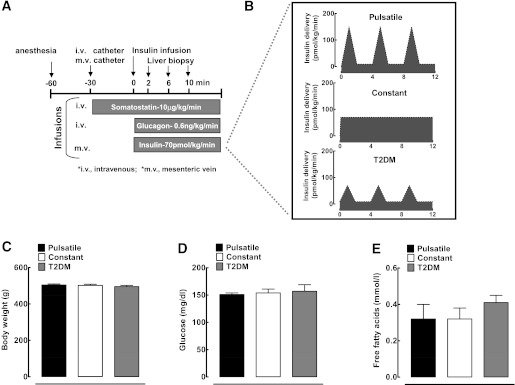
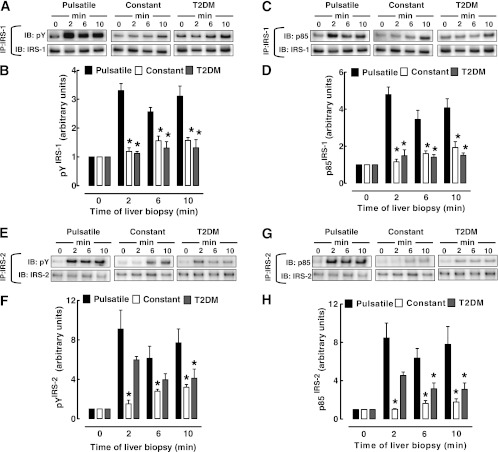
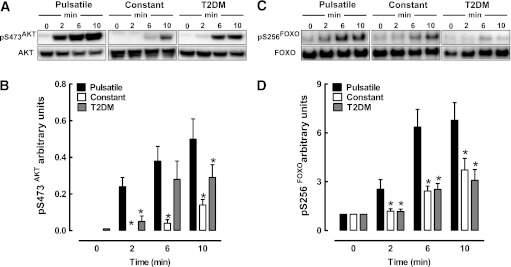
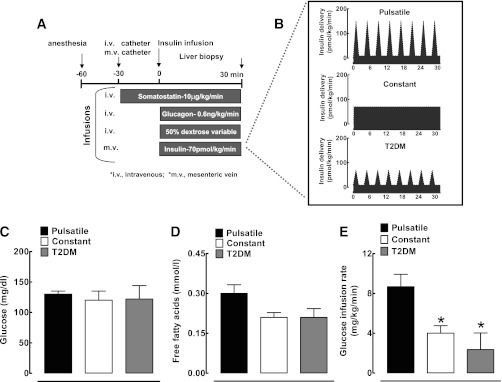
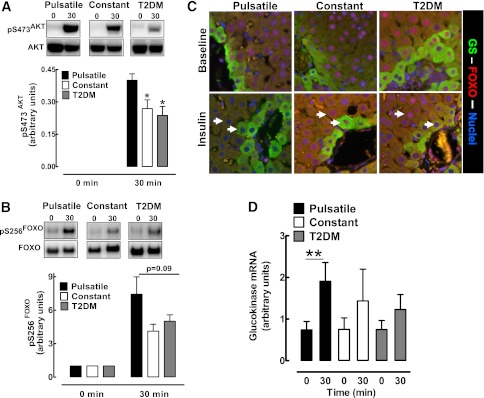
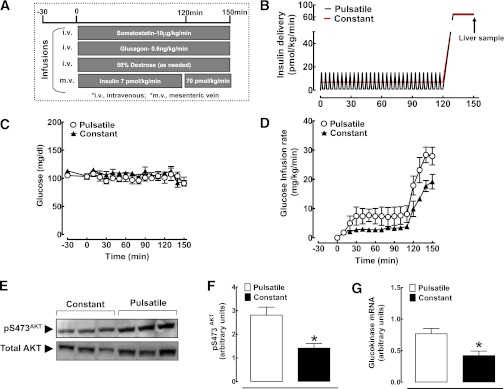
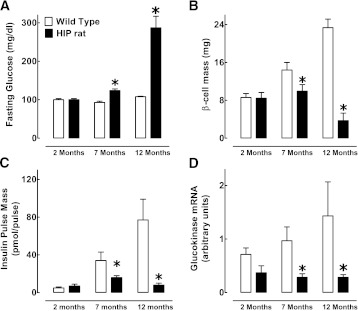
Insulin is secreted as discrete insulin secretory bursts at ~5-min intervals into the hepatic portal vein, these pulses being attenuated early in the development of type 1 and type 2 diabetes mellitus (T2DM). Intraportal insulin infusions (pulsatile, constant, or reproducing that in T2DM) indicated that the pattern of pulsatile insulin secretion delivered via the portal vein is important for hepatic insulin action and, therefore, presumably for hepatic insulin signaling. To test this, we examined hepatic insulin signaling in rat livers exposed to the same three patterns of portal vein insulin delivery by use of sequential liver biopsies in anesthetized rats. Intraportal delivery of insulin in a constant versus pulsatile pattern led to delayed and impaired activation of hepatic insulin receptor substrate (IRS)-1 and IRS-2 signaling, impaired activation of downstream insulin signaling effector molecules AKT and Foxo1, and decreased expression of glucokinase (Gck). We further established that hepatic Gck expression is decreased in the HIP rat model of T2DM, a defect that correlated with a progressive defect of pulsatile insulin secretion. We conclude that the physiological pulsatile pattern of insulin delivery is important in hepatic insulin signaling and glycemic control. Hepatic insulin resistance in diabetes is likely in part due to impaired pulsatile insulin secretion.


Figures

FIG. 1.
FIG. 1.
Intraportal fasting insulin replacement protocol in dogs. A: All dogs had a portal vein sampling and mesenteric vein infusion catheter placed surgically under general anesthesia. After a 5-day recovery period, each dog was exposed in random order to 1) pulsatile portal vein insulin infusion, 2) constant portal vein insulin infusion, and 3) portal vein insulin infusion designed to reproduce that observed in patients with T2DM. B: For each of these protocols, dogs were placed in a laboratory sling and somatostatin (0.8 µg/kg/min) and glucagon (0.65 ng/kg/min) were infused through the foreleg catheter throughout the study (0–300 min). A primed (3 mg/kg) continuous (3 mg/kg/h) infusion of [6, 6-2H2]glucose was given via foreleg catheter throughout the study to permit glucose turnover measurements. For the pulsatile protocol, insulin was infused into the mesenteric vein catheter with 70% of insulin delivered in pulses and 30% as a basal constant insulin infusion. For constant insulin infusion, the same total amount of insulin was delivered at a constant rate. For the T2DM protocol, insulin was delivered with 50% diminished pulses at the same frequency and with same basal insulin delivery. C: Plasma glucose levels at baseline (−30 to 0 min) and during intraportal insulin replacement (0–300 min). Mean plasma glucose (D) and hepatic glucose production (E) during the steady-state intraportal insulin replacement period (260–300 min) after normal pulsatile (dark bar), constant (open bar), or T2DM (gray bar) intraportal insulin delivery in dogs. Systemic plasma levels of insulin (F), glucagon (G), and C-peptide (H) at baseline (−30 to 0 min) and during the intraportal insulin replacement study period (0–300 min). Data are mean ± SE. *P < 0.05 vs. pulsatile, **P < 0.05 vs. constant and pulsatile.
FIG. 2.
FIG. 2.
Intraportal 10-min insulin delivery protocol in rats (rat protocol 3). A and B: Schematic representation of portal vein insulin infusion procedure in rats. Rats were anesthetized and indwelling catheters were placed into the mesenteric vein, jugular vein, and carotid artery. Rats received a constant intravenous infusion of somatostatin (10 μg/kg/min) for 30 min to inhibit endogenous insulin release. Insulin was infused intraportally at the rate of 70 pmol/kg/min either in a typical pulsatile pattern, in a same-rate constant insulin infusion, or as an insulin infusion selected to reproduce that observed in patients with evolving diabetes (∼50% decrease in pulse mass). Sequential hepatic biopsies were obtained at 0, 2, 6, and 10 min after the start of insulin infusion. Body weight (C), plasma glucose (D), and free fatty acid (E) levels were not significantly different after the three modes of insulin delivery. Data are mean ± SE.
FIG. 3.
FIG. 3.
IRS-1 and IRS-2 activation after pulsatile, constant, or T2DM intraportal 10-min insulin delivery protocol in rats. Immunoblot (IB) analysis of liver samples biopsied from rats exposed to 10 min of intraportal insulin delivered in either typical pulsatile fashion, same-rate constant infusion, or reduced pulses (T2DM). Hepatic biopsies were obtained at 0, 2, 6, and 10 min consecutively from the same liver after the start of portal vein insulin infusion. Activation of IRS-1 was examined by immunoprecipitation (IP) with an antibody against IRS-1, and the samples were then immunoblotted with antibodies against pY (A and B) or p85 subunit of PI 3-kinase (C and D). Activation of IRS-2 was examined by immunoprecipitation with an antibody against IRS-2, and the samples were then immunoblotted with antibodies against pY (E and F) or p85 subunit of PI 3-kinase (G and H). Data are mean ± SE. *P < 0.05 vs. pulsatile.
FIG. 4.
FIG. 4.
AKT and FOXO activation after pulsatile, constant, or T2DM intraportal 10-min insulin delivery protocol in rats. Immunoblot analysis of biopsied liver samples from rats exposed to 10 min of portal vein insulin delivered in either typical pulsatile fashion, same-rate constant infusion, or reduced pulses (T2DM). Hepatic biopsies were obtained at 0, 2, 6, and 10 min consecutively from the same liver after the start of portal vein insulin infusion and immediately preserved using liquid nitrogen. Phosphorylation of AKT and FOXO was determined by immunoblotting with phosphospecific antibodies against AKT (phospho-Ser473) (A and B) and FOXO (phospho-Ser256) (C and D). Data are mean ± SE. *P < 0.05 vs. pulsatile.
FIG. 5.
FIG. 5.
Intraportal 30-min insulin delivery protocol in rats (rat protocol 4). A: Rats were anesthetized and indwelling catheters were placed into the mesenteric vein, jugular vein, and carotid artery. B: Rats received a constant infusion of somatostatin (10 μg/kg/min) for 30 min to inhibit endogenous insulin release. Insulin was infused directly into the portal vein at the rate of 70 pmol/kg/min either in a typical pulsatile pattern, in a same-rate constant insulin infusion, or as an insulin infusion selected to reproduce that observed in patients with evolving diabetes (∼50% decrease in pulse mass). A variable infusion of 50% dextrose was given intravenously to match systemic plasma glucose concentrations among the three groups. Sequential hepatic biopsies were obtained at 0 and 30 min after the start of insulin infusion protocols. Plasma glucose (C), free fatty acid (D), and mean glucose infusion rates (E) required to match plasma glucose levels among the three infusion protocols. Data are mean ± SE. *P < 0.05 vs. pulsatile.
FIG. 6.
FIG. 6.
AKT, FOXO, and Gck mRNA activation after pulsatile, constant, or T2DM intraportal 30-min insulin delivery protocol in rats. Immunoblot analysis of liver samples from rats exposed to 30 min of portal vein insulin delivery in either typical pulsatile fashion, same-rate constant infusion, or reduced pulses (T2DM). Hepatic biopsies were obtained at 0 and 30 min after the start of insulin infusion and immediately preserved using liquid nitrogen. Phosphorylation of AKT and FOXO was determined by immunoblotting with phosphospecific antibodies against AKT (phospho-Ser473) (A) and FOXO (phospho-Ser256) (B). C: FOXO nuclei exclusion after insulin delivery was examined by immunofluorescent staining for FOXO (red), perivenous hepatocyte marker glutamine synthetase (GS) (green), and nuclear marker DAPI (blue). D: Gck mRNA expression was determined by real-time PCR in liver samples from rats exposed to 30 min of portal vein insulin delivered in either typical pulsatile fashion, same-rate constant infusion, or reduced pulses (T2DM). Data are mean ± SE. *P < 0.05 vs. pulsatile, **P < 0.05 vs. min-0. (A high-quality digital representation of this figure is available in the online issue.)
FIG. 7.
FIG. 7.
Effects of antecedent pulsatile vs. constant insulin delivery on hepatic insulin signaling and gene expression in rats (rat protocol 5). A: Antecedent portal vein insulin infusion protocol. In short, all rats had a mesenteric and jugular vein infusion catheter and carotid artery sampling catheter placed surgically under anesthesia; after 6-day recovery, two random cohorts of rats (n = 4 per group) underwent a 150-min study protocol. During somatostatin inhibition of endogenous insulin secretion, one cohort of rats (pulsatile) received 120-min insulin infusion into the mesenteric vein at a basal physiological rate (7 pmol/kg/min) in 5-min pulses to recapitulate fasting insulin secretion. Another cohort of rats (constant) received the same rate (7 pmol/kg/min) 120-min insulin infusion into the mesenteric vein, but as a constant infusion. After 120-min portal vein antecedent insulin infusion, all rats received an identical 30-min bolus of insulin (70 pmol/kg/min) designed to recapitulate the postprandial rise in insulin secretion. After the 30-min bolus insulin infusion, all rats were euthanized and livers quickly removed for subsequent analysis of protein and gene expression. Dextrose (50%) was infused at variable rates throughout the 150-min study protocol to clamp plasma glucose concentrations at basal levels. B: Hepatic portal vein insulin infusion rates in rats receiving 120-min pulsatile vs. constant antecedent insulin delivery. Plasma glucose levels (C) and mean glucose infusion rates (D) during the 150-min study protocol in rats receiving 120-min antecedent pulsatile or constant insulin delivery into the hepatic portal vein. E and F: Immunoblot analysis of liver samples from rats exposed to either antecedent pulsatile or constant portal vein insulin delivery. Hepatic biopsies were obtained at the end of the 150-min study protocol and immediately preserved using liquid nitrogen. Phosphorylation of AKT was determined by immunoblotting with phosphospecific antibodies against AKT (phospho-Ser473). G: Gck mRNA expression was determined by real-time PCR. Data are mean ± SE. *P < 0.05 vs. pulsatile. (A high-quality color representation of this figure is available in the online issue.)
FIG. 8.
FIG. 8.
Progressive loss of insulin secretory pulse mass in HIP rats is associated with the reduction in Gck mRNA expression (rat protocol 6). The mean fasting plasma glucose (A), β-cell mass (B), insulin secretory pulse mass (C), and hepatic Gck mRNA expression (D) in wild-type and HIP rats aged 2, 7, and 12 months. Data are mean ± SEM. *P < 0.05 for HIP vs. wild type.

Comment in

References

    1. DeFronzo RA, Hendler R, Simonson D. Insulin resistance is a prominent feature of insulin-dependent diabetes. Diabetes 1982;31:795–801 - PubMed
    1. Rizza RA. Pathogenesis of fasting and postprandial hyperglycemia in type 2 diabetes: implications for therapy. Diabetes 2010;59:2697–2707 - PMC - PubMed
    1. Yki-Järvinen H, Koivisto VA. Natural course of insulin resistance in type I diabetes. N Engl J Med 1986;315:224–230 - PubMed
    1. Bock G, Chittilapilly E, Basu R, et al. Contribution of hepatic and extrahepatic insulin resistance to the pathogenesis of impaired fasting glucose: role of increased rates of gluconeogenesis. Diabetes 2007;56:1703–1711 - PubMed
    1. Bock G, Dalla Man C, Campioni M, et al. Pathogenesis of pre-diabetes: mechanisms of fasting and postprandial hyperglycemia in people with impaired fasting glucose and/or impaired glucose tolerance. Diabetes 2006;55:3536–3549 - PubMed

Publication types

MeSH terms