

Coenzyme depletion by members of the aerolysin family of pore-forming toxins leads to diminished ATP levels and cell death
- PMID: 22688384
- PMCID: PMC3759351
- DOI: 10.1039/c2mb25142f
Coenzyme depletion by members of the aerolysin family of pore-forming toxins leads to diminished ATP levels and cell death
Abstract
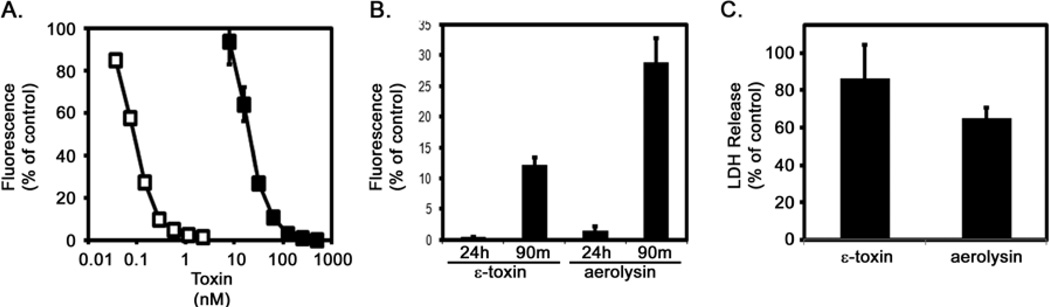
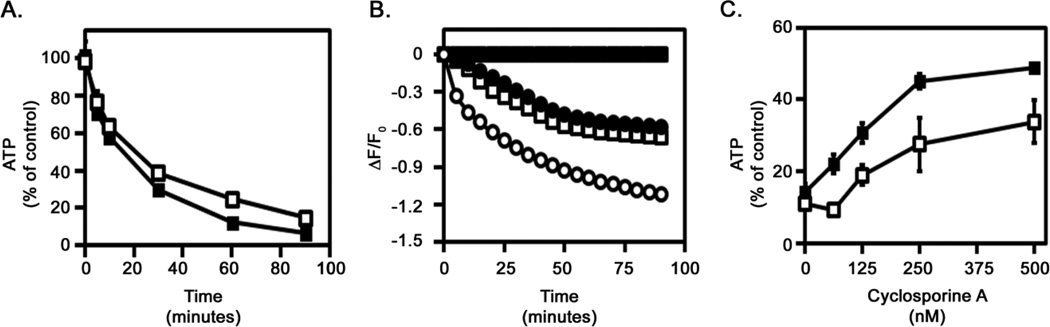
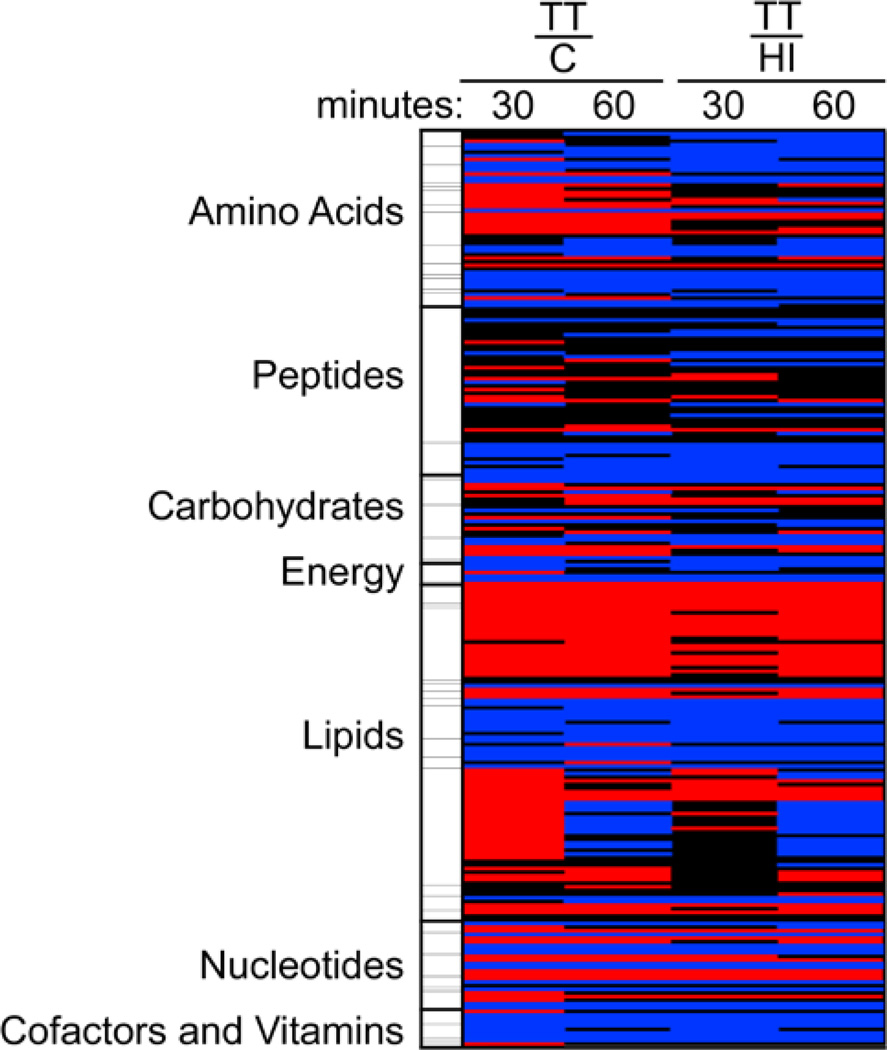
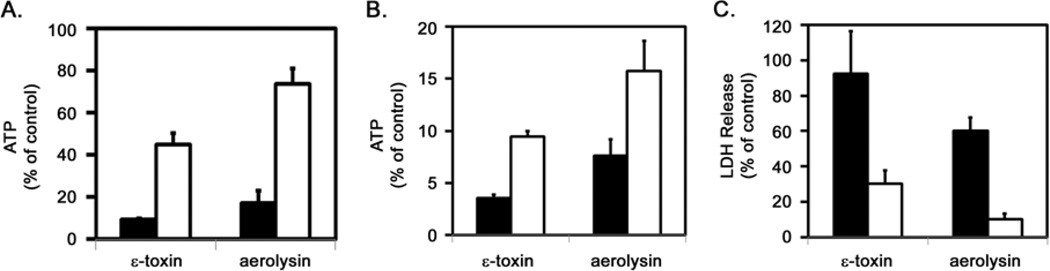
Recent studies demonstrated that a variety of bacterial pore-forming toxins induce cell death through a process of programmed necrosis characterized by the rapid depletion of cellular ATP. However, events leading to the necrosis and depletion of ATP are not thoroughly understood. We demonstrate that ATP-depletion induced by two pore-forming toxins, the Clostridium perfringens epsilon-toxin and the Aeromonas hydrophila aerolysin toxin, is associated with decreased mitochondrial membrane potential and opening of the mitochondrial permeability transition pore. To gain further insight into the toxin-induced metabolic changes contributing to necrosis and depletion of ATP, we analyzed the biochemical profiles of 251 distinct compounds by GC/MS or LC/MS/MS following exposure of a human kidney cell line to the epsilon-toxin. As expected, numerous biochemicals were seen to increase or decrease in response to epsilon-toxin. However, the pattern of these changes was consistent with the toxin-induced disruption of major energy-producing pathways in the cell including disruptions to the beta-oxidation of lipids. In particular, treatment with epsilon-toxin led to decreased levels of key coenzymes required for energy production including carnitine, NAD (and NADH), and coenzyme A. Independent biochemical assays confirmed that epsilon-toxin and aerolysin induced the rapid decrease of these coenzymes or their synthetic precursors. Incubation of cells with NADH or carnitine-enriched medium helped protect cells from toxin-induced ATP depletion and cell death. Collectively, these results demonstrate that members of the aerolysin family of pore-forming toxins lead to decreased levels of essential coenzymes required for energy production. The resulting loss of energy substrates is expected to contribute to dissipation of the mitochondrial membrane potential, opening of the mitochondrial permeability transition pore, and ultimately cell death.
Figures
Similar articles
-
Pore-forming epsilon toxin causes membrane permeabilization and rapid ATP depletion-mediated cell death in renal collecting duct cells.Am J Physiol Renal Physiol. 2007 Sep;293(3):F927-37. doi: 10.1152/ajprenal.00199.2007. Epub 2007 Jun 13. Am J Physiol Renal Physiol. 2007. PMID: 17567938
-
Aerolysin induces G-protein activation and Ca2+ release from intracellular stores in human granulocytes.J Biol Chem. 1998 Jul 17;273(29):18122-9. doi: 10.1074/jbc.273.29.18122. J Biol Chem. 1998. PMID: 9660770
-
Clostridium perfringens epsilon-toxin shows structural similarity to the pore-forming toxin aerolysin.Nat Struct Mol Biol. 2004 Aug;11(8):797-8. doi: 10.1038/nsmb804. Epub 2004 Jul 18. Nat Struct Mol Biol. 2004. PMID: 15258571
-
Pore-forming activity of clostridial binary toxins.Biochim Biophys Acta. 2016 Mar;1858(3):512-25. doi: 10.1016/j.bbamem.2015.08.006. Epub 2015 Aug 14. Biochim Biophys Acta. 2016. PMID: 26278641 Review.
-
Branching out the aerolysin, ETX/MTX-2 and Toxin_10 family of pore forming proteins.J Invertebr Pathol. 2021 Nov;186:107570. doi: 10.1016/j.jip.2021.107570. Epub 2021 Mar 26. J Invertebr Pathol. 2021. PMID: 33775676 Review.
Cited by
-
Mechanisms protecting host cells against bacterial pore-forming toxins.Cell Mol Life Sci. 2019 Apr;76(7):1319-1339. doi: 10.1007/s00018-018-2992-8. Epub 2018 Dec 27. Cell Mol Life Sci. 2019. PMID: 30591958 Free PMC article. Review.
-
Overview of Bacterial Protein Toxins from Pathogenic Bacteria: Mode of Action and Insights into Evolution.Toxins (Basel). 2024 Apr 8;16(4):182. doi: 10.3390/toxins16040182. Toxins (Basel). 2024. PMID: 38668607 Free PMC article. Review.
-
Epsilon Toxin from Clostridium perfringens Causes Inhibition of Potassium inward Rectifier (Kir) Channels in Oligodendrocytes.Toxins (Basel). 2020 Jan 6;12(1):36. doi: 10.3390/toxins12010036. Toxins (Basel). 2020. PMID: 31935961 Free PMC article.
-
Cell death analysis of recombinant mature epsilon toxin on the kidney cell line.Iran J Microbiol. 2021 Dec;13(6):832-838. doi: 10.18502/ijm.v13i6.8088. Iran J Microbiol. 2021. PMID: 35222862 Free PMC article.
-
Site-specific chemoenzymatic labeling of aerolysin enables the identification of new aerolysin receptors.PLoS One. 2014 Oct 2;9(10):e109883. doi: 10.1371/journal.pone.0109883. eCollection 2014. PLoS One. 2014. PMID: 25275512 Free PMC article.
References
-
- The Comprehensive Sourcebook of Bacterial Protein Toxins. Third Edition edn. Amsterdam: Elsevier; 2006.
-
- Mancheno JM, Tateno H, Goldstein IJ, Martinez-Ripoll M, Hermoso JA. J. Biol. Chem. 2005;280:17251–17259. - PubMed
-
- Mancheno JM, Tateno H, Sher D, Goldstein IJ. Adv. Exp. Med. Biol. 2010;677:67–80. - PubMed
-
- Cole AR, Gibert M, Popoff M, Moss DS, Titball RW, Basak AK. Nat Struct Mol Biol. 2004;11:797–798. - PubMed
Publication types
MeSH terms
Substances
Grants and funding
LinkOut - more resources
Full Text Sources
Research Materials
Miscellaneous