

Three-dimensional optical coherence tomography for optical biopsy of lymph nodes and assessment of metastatic disease
- PMID: 22688663
- PMCID: PMC3985569
- DOI: 10.1245/s10434-012-2434-z
Three-dimensional optical coherence tomography for optical biopsy of lymph nodes and assessment of metastatic disease
Abstract
Background: Numerous techniques have been developed for localizing lymph nodes before surgical resection and for their histological assessment. Nondestructive high-resolution transcapsule optical imaging of lymph nodes offers the potential for in situ assessment of metastatic involvement, potentially during surgical procedures.
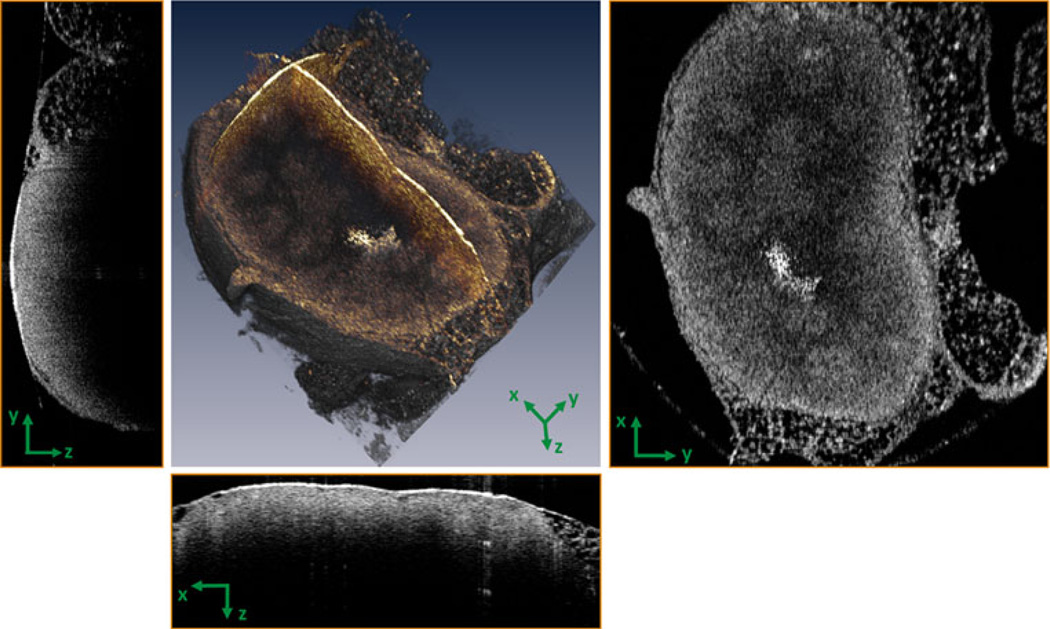
Methods: Three-dimensional optical coherence tomography (3-D OCT) was used for imaging and assessing resected popliteal lymph nodes from a preclinical rat metastatic tumor model over a 9-day time-course study after tumor induction. The spectral-domain OCT system utilized a center wavelength of 800 nm, provided axial and transverse resolutions of 3 and 12 μm, respectively, and performed imaging at 10,000 axial scans per second.
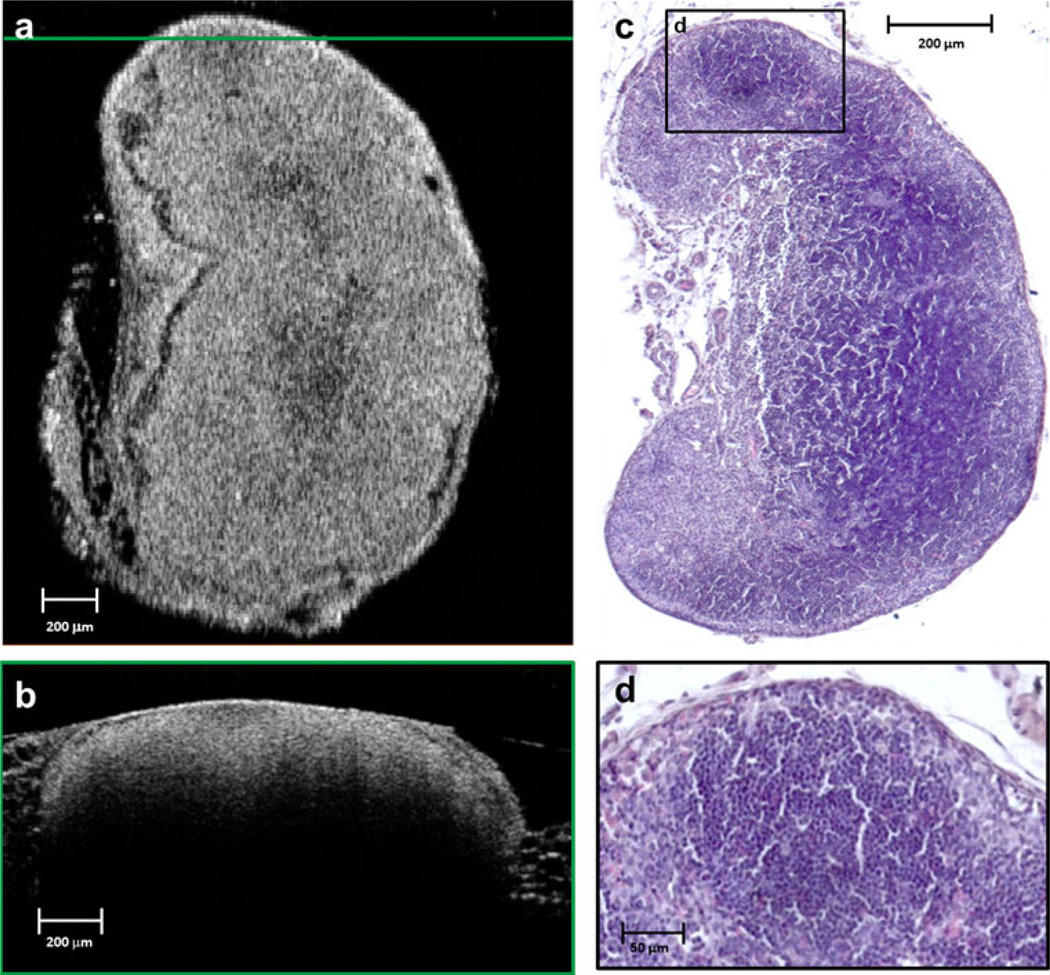
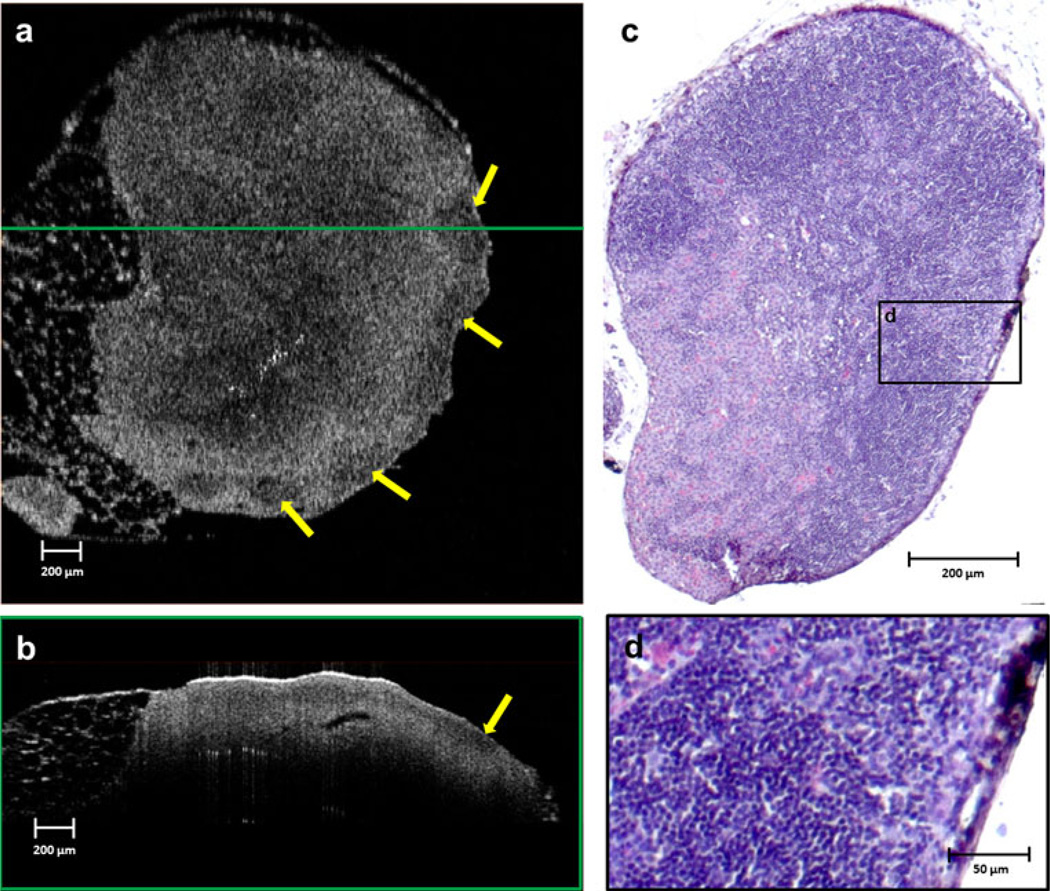
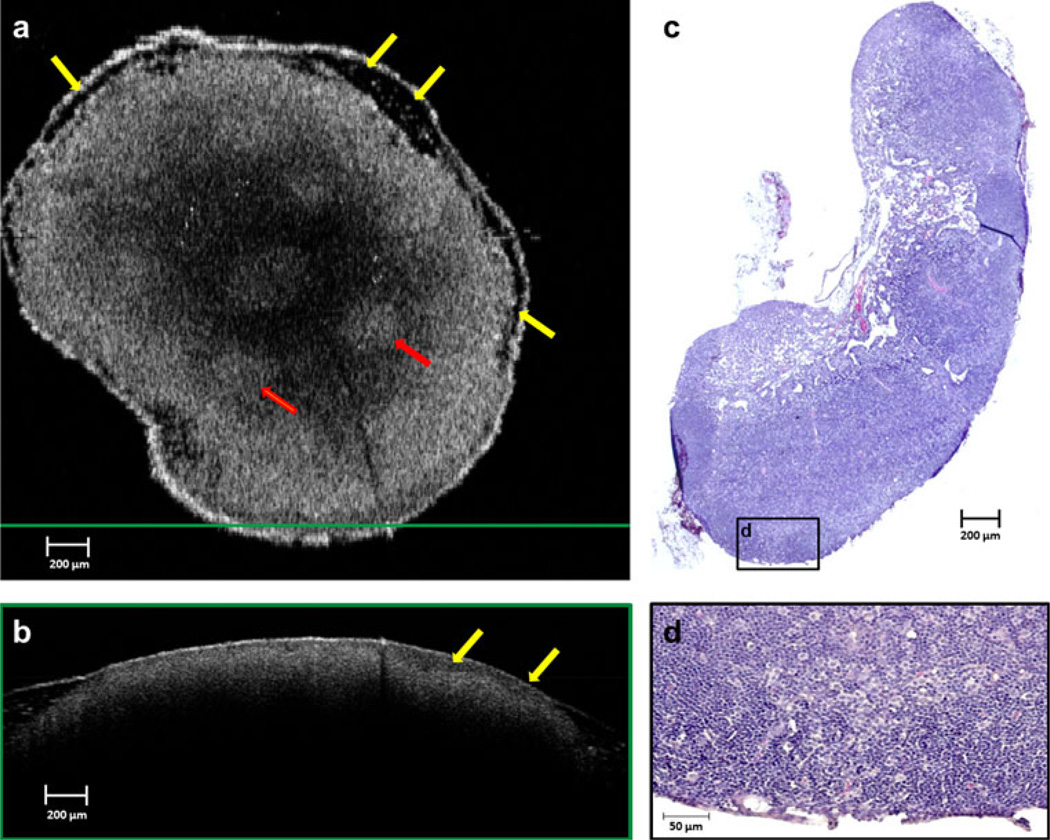
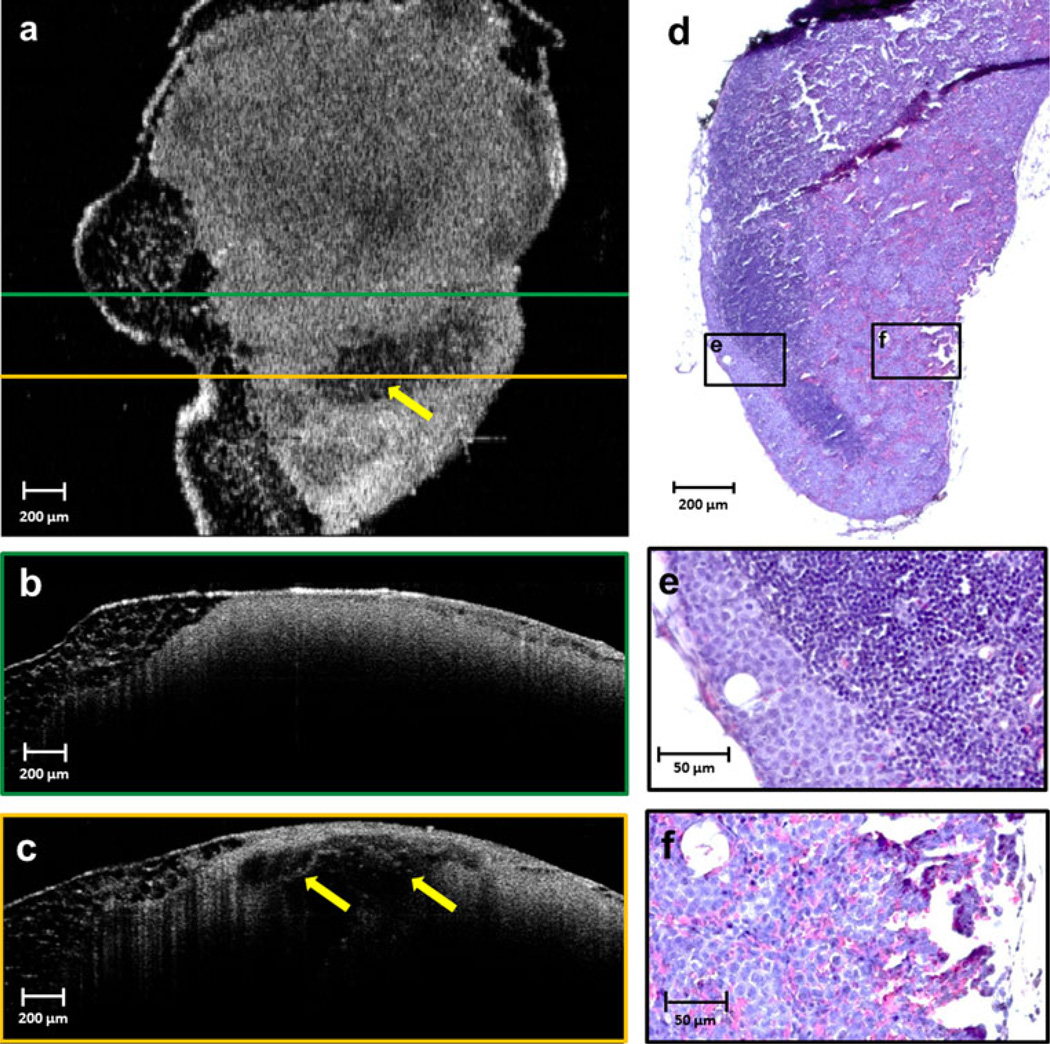
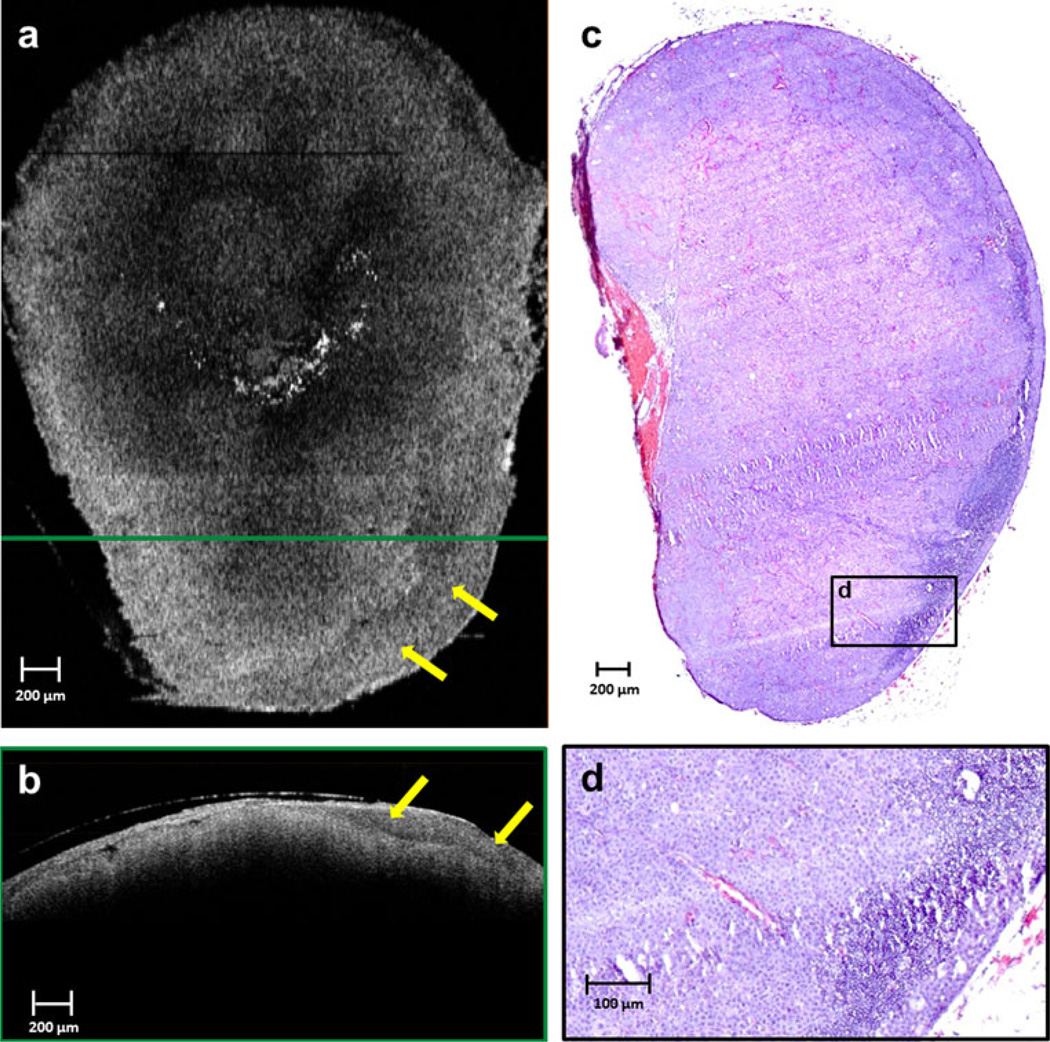
Results: OCT is capable of providing high-resolution label-free images of intact lymph node microstructure based on intrinsic optical scattering properties with penetration depths of ~1-2 mm. The results demonstrate that OCT is capable of differentiating normal, reactive, and metastatic lymph nodes based on microstructural changes. The optical scattering and structural changes revealed by OCT from day 3 to day 9 after the injection of tumor cells into the lymphatic system correlate with inflammatory and immunological changes observed in the capsule, precortical regions, follicles, and germination centers found during histopathology.
Conclusions: We report for the first time a longitudinal study of 3-D transcapsule OCT imaging of intact lymph nodes demonstrating microstructural changes during metastatic infiltration. These results demonstrate the potential of OCT as a technique for intraoperative, real-time in situ 3-D optical biopsy of lymph nodes for the intraoperative staging of cancer.
Figures
Similar articles
-
Intraoperative optical coherence tomography for assessing human lymph nodes for metastatic cancer.BMC Cancer. 2016 Feb 23;16:144. doi: 10.1186/s12885-016-2194-4. BMC Cancer. 2016. PMID: 26907742 Free PMC article.
-
Optical coherence tomography: the intraoperative assessment of lymph nodes in breast cancer.IEEE Eng Med Biol Mag. 2010 Mar-Apr;29(2):63-70. doi: 10.1109/MEMB.2009.935722. IEEE Eng Med Biol Mag. 2010. PMID: 20659842 Free PMC article.
-
Investigation of optical coherence micro-elastography as a method to visualize micro-architecture in human axillary lymph nodes.BMC Cancer. 2016 Nov 9;16(1):874. doi: 10.1186/s12885-016-2911-z. BMC Cancer. 2016. PMID: 27829404 Free PMC article.
-
Optical techniques for the intraoperative assessment of nodal status.Future Oncol. 2013 Nov;9(11):1741-55. doi: 10.2217/fon.13.125. Future Oncol. 2013. PMID: 24156334 Review.
-
[Methodological advancements. Ultrahigh-resolution OCT].Ophthalmologe. 2004 Aug;101(8):804-12. doi: 10.1007/s00347-004-1057-6. Ophthalmologe. 2004. PMID: 15459789 Review. German.
Cited by
-
Applicability, usability, and limitations of murine embryonic imaging with optical coherence tomography and optical projection tomography.Biomed Opt Express. 2016 May 19;7(6):2295-310. doi: 10.1364/BOE.7.002295. eCollection 2016 Jun 1. Biomed Opt Express. 2016. PMID: 27375945 Free PMC article.
-
Imaging the lymphatic system.Microvasc Res. 2014 Nov;96:55-63. doi: 10.1016/j.mvr.2014.06.006. Epub 2014 Jun 21. Microvasc Res. 2014. PMID: 24956510 Free PMC article. Review.
-
SEGMENTATION AND CORRELATION OF OPTICAL COHERENCE TOMOGRAPHY AND X-RAY IMAGES FOR BREAST CANCER DIAGNOSTICS.J Innov Opt Health Sci. 2013 Apr;6(2):1350015. doi: 10.1142/S1793545813500156. J Innov Opt Health Sci. 2013. PMID: 24533035 Free PMC article.
-
Colposcopic imaging using visible-light optical coherence tomography.J Biomed Opt. 2017 May 1;22(5):56003. doi: 10.1117/1.JBO.22.5.056003. J Biomed Opt. 2017. PMID: 28492851 Free PMC article.
-
Intraoperative optical coherence tomography for assessing human lymph nodes for metastatic cancer.BMC Cancer. 2016 Feb 23;16:144. doi: 10.1186/s12885-016-2194-4. BMC Cancer. 2016. PMID: 26907742 Free PMC article.
References
-
- Willard-Mack CL. Normal structure, function, and histology of lymph nodes. Toxicol Pathol. 2006;34:409–424. - PubMed
-
- Torabi M, Aquino SL, Harisinghani MG. Current concepts in lymph node imaging. J Nucl Med. 2004;45:1509–1518. - PubMed
-
- Gadd M. Sentinel lymph node biopsy for staging early breast cancer: minimizing the trade-off by maximizing the accuracy. Ann Oncol. 2009;20:973–975. - PubMed
-
- Quan ML, McCready D. The evolution of lymph node assessment in breast cancer. J Surg Oncol. 2009;99:194–198. - PubMed
-
- Szabo BK, Aspelin P, Kristoffersen WM, Tot T, Bone B. Invasive breast cancer: correlation of dynamic mr features with prognostic factors. Eur Radiol. 2003;13:2425–2435. - PubMed
Publication types
MeSH terms
Grants and funding
LinkOut - more resources
Full Text Sources
