

Stabilization of the murine gut microbiome following weaning
- PMID: 22688727
- PMCID: PMC3463496
- DOI: 10.4161/gmic.21008
Stabilization of the murine gut microbiome following weaning
Abstract
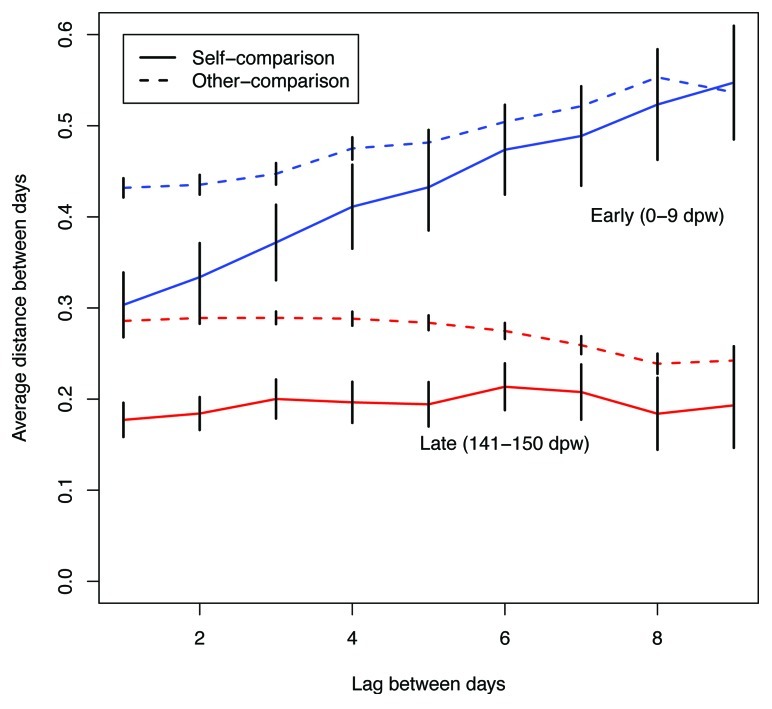
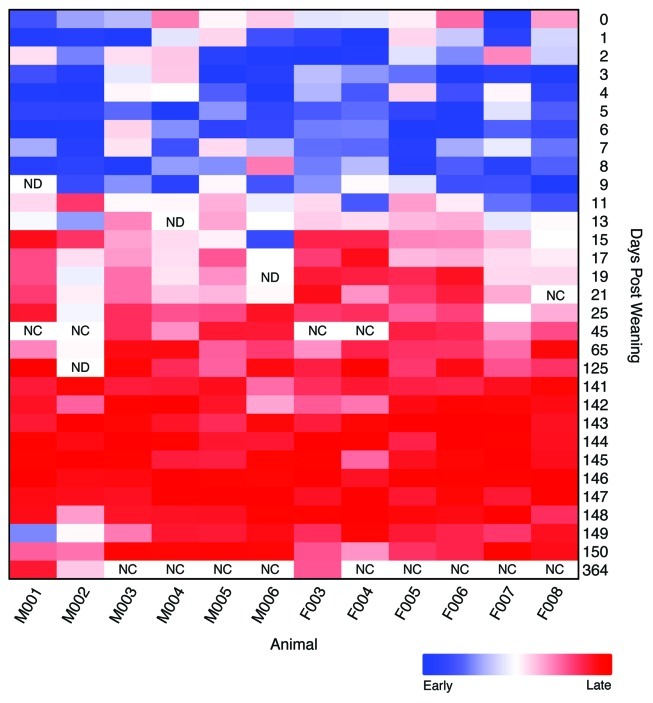
Ecologists hypothesize that community structure and stability affect productivity, sensitivity to invasion and extinction, and resilience and resistance to perturbations. Viewed in the context of the gut microbiome, the stability of the gut community is important for understanding the effects of antibiotics, diet change and other perturbations on host health and colonization resistance. Here we describe the dynamics of a self-contained community, the murine gut microbiome. Using 16S rRNA gene sequencing of fecal samples collected daily from individual mice, we characterized the community membership and structure to determine whether there were significant changes in the gut community during the first year of life. Based on analysis of molecular variance, we observed two community states. The first was observed in the 10 days following weaning and the second was observed by 15 days following weaning. Interestingly, these two states had the same bacterial populations, but those populations had different relative abundances in the two states. By calculating the root mean squared distances between samples collected in the early and late states for each mouse, we observed that the late state was more stable than the early state. This increase in stability was not correlated with increased taxonomic richness, taxonomic diversity, or phylogenetic diversity. In the absence of an experimentally induced perturbation, the second community state was relatively constant through 364 days post weaning. These results suggest a high degree of stability in the microbiome once the community reached the second state.
Figures
References
Publication types
MeSH terms
Substances
Grants and funding
- U54 HG004973/HG/NHGRI NIH HHS/United States
- U19 AI090871/AI/NIAID NIH HHS/United States
- R01 HG005975/HG/NHGRI NIH HHS/United States
- U54HG004973/HG/NHGRI NIH HHS/United States
- P30 DK034933/DK/NIDDK NIH HHS/United States
- R01HG005975/HG/NHGRI NIH HHS/United States
- U19AI090871/AI/NIAID NIH HHS/United States
- T32 AI007528/AI/NIAID NIH HHS/United States
- P30DK034933/DK/NIDDK NIH HHS/United States
- R01 GM099514/GM/NIGMS NIH HHS/United States
- R01 DK070875/DK/NIDDK NIH HHS/United States
- R01DK070875/DK/NIDDK NIH HHS/United States
LinkOut - more resources
Full Text Sources
Other Literature Sources