. 2013 Apr 25;32(17):2200-10.
doi: 10.1038/onc.2012.234. Epub 2012 Jun 11.

Loss of PTEN induces microtentacles through PI3K-independent activation of cofilin

Affiliations

Loss of PTEN induces microtentacles through PI3K-independent activation of cofilin

M I Vitolo et al. Oncogene. .

Abstract

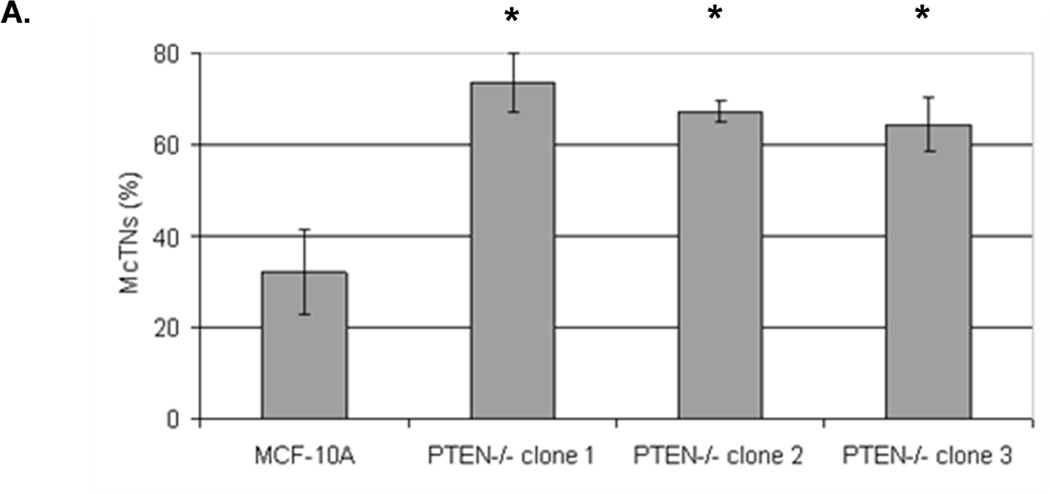
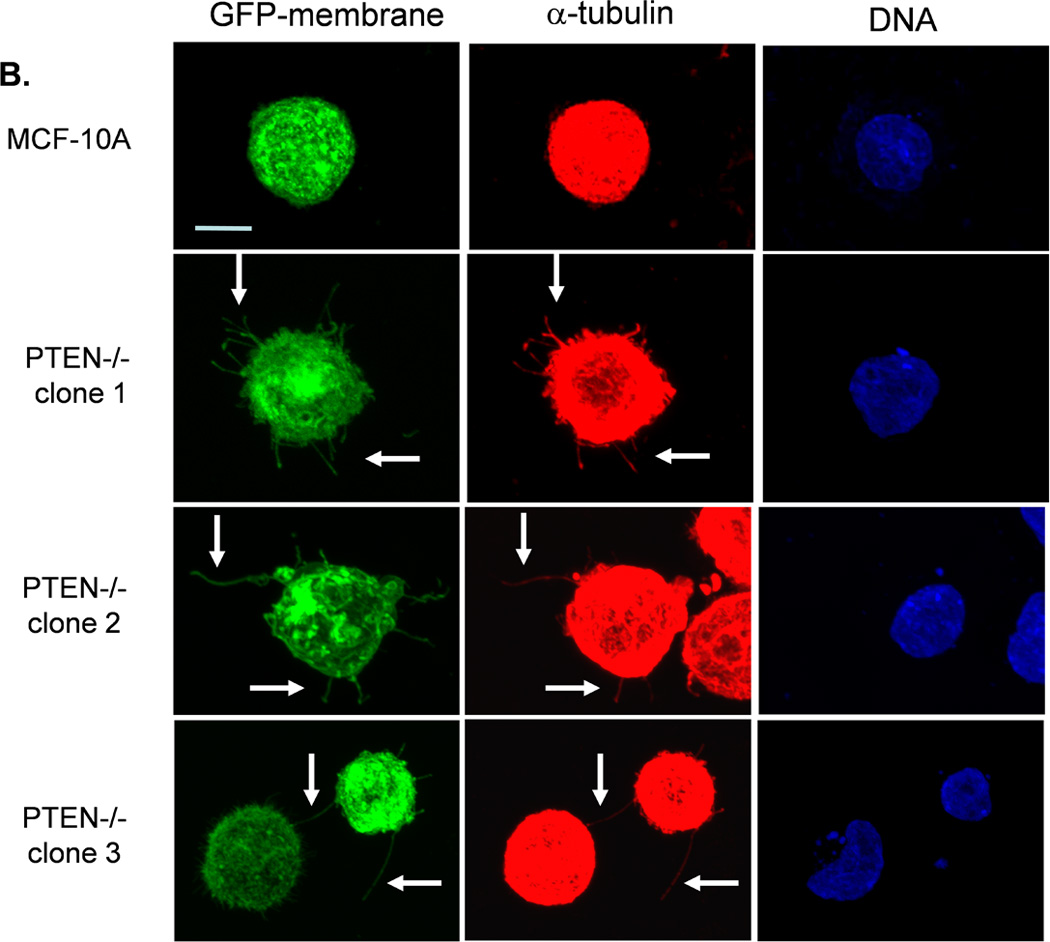
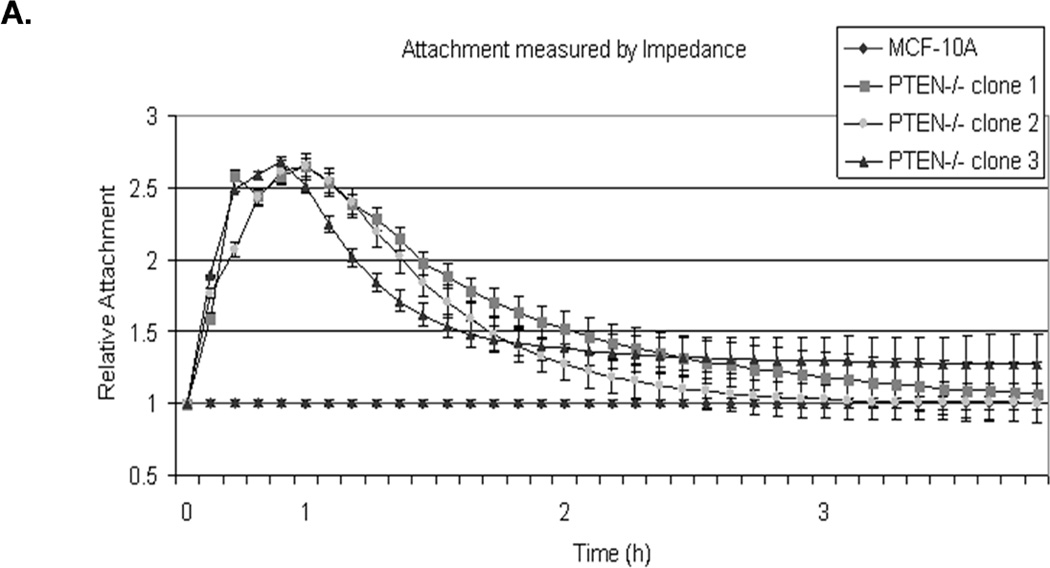
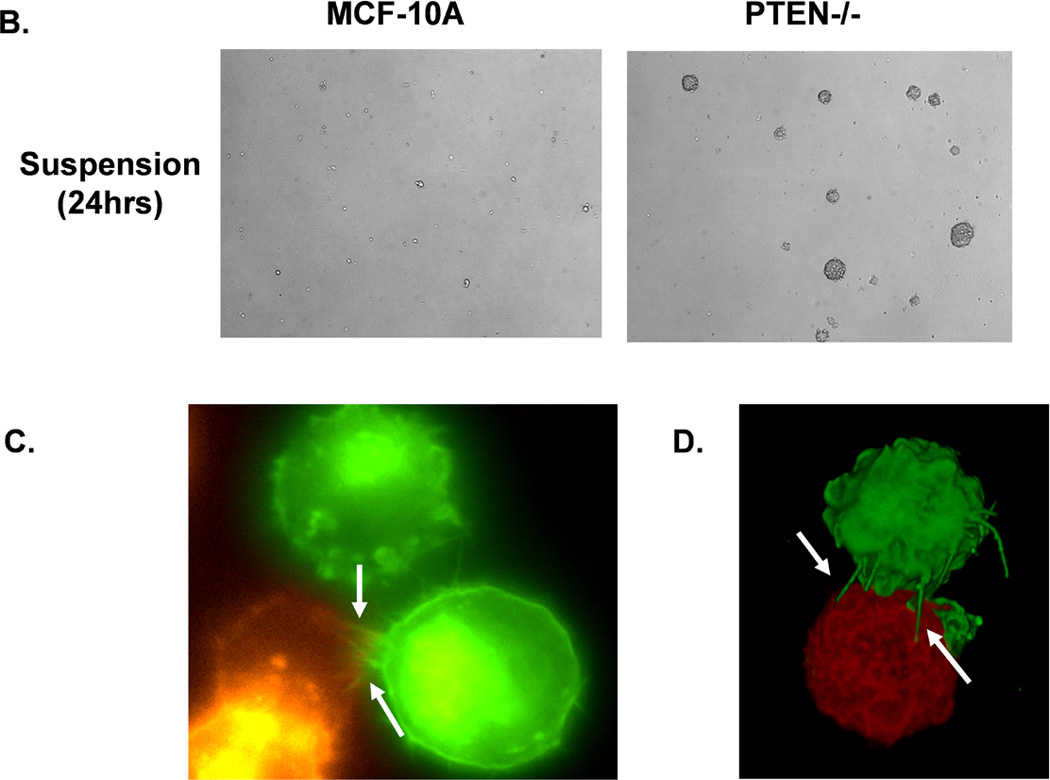
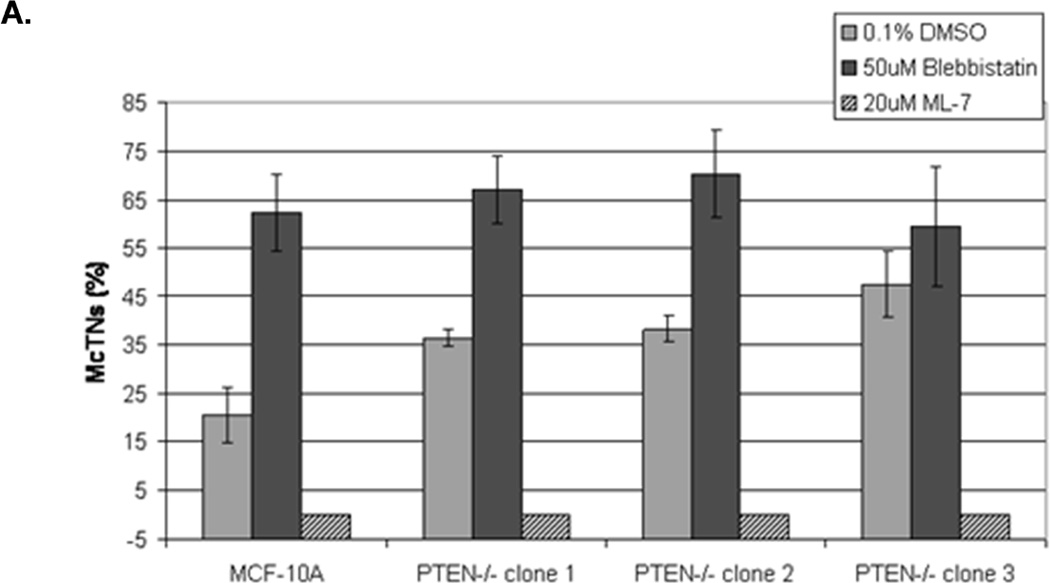
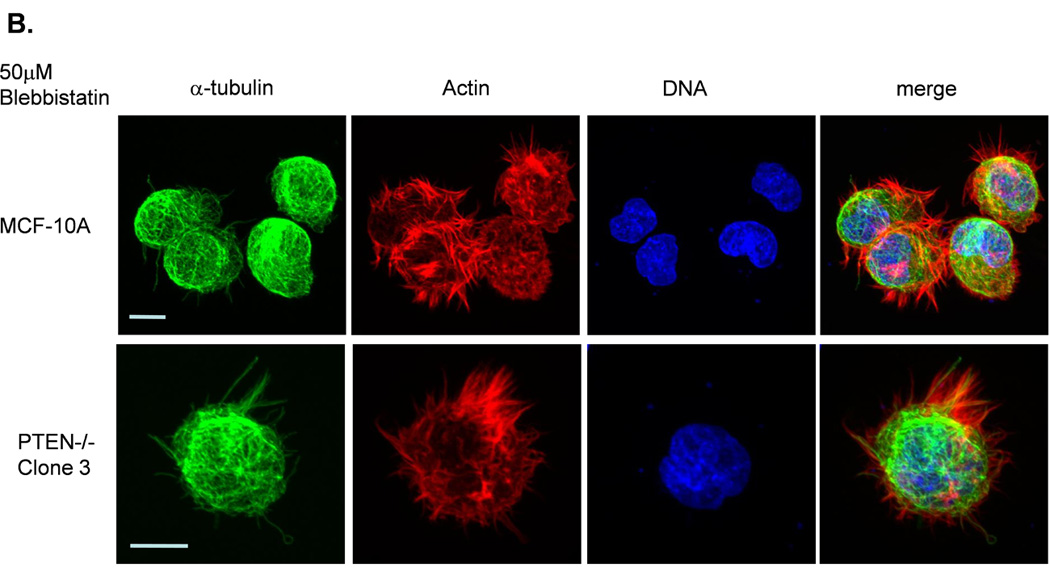
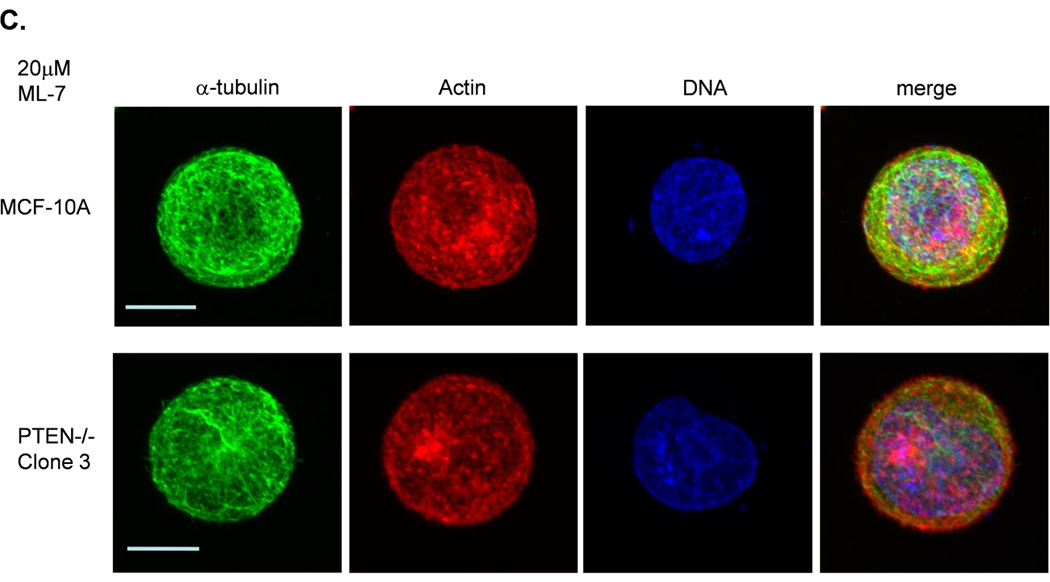
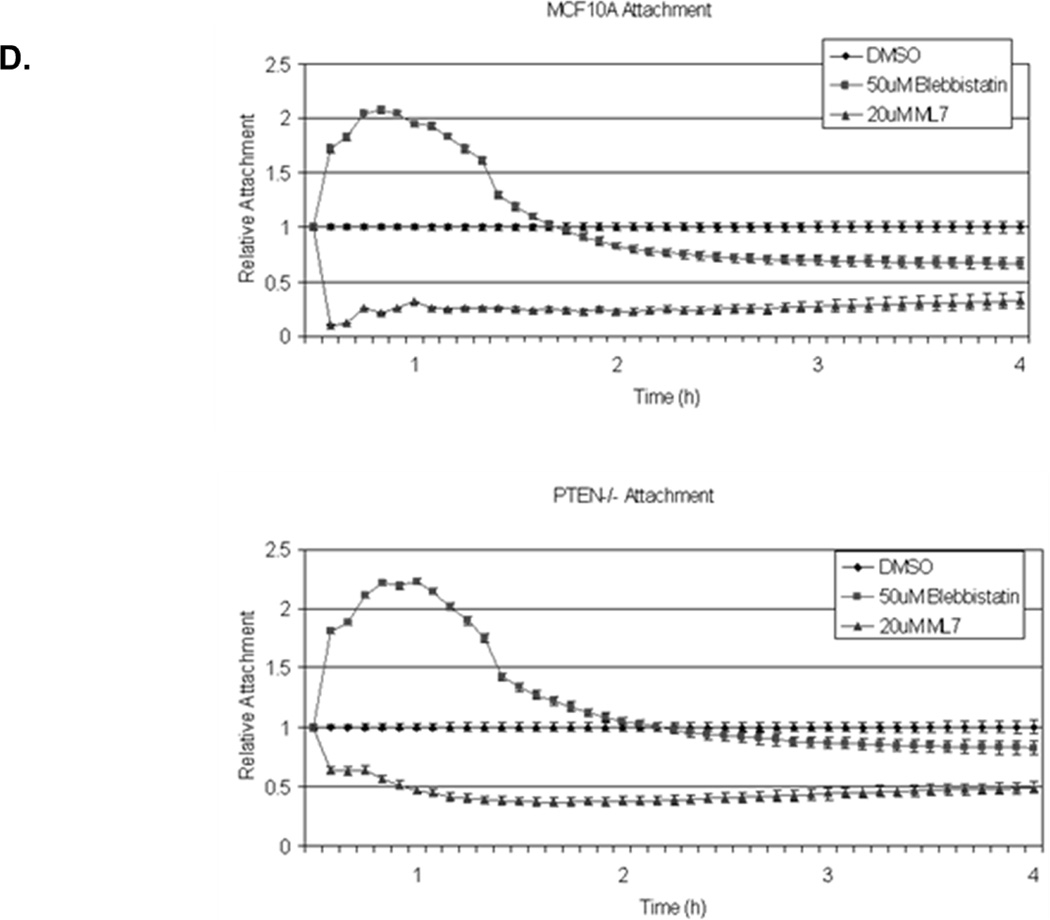
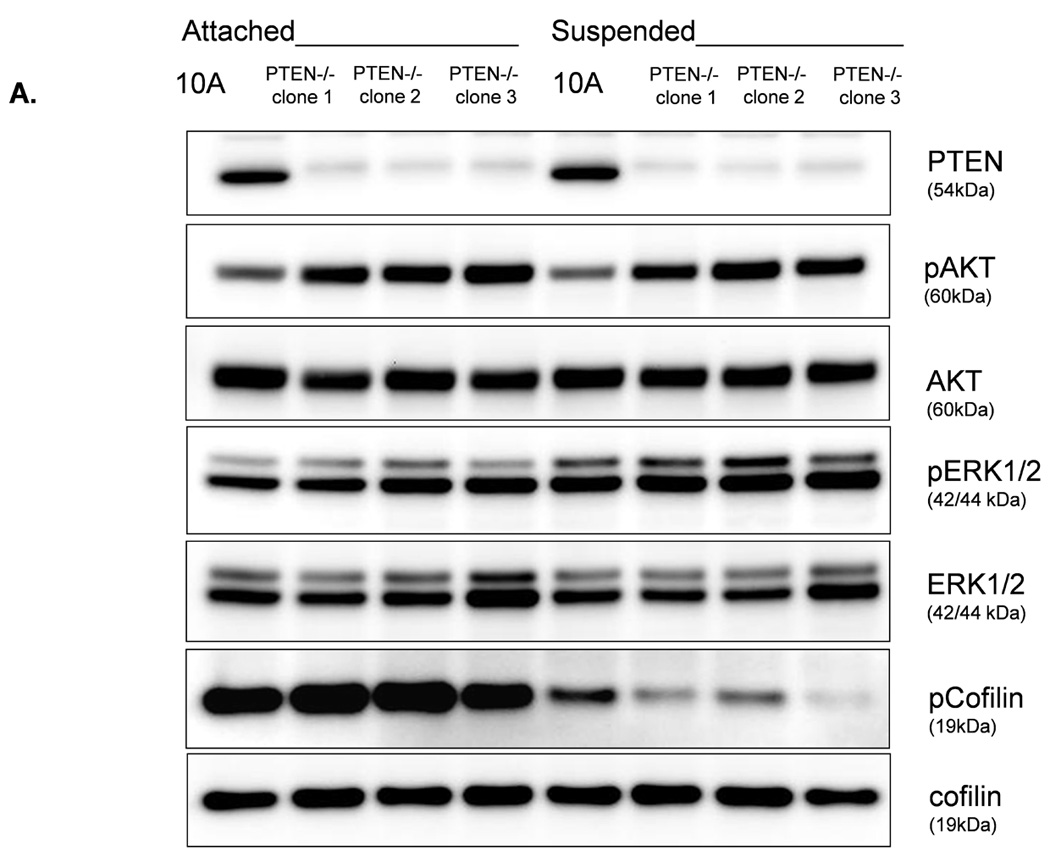
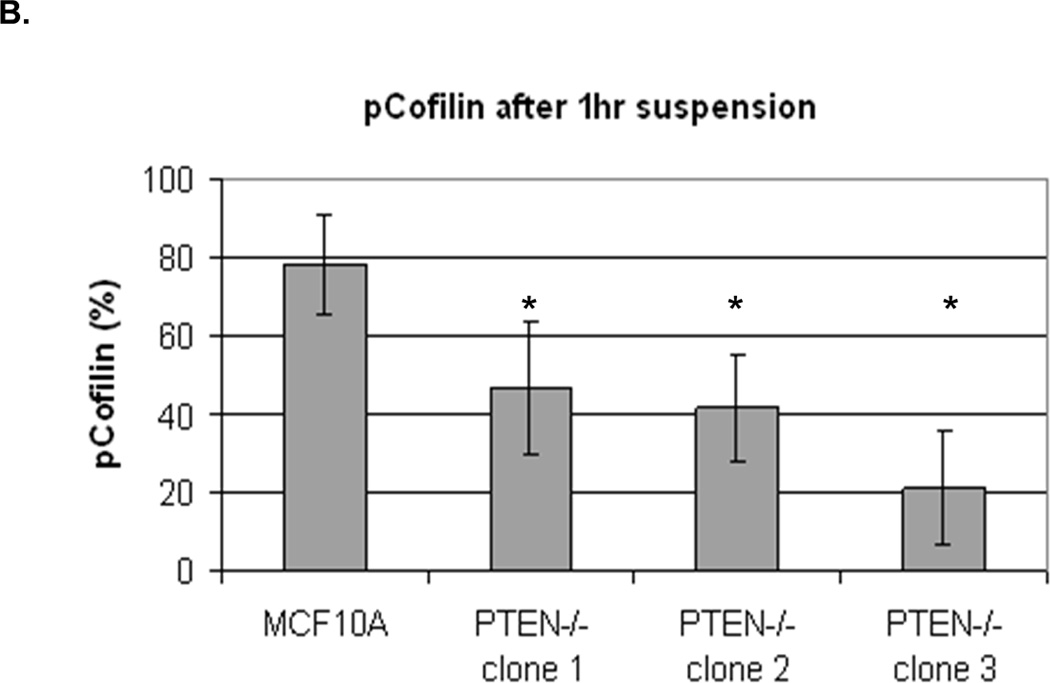
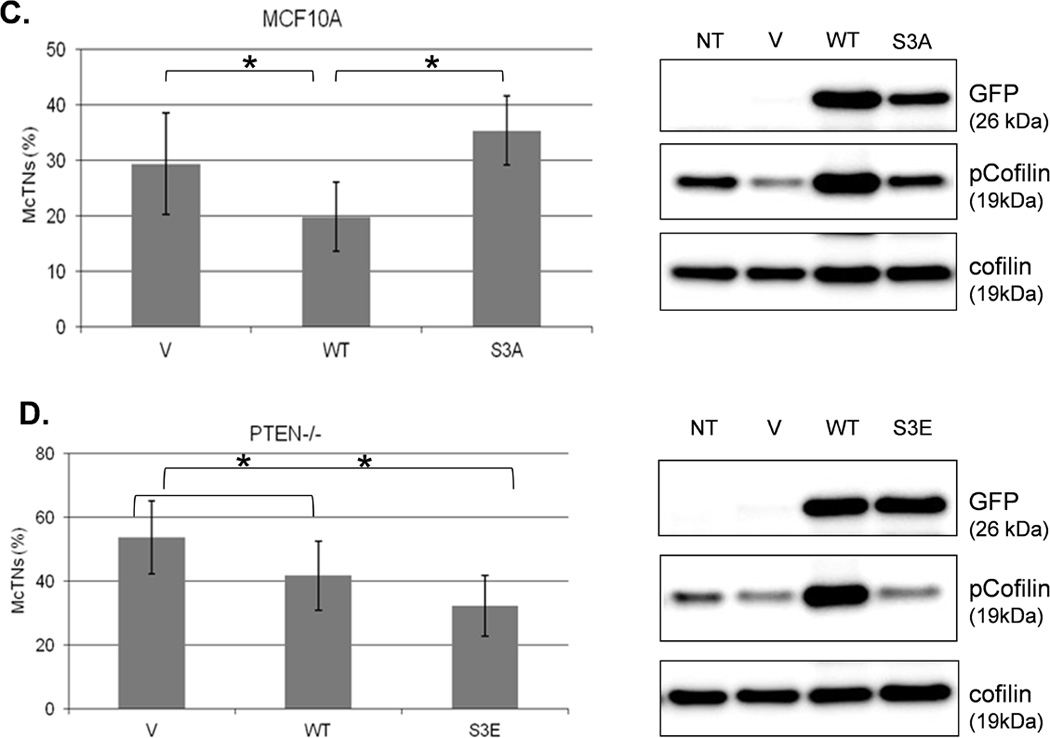
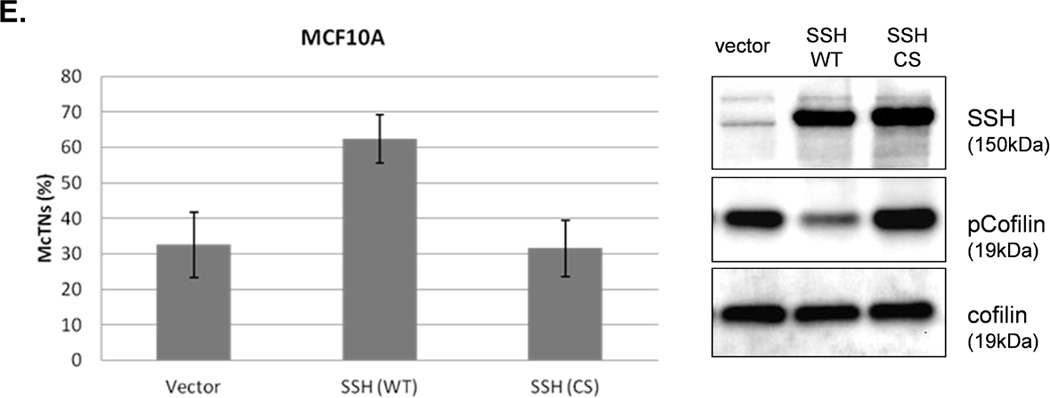
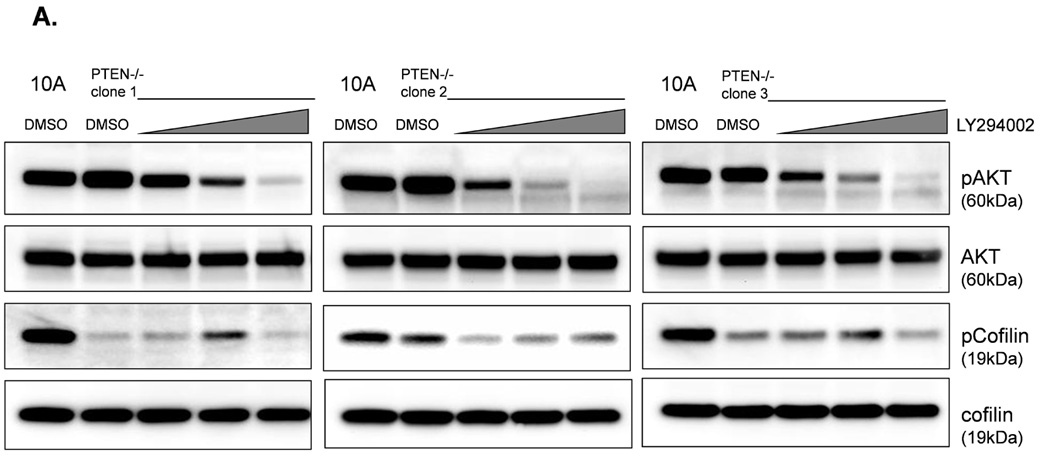
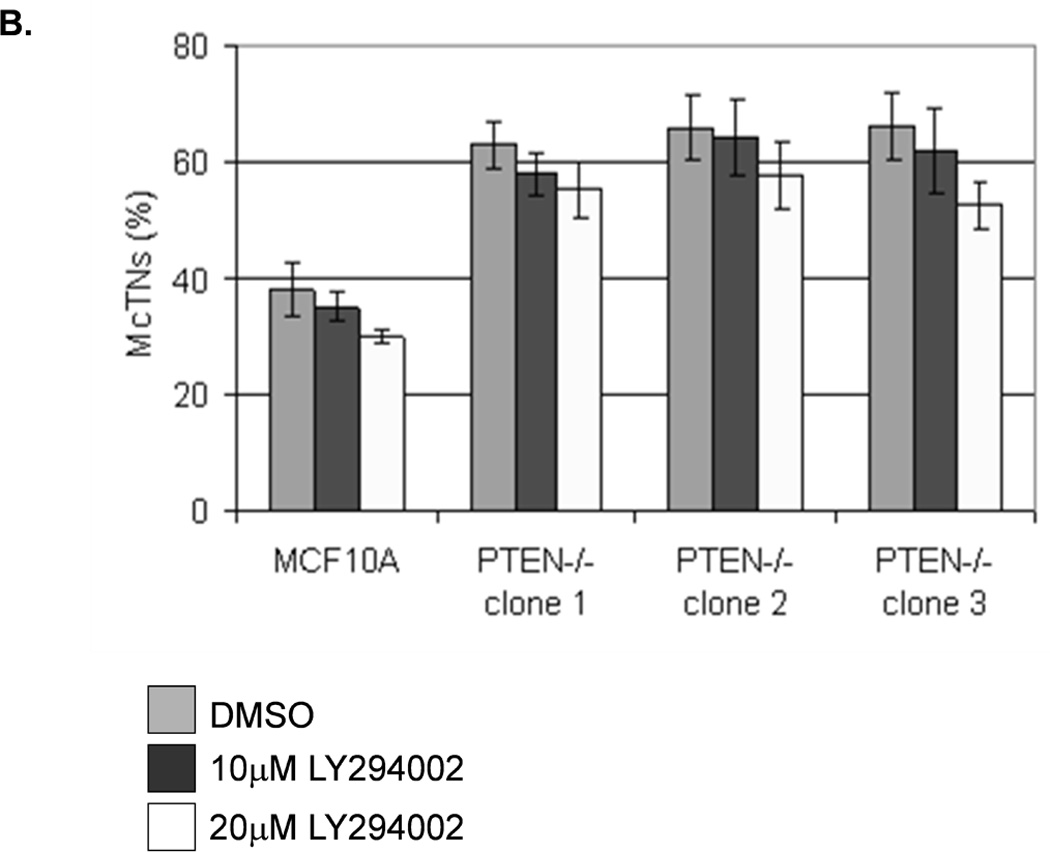
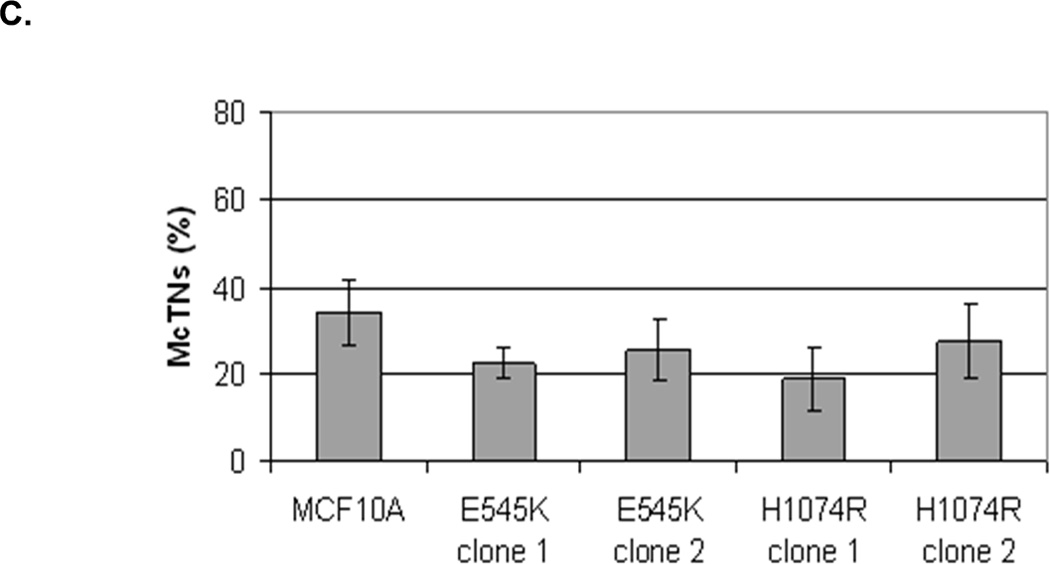
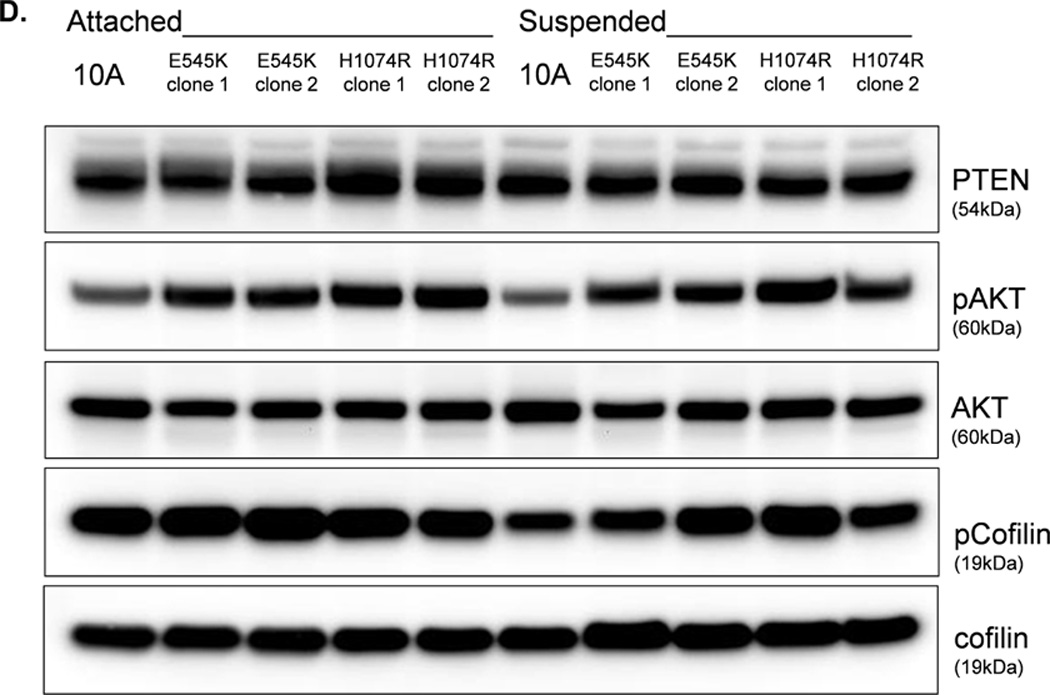
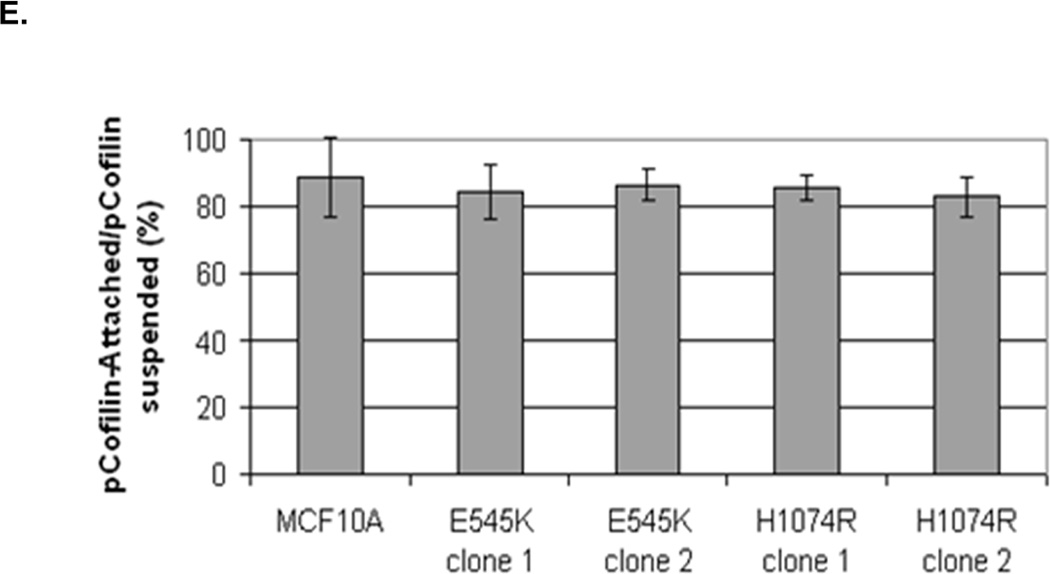
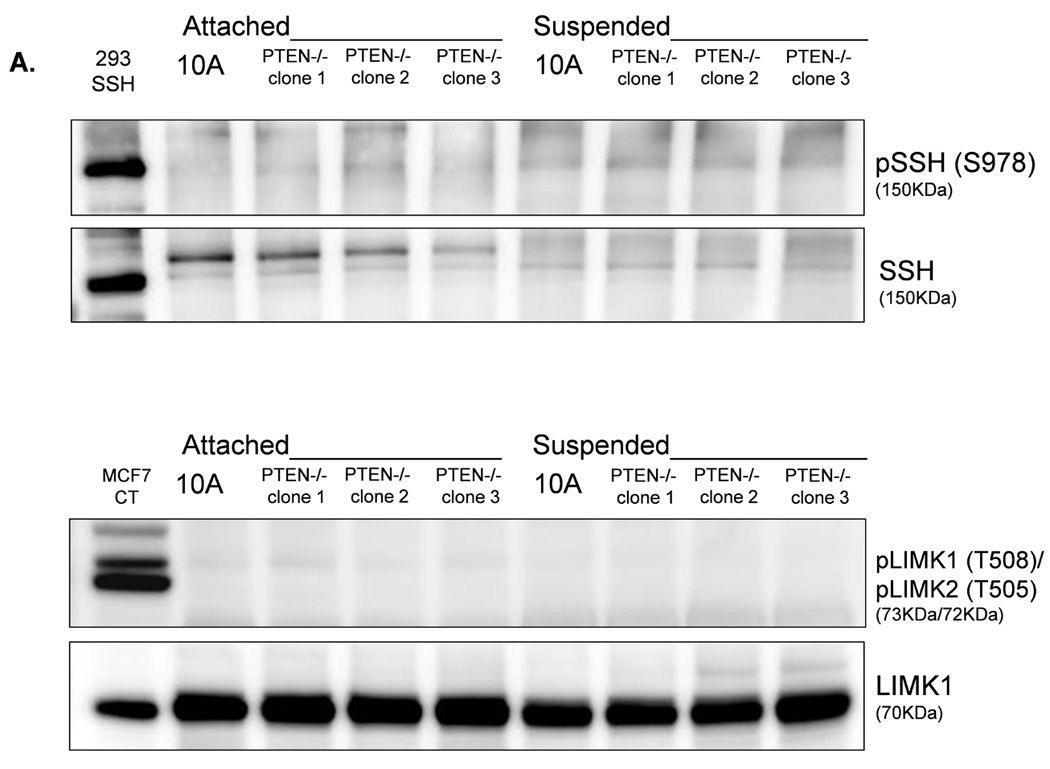
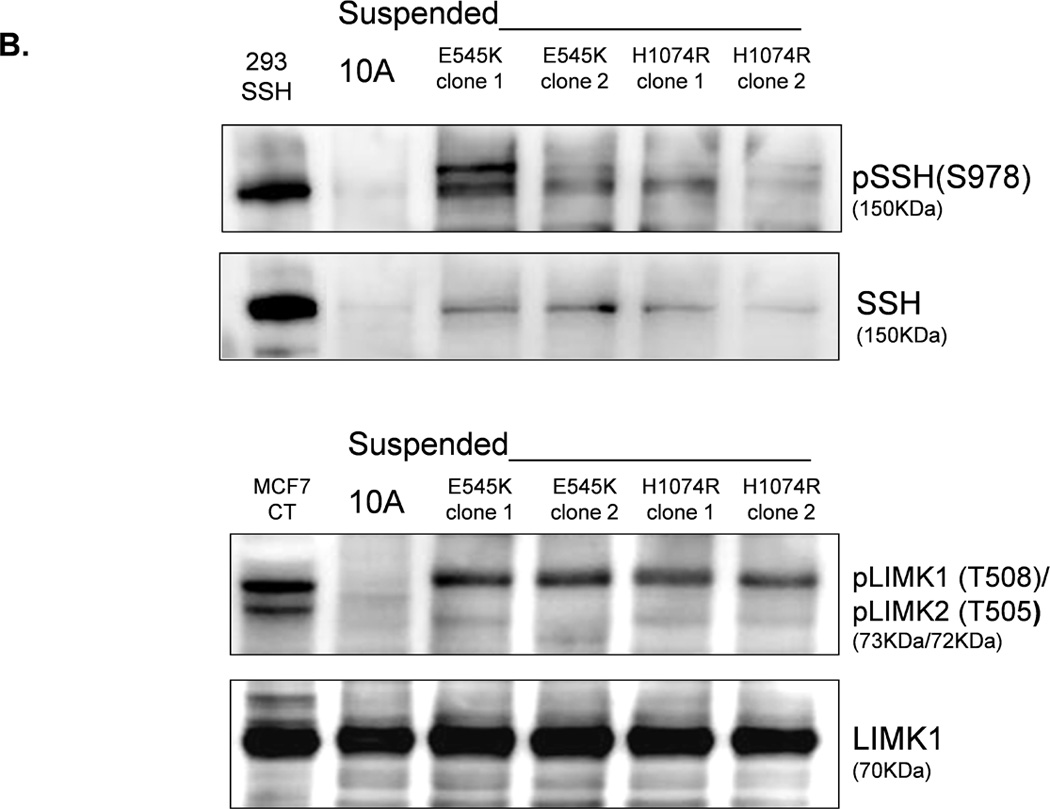
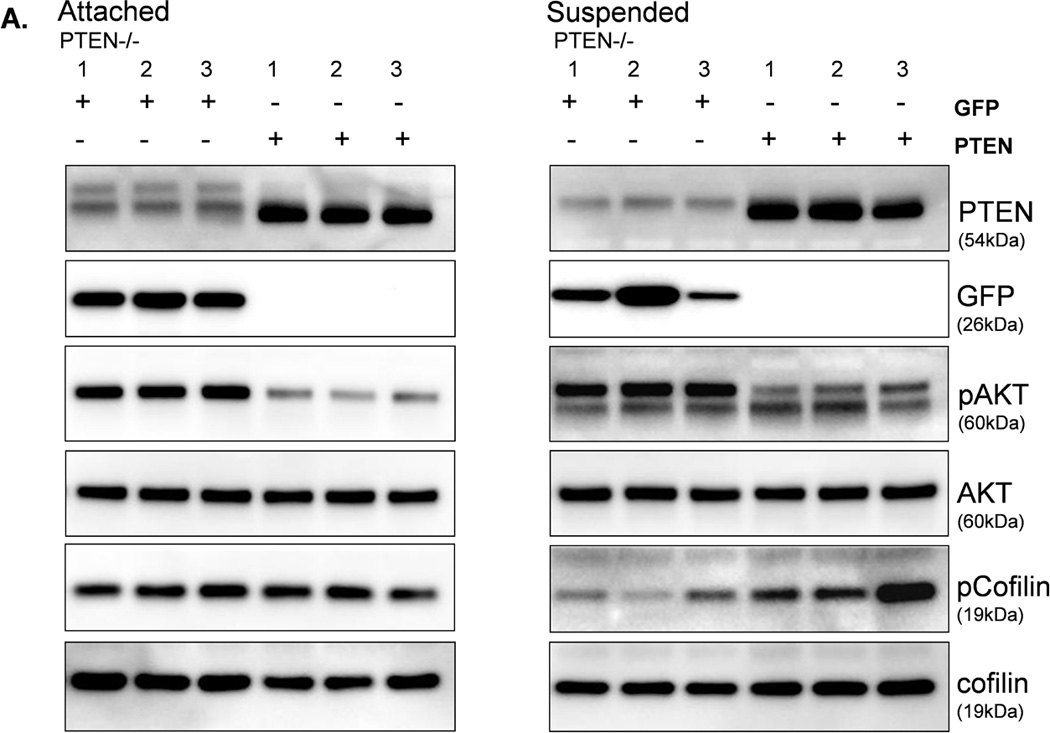
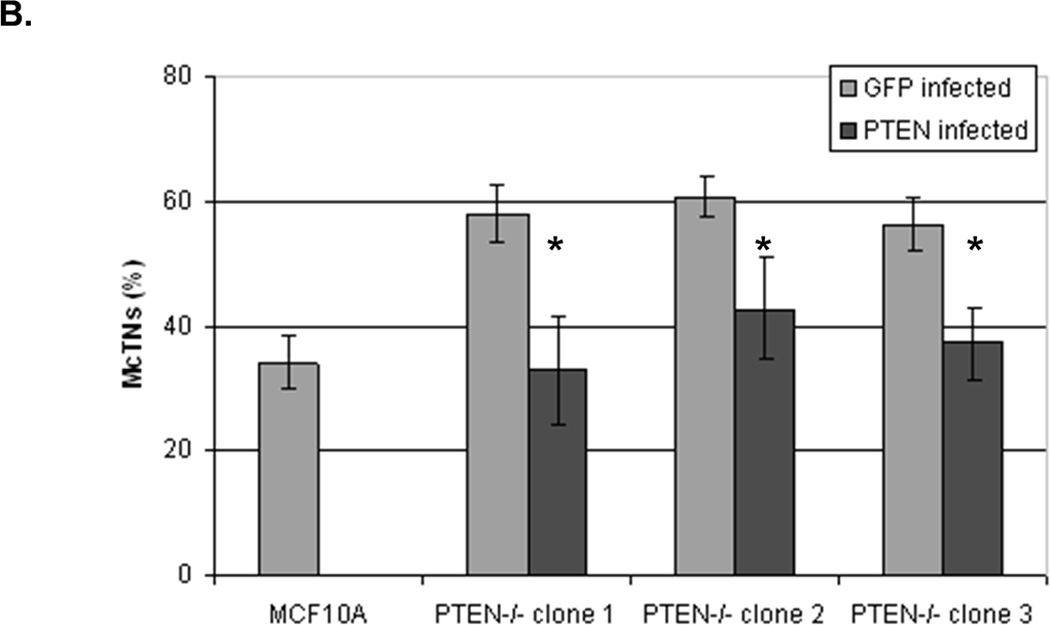
Loss of PTEN tumor suppressor enhances metastatic risk in breast cancer, although the underlying mechanisms are poorly defined. We report that homozygous deletion of PTEN in mammary epithelial cells induces tubulin-based microtentacles (McTNs) that facilitate cell reattachment and homotypic aggregation. Treatment with contractility-modulating drugs showed that McTNs in PTEN(-/-) cells are suppressible by controlling the actin cytoskeleton. Because outward microtubule extension is counteracted by actin cortical contraction, increased activity of actin-severing proteins could release constraints on McTN formation in PTEN(-/-) cells. One such actin-severing protein, cofilin, is activated in detached PTEN(-/-) cells that could weaken the actin cortex to promote McTNs. Expression of wild-type cofilin, an activated mutant (S3A), and an inactive mutant (S3E) demonstrated that altering cofilin phosphorylation directly affects McTNs formation. Chemical inhibition of PI3K did not reduce McTNs or inactivate cofilin in PTEN(-/-) cells. Additionally, knock-in expression of the two most common PI3K-activating mutations observed in human cancer patients did not increase McTNs or activate cofilin. PTEN loss and PI3K activation also caused differential activation of the cofilin regulators, LIM-kinase1 (LIMK) and Slingshot-1L (SSH). Furthermore, McTNs were suppressed and cofilin was inactivated by restoration of PTEN in the PTEN(-/-) cells, indicating that both the elevation of McTNs and the activation of cofilin are specific results arising from PTEN loss. These data identify a novel mechanism by which PTEN loss could remodel the cortical actin network to facilitate McTNs that promote tumor cell reattachment and aggregation. Using isogenic MCF-10A PTEN(-/-) and PIK3CA mutants, we have further demonstrated that there are clear differences in activation of cofilin, LIMK and SSH between PTEN loss and PI3K activation, providing a new evidence that these mutations yield distinct cytoskeletal phenotypes, which could have an impact on tumor biology.


Conflict of interest statement

Conflict of Interest: The PTEN−/− cells are licensed by Horizon Discovery Ltd. (Cambridge, UK). Dr. Vitolo receives compensation from the sale of these cells. All other authors declare no conflict of interest.

Figures

Figure 1
Figure 1. Tubulin-based McTNs are increased on PTEN−/− MECs
A. MCF-10A cells and three PTEN−/− clones were fluorescently stained with CellMask Orange and suspended in an ultra-low attachment plate in complete media. Blinded counting showed a consistent McTN increase in the PTEN−/− cells (n=6, *p<0.002). B. Suspended cell immunofluorescence reveals α-tubulin within the membrane protrusions (green - GFP-mem, red - α-tubulin, blue - Hoechst) (bar = 10µM).
Figure 2
Figure 2. Attachment and homotypic aggregation are enhanced in PTEN−/− cells
A. A greater change in impedance of the PTEN−/− cells illustrates an increase in attachment compared to the MCF-10A cells. Impedance values are normalized to MCF-10A (n=4, representative results from triplicate experiments). B. An equal number of cells were suspended in normal growth media in ultra-low attachment plates. After 48h, only the PTEN−/− cells aggregate into tight, spheroid structures. C. Live cell imaging of two cell populations of the same PTEN clone, one GFP-mem transfected (green) and the other CellMask stained (red), were combined and suspended over a BSA coated glass surface to prevent attachment. Arrows indicate McTNs extending from the GFP-mem cell attaching to a CellMask stained cell. D. 3D computer rendered image of PTEN−/− cells from separate populations (GFP-mem transfected and CellMask stained) associating. Arrows indicate McTNs from the GFP-mem cell contacting the CellMask stained cell.
Figure 3
Figure 3. Decreased contractility enhances McTNs
A. McTNs increase in cells suspended in 50µM blebbistatin (p<0.05), but are suppressed in cells suspended in 20µM ML-7 (p<0.001). B. Suspended cell immunofluorescence of MCF-10A cells and a representative PTEN−/− clone in the presence of 50µM blebbistatin or C. 20 µM ML-7. Induced McTNs contain α-tubulin (green) extending under the actin (red) cortex. Cells treated with ML-7 show no outwardly extending protrusions (bar = 10µM). D. Real time attachment measurements of blebbistatin treated MCF-10A and PTEN−/− cells attach approximately 2-fold quicker at 1 hour compared to the DMSO control cells. At all time points, ML-7 treated cells attached approximately 50% less than that of the controls. Impedance values are normalized to DMSO controls (n=4, representative results from triplicate experiments).
Figure 4
Figure 4. Cofilin is activated in suspended cells, but to a much higher degree in cells without PTEN expression
A. Representative Western blot analysis shows that cofilin is highly phosphorylated (pCofilin) and inactive when cells are attached and dephosphorylated to an active form when cells are detached. B. Densitometry analysis shows that pCofilin levels only decrease 20% in MCF-10A cells after detachment. By comparison, pCofilin levels are reduced 55–75% in PTEN−/− cells, indicating a more robust detachment-induced activation of cofilin in PTEN−/− cells. Levels of pCofilin were normalized to total cofilin in each sample and the ratio of pCofilin in suspended cells compared to attached cells was determined (n=4, *p<0.01). C. MCF-10A cells transfected with vector only (V), cofilin (WT), or mutant cofilin (S3A) and D. PTEN−/−cells transfected with vector only (V), cofilin (WT), or mutant cofilin (S3E) for 24h. Untransfected (NT) and transfected cells were blindly counted for McTNs (n=6, *p<0.01) and analyzed by Western blotting. E. MCF-10A cells were transfected with vector only (V), wild-type Slingshot-1L (SSH WT), or catalytically inactive Slingshot-1L (SSH CS) for 24hr and scored blindly for McTNs (n=6, *p<0.01) or analyzed by Western blotting.
Figure 5
Figure 5. Increased cofilin activity in the PTEN−/− MECs is not due to elevated PI3K or AKT activity
A. Western blot analysis of suspended MCF-10A and PTEN−/− clones in the presence of DMSO vehicle, or treatment with LY294002 (5µM, 10µM, and 20µM). B. Blinded McTNs counts performed on suspended cells in the presence and absence of LY294002 (n=6). C. Blinded McTNs counts performed on suspended MCF-10A and two clones of MCF-10A PIK3CA with the patient-derived E545K activating mutation in exon 9 and two clones of MCF-10A PIK3CA with the patient-derived H1074R mutation in exon 20 (n=6). D. Representative Western blot analysis of attached and suspended MCF-10A cells compared to those bearing the E545K and H1074R PIK3CA mutations. E. Densitometry results show the ratio of suspended normalized pCofilin levels to attached normalized cofilin levels is similar in the MCF-10A and PIK3CA mutant cells (n=3).
Figure 6
Figure 6. LIMK and SSH are differentially regulated by PTEN loss and PIK3CA activation in detached MECs
A. Western blot analysis of attached and suspended MCF-10A and PTEN−/− clones. 293T cells overexpressing SSH and MCF7 cells are used as positive controls for the SSH and LIMK antibodies, respectively. B. Western blot analysis of suspended MCF-10A cells and mutant PI3K clones.
Figure 7
Figure 7. Expression of PTEN decreases activated cofilin and McTNs in PTEN−/− cells
MCF-10A PTEN−/− clones (1, 2, and 3) were infected with either PTEN or GFP (CT) adenovirus once a day for two days. A. Both attached and suspended (1h) cells were analyzed by Western blot for pCofilin (n=3, representative blot) and B. McTNs formation (n=6, *p<0.002).

References

    1. Mehlen P, Puisieux A. Metastasis: a question of life or death. Nat Rev Cancer. 2006 Jun;6(6):449–458. - PubMed
    1. Naumov GN, MacDonald IC, Weinmeister PM, Kerkvliet N, Nadkarni KV, Wilson SM, et al. Persistence of solitary mammary carcinoma cells in a secondary site: a possible contributor to dormancy. Cancer Res. 2002 Apr 1;62(7):2162–2168. - PubMed
    1. Schmidt-Kittler O, Ragg T, Daskalakis A, Granzow M, Ahr A, Blankenstein TJ, et al. From latent disseminated cells to overt metastasis: genetic analysis of systemic breast cancer progression. Proc Natl Acad Sci U S A. 2003 Jun 24;100(13):7737–7742. - PMC - PubMed
    1. Chambers AF, Groom AC, MacDonald IC. Dissemination and growth of cancer cells in metastatic sites. Nat Rev Cancer. 2002 Aug;2(8):563–572. - PubMed
    1. Yamaguchi H, Wyckoff J, Condeelis J. Cell migration in tumors. Curr Opin Cell Biol. 2005 Oct;17(5):559–564. - PubMed

Publication types

MeSH terms