

Nanoparticle based galectin-1 gene silencing, implications in methamphetamine regulation of HIV-1 infection in monocyte derived macrophages
- PMID: 22689223
- PMCID: PMC3419803
- DOI: 10.1007/s11481-012-9379-7
Nanoparticle based galectin-1 gene silencing, implications in methamphetamine regulation of HIV-1 infection in monocyte derived macrophages
Abstract
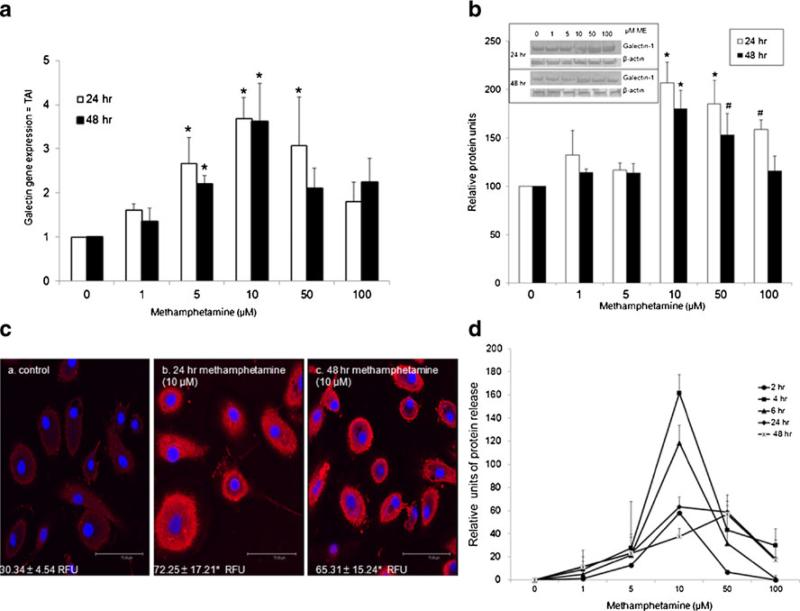
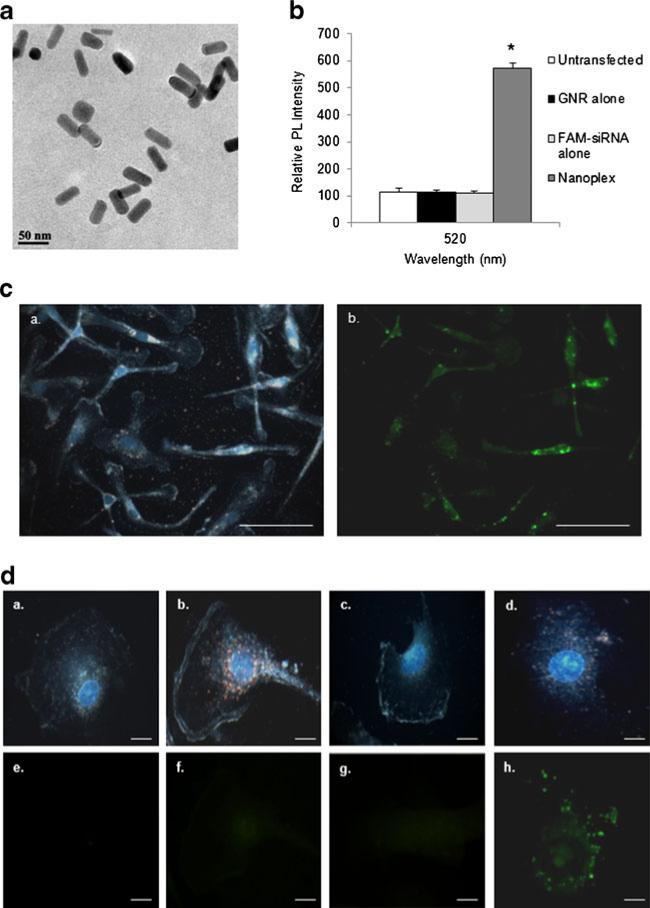
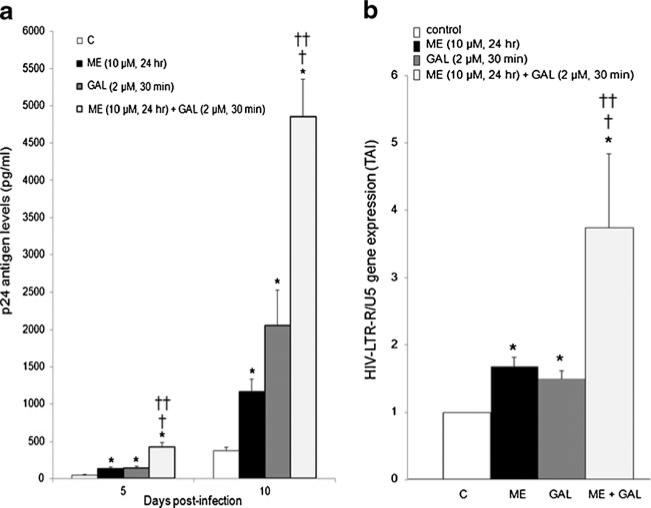
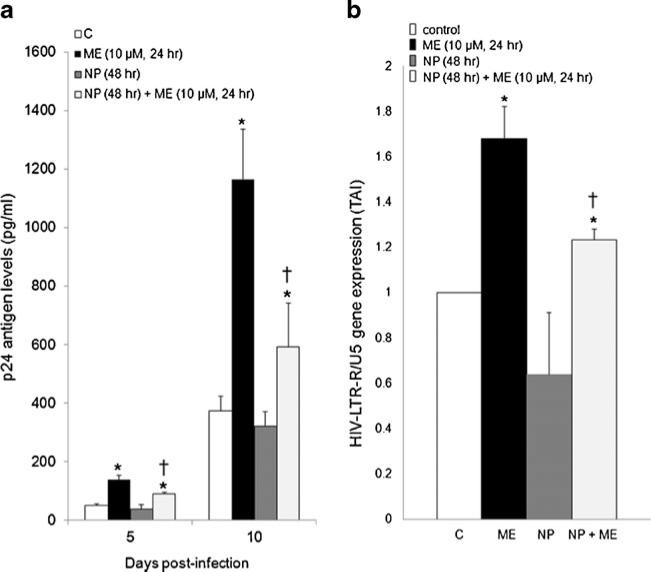
Galectin-1, an adhesion molecule, is expressed in macrophages and implicated in human immunodeficiency virus (HIV-1) viral adsorption. In this study, we investigated the effects of methamphetamine on galectin-1 production in human monocyte derived macrophages (MDM) and the role of galectin-1 in methamphetamine potentiation of HIV-1 infection. Herein we show that levels of galectin-1 gene and protein expression are significantly increased by methamphetamine. Furthermore, concomitant incubation of MDM with galectin-1 and methamphetamine facilitates HIV-1 infection compared to galectin-1 alone or methamphetamine alone. We utilized a nanotechnology approach that uses gold nanorod (GNR)-galectin-1 siRNA complexes (nanoplexes) to inhibit gene expression for galectin-1. Nanoplexes significantly silenced gene expression for galectin-1 and reversed the effects of methamphetamine on galectin-1 gene expression. Moreover, the effects of methamphetamine on HIV-1 infection were attenuated in the presence of the nanoplex in MDM.
Figures

Similar articles
-
Morphine and galectin-1 modulate HIV-1 infection of human monocyte-derived macrophages.J Immunol. 2012 Apr 15;188(8):3757-65. doi: 10.4049/jimmunol.1102276. Epub 2012 Mar 19. J Immunol. 2012. PMID: 22430735 Free PMC article.
-
Galectin-1 promotes HIV-1 infectivity in macrophages through stabilization of viral adsorption.Virology. 2008 Feb 5;371(1):121-9. doi: 10.1016/j.virol.2007.09.034. Epub 2007 Oct 29. Virology. 2008. PMID: 18028978
-
Dendritic cell-specific intercellular adhesion molecule-3 grabbing nonintegrin mediates HIV-1 infection of and transmission by M2a-polarized macrophages in vitro.AIDS. 2013 Mar 13;27(5):707-16. doi: 10.1097/QAD.0b013e32835cfc82. AIDS. 2013. PMID: 23211775 Free PMC article.
-
Galectin-1 and HIV-1 Infection.Methods Enzymol. 2010;480:267-94. doi: 10.1016/S0076-6879(10)80013-8. Methods Enzymol. 2010. PMID: 20816214 Review.
-
Modulation of intracellular restriction factors contributes to methamphetamine-mediated enhancement of acquired immune deficiency syndrome virus infection of macrophages.Curr HIV Res. 2012 Jul;10(5):407-14. doi: 10.2174/157016212802138797. Curr HIV Res. 2012. PMID: 22591364 Free PMC article. Review.
Cited by
-
Methamphetamine induces transcriptional changes in cultured HIV-infected mature monocytes that may contribute to HIV neuropathogenesis.Front Immunol. 2022 Aug 18;13:952183. doi: 10.3389/fimmu.2022.952183. eCollection 2022. Front Immunol. 2022. PMID: 36059515 Free PMC article.
-
Nanoparticle-mediated systemic delivery of siRNA for treatment of cancers and viral infections.Theranostics. 2014 Jun 11;4(9):872-92. doi: 10.7150/thno.9404. eCollection 2014. Theranostics. 2014. PMID: 25057313 Free PMC article. Review.
-
Nanotechnology Approaches for the Delivery of Exogenous siRNA for HIV Therapy.Mol Pharm. 2015 Dec 7;12(12):4175-87. doi: 10.1021/acs.molpharmaceut.5b00335. Epub 2015 Nov 9. Mol Pharm. 2015. PMID: 26524196 Free PMC article. Review.
-
Galectin-1 Reduces Neuroinflammation via Modulation of Nitric Oxide-Arginase Signaling in HIV-1 Transfected Microglia: a Gold Nanoparticle-Galectin-1 "Nanoplex" a Possible Neurotherapeutic?J Neuroimmune Pharmacol. 2017 Mar;12(1):133-151. doi: 10.1007/s11481-016-9723-4. Epub 2016 Dec 27. J Neuroimmune Pharmacol. 2017. PMID: 28028734
-
Towards nanomedicines for neuroAIDS.Rev Med Virol. 2014 Mar;24(2):103-24. doi: 10.1002/rmv.1778. Epub 2014 Jan 7. Rev Med Virol. 2014. PMID: 24395761 Free PMC article. Review.
References
-
- Barondes SH, Cooper DN, Gitt MA, Leffler H. Galectins. Structure and function of a large family of animal lectins. J Biol Chem. 1994;269(33):20807–20810. - PubMed
Publication types
MeSH terms
Substances
Grants and funding
LinkOut - more resources
Full Text Sources
Medical
Research Materials
